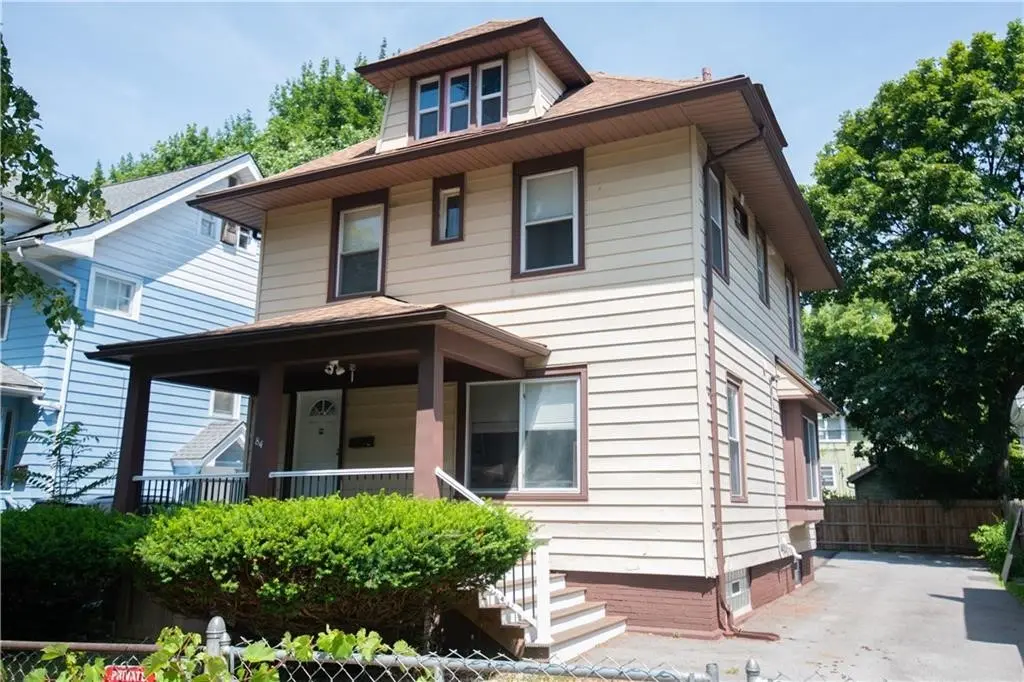
84 Ellicott St · Rochester, NY
Flood risk 6/10 · Moderate
- FEMA flood zone
- X (unshaded)
- Chance of flooding over 30 yrs
- 0.7%
- Est. flood insurance / yr
- $473 – $860
Fire risk 1/10 · Minimal
- Est. fire insurance / yr
- $691 – $1,283
Heat risk 2/10 · Minimal
- Hot days now (above 96°F)
- 7 days/yr
- Hot days in 30 yrs
- 15 days/yr
Wind risk 1/10 · Minimal
- Chance of severe wind over 30 yrs
- —
Air-quality risk 2/10 · Minimal
- Unhealthy air days now
- 1 days/yr
- Unhealthy air days in 30 yrs
- 1 days/yr
Risk factors via First Street. Map © Google.
Why this score? — see what drove the F grade
The composite is a weighted blend of 9 inputs, each scored 0–100. Each bar is that input's sub-score; the figure is the points it added to the 100-point composite (weight × sub-score).
- Cash flow +15.9/30.0
- DSCR +4.9/10.0
- Livability +3.8/5.0
- 1% rule +3.2/10.0
- Rent growth +2.5/5.0
- Condition / age +2.5/5.0
- Schools +1.9/10.0
- ARV discount +0.0/15.0
- Appreciation +0.0/10.0
$229,900
🖨 Deal sheet 📄 Offer letter ✓ Due diligence
Listing remarks MLS
Hardwood floors, open kitchen, large picture windows, basement, garage and front covered porch. These are just a few features for this 4 bedrooms, 2 bath Colonial with approximately 1,504 SF. Property is in need of repairs. Make an offer today.
Key facts
- Finished basement
- New cabinetry
- Brand new ac
Tags
Property features AI
Exterior
- Parking: Driveway (no garage)
- Utilities: High-speed internet available; Public water connected; Sewer connected
- Home design: Two-story home; Existing (pre-owned) condition
- Construction: Vinyl siding; Architectural shingle roof; Block foundation; Partially finished full basement
- Exterior features: Blacktop driveway; Open porch
Interior
- Kitchen: Dishwasher; Gas oven; Gas range; Microwave; Refrigerator
- Bedrooms: One main-level bedroom
- Flooring: Hardwood; Luxury vinyl; Tile; Varied flooring
- Bathrooms: Three full bathrooms; One half bathroom; One bathroom on the main level
- Heating & cooling: Gas forced-air heating; Central air conditioning
- Interior features: Ceiling fans; Eat-in kitchen; Granite counters; Kitchen island; Pantry; Main-level primary suite; Programmable thermostat
- Laundry & utility: Gas water heater
Neighborhood map
What this means for you Summary
Snapshot
- This is a 4-bed/2.0-bath single-family listed at $230k.
Deal economics
- At list price, monthly cash flow is $109 ($1k/yr) — positive.
- The deal already cash-flows at list — no discount required.
- To meet the 1% rule (rent ≥ 1% of price), the offer needs to be $188k (18.3% below list).
- Recommended offer: $188k (18.3% below list) — sets the bar for 1% rule.
- Cap rate 6.9% vs local median 9.3% in Rochester — below-typical yield; the buyer is paying a premium for something (appreciation thesis, condition, location) that the cap rate doesn't capture.
Location & tenants
- Location reads 76/100 on livability (#222 in NY, #3,482 nationally) — a middle-class / working-renter tenant base. Strengths: commute A+, cost of living A+, housing A+; Watch: schools D+, crime F, employment F.
- Rochester City School District (urban): math 21% / reading 26% proficiency, ranked #589 of 590 in NY (top 100%) — low school quality limits family demand, transient renter base, plan for 1-2y turnover; 82% free/reduced lunch — lower-income household profile, screen leases tightly.
- Market conditions: 48 active listings in the ZIP; 24 comparable units currently listed for rent nearby; rentals at typical pace (median 15d on market — plan ~3-4 weeks tenant-placement turnaround); 1,169 units permitted in Monroe County in 2024 (591 in 5+ unit buildings).
Forward outlook
- Local home prices are declining (-3.0%/yr); year-one equity from $2k of loan paydown is wiped out by about $7k of value loss. Plan a longer hold.
- Monroe County population projected to shrink 6% by 2050 — rents likely to lag national; underwrite the cash flow, not the appreciation.
Negotiation context
- It's been on market 18 days — a 2% lower offer ($226k) is reasonable based on typical stale-listing flexibility.
- 3 sale attempts since 5y ago with the ask held roughly flat each time — persistent listings suggest the price (not the market) is what's stuck; bring a comps-based counter.
- Current owner paid $80k; list at $230k implies a 186% gain — meaningful room to come down on a strong offer.
Risks & watch-outs
- Watch-outs: built in 1925 — expect roof / HVAC / electrical / plumbing capex.
- Climate carrying-cost: major flood risk — expect insurance premiums to compound above CPI over the hold.
Questions for the listing agent
- Built in 1925 — when were the roof, HVAC, electrical panel, plumbing, and water heater last replaced?
- Is there a deadline driving the sale (1031 exchange, divorce, estate, relocation)? That informs how much negotiation room exists.
- Schools are D-rated, which usually means shorter tenancies and higher turnover. Who's the typical renter profile here, and what's been the actual vacancy rate?
- Crime grade is F in this area — have there been break-ins, vandalism, or insurance claims at this property in the last 3 years? What carrier currently insures it and at what premium?
- The area grade is low — what's the realistic commute time and amenity access for the typical tenant pool here? Any planned neighborhood developments (good or bad) we should know about?
- What's the average days-on-market for RENTAL listings here right now (not sales)? A rising rental-DOM trend means longer vacancies and softer asking-rent achievability than the comps imply.
- What's the recent tenant-quality profile in this submarket — average credit score on applications, eviction rate, late-payment / NSF rate, and stable-employment percentage? A property-management company in the area should have these aggregated.
- How much new for-sale + rental construction is in the pipeline within 1–3 miles? Heavy new supply typically softens prices + rents 12–24 months out; constrained supply supports both.
Investment metrics
- 1% rule
- 0.82% ✗
- Cap rate
- 6.86%
- Cash-on-cash
- 2.04%
- DSCR
- 1.09
- GRM
- 10.2
CMA / ARV
- ARV (on-the-fly)
- $194,016
- Comps found
- 12
Show comp detail 12 sales within ~0.75 mi
| Address | Dist | Beds/Ba | Sqft | Sold | Price | $/sf | Match |
|---|---|---|---|---|---|---|---|
| 84 Ellicott St | 0.00mi | 3/3.5 (-1) | 1,504 (0%) | 0mo | $223,000 | $148 | 89 |
| 117 Millbank St | 0.14mi | 4/2.0 | 1,639 (+9%) | 1mo | $173,000 | $106 | 78 |
| 43 Stanfield Ter | 0.36mi | 3/1.0 (-1) | 1,526 (+2%) | 0mo | $170,000 | $111 | 72 |
| 88 Monica St | 0.18mi | 4/1.0 | 1,342 (-11%) | 2mo | $97,500 | $73 | 68 |
| 53 Congress Ave | 0.37mi | 4/2.0 | 1,625 (+8%) | 2mo | $205,000 | $126 | 68 |
| 15 Brookscrest Way | 0.53mi | 3/2.5 (-1) | 1,562 (+4%) | 1mo | $329,900 | $211 | 62 |
| 1283 Plymouth Ave S | 0.54mi | 4/2.0 | 1,621 (+8%) | 1mo | $200,000 | $123 | 61 |
| 14 Burlington Ave | 0.23mi | 3/1.5 (-1) | 1,721 (+14%) | 1mo | $230,000 | $134 | 58 |
| 797 Seward St | 0.43mi | 3/1.5 (-1) | 1,336 (-11%) | 1mo | $170,000 | $127 | 54 |
| 780 Genesee Park Blvd | 0.63mi | 3/2.5 (-1) | 1,420 (-6%) | 1mo | $230,000 | $162 | 53 |
| 18 Melrose St | 0.44mi | 4/1.5 | 1,286 (-14%) | 2mo | $180,000 | $140 | 52 |
| 316 Ravenwood Ave | 0.74mi | 3/1.0 (-1) | 1,360 (-10%) | 1mo | $175,000 | $129 | 40 |
Match score weights: distance 35% · size 25% · config 20% · recency 20%. Top-matched comps best support the ARV.
Projected returns pro-forma
-3.0% appreciation · 3.0% rent growth · sell at horizon
- IRR
- -13.1%
- Equity multiple
- 0.53×
- Total profit
- $-30,398
- Equity at exit
- $34,279
- IRR
- -4.2%
- Equity multiple
- 0.72×
- Total profit
- $-17,928
- Equity at exit
- $19,878
Cash invested: $64,372 (down + closing). Projections, not guarantees.
Landlord ↔ Tenant lean methodology
- Overall (STATE)
- 15 Strongly Tenant-Friendly
- State New York
- 15 Strongly Tenant-Friendly · D+10
- County
- — inherits STATE
- City
- — inherits STATE
ZIP-level market 14619
- Home prices YoY
- -10.0%
- Active inventory
- 48
- Price-to-rent
- 10.2×
Monthly cashflow live
- Estimated rent
- $1,879 high interval (Pro) →
- Mortgage (P&I)
- −$1,206
- Tax from tax record
- −$74 /mo · $888/yr
- Insurance
- −$96
- HOA
- −$0
- Vacancy / Maint / Mgmt
- −$395
- Net cashflow
- $109
Break-even live
UW: 25.0% down · 7.5% · 30yr · 1.5% tax · 5.0% vac · 8.0% maint · 8.0% mgmt
Financing live
Cash to close
- Down payment
- $57,475
- Closing costs
- $6,897
- Reserves months
- —
- Total cash needed
- —
Loan-product check · same deal, 3 products live
Conventional
25% down · 7.5% · 30yr
- Down + closing
- —
- Monthly P&I
- —
- Monthly cashflow
- —
- DSCR
- —
- Eligible?
- —
Personal DTI + credit; lowest rate.
DSCR
20% down · 8.5% · 30yr
- Down + closing
- —
- Monthly P&I
- —
- Monthly cashflow
- —
- DSCR
- —
- Eligible?
- —
No personal income docs; deal must DSCR.
Hard money
10% down · 12.0% · 12mo
- Down + closing
- —
- Monthly P&I
- —
- Monthly cashflow
- —
- DSCR
- —
- Eligible?
- —
Short-term bridge; refi at stabilization.
Rent comps 24 comps
| Address | Beds | Baths | Sqft | Rent | $/sqft | DOM | Units | Dist |
|---|---|---|---|---|---|---|---|---|
| 79 Evangeline St Rochester, NY | 3.0 | 2.0 | 1876 | $2,500 | $1.33 | 3d | 1 | 0.15mi |
| 485 Sawyer St Rochester, NY | 3.0 | 1.0 | 1400 | $1,900 | $1.36 | 3d | 1 | 0.23mi |
| 485 Sawyer St Unit 1 Rochester, NY | 3.0 | 1.0 | 1400 | $1,900 | $1.36 | 44d | 1 | 0.23mi |
| 30 Flanders St Rochester, NY | 3.0 | 1.5 | 1170 | $1,650 | $1.41 | 14d | 1 | 0.26mi |
| 793 Woodbine Ave Rochester, NY | 4.0 | 1.0 | 1700 | $2,200 | $1.29 | 3d | 1 | 0.30mi |
| 444-450 Brooks Ave Unit 446 Rochester, NY | 4.0 | 2.0 | 1150 | $3,100 | $2.70 | 10d | 1 | 0.33mi |
| 127 Congress Ave Rochester, NY | 3.0 | 1.0 | 1200 | $1,595 | $1.33 | 44d | 1 | 0.35mi |
| 102 Virginia Ave Rochester, NY | 4.0 | 1.5 | 1453 | $2,150 | $1.48 | 3d | 1 | 0.42mi |
| 132 Anthony St Rochester, NY | 3.0 | 1.0 | 1260 | $1,500 | $1.19 | 3d | 1 | 0.42mi |
| 686 Seward St Rochester, NY | 3.0 | 1.5 | 1166 | $1,600 | $1.37 | 44d | 1 | 0.56mi |
| 1317 Genesee St Rochester, NY | 3.0 | 2.0 | 1720 | $2,550 | $1.48 | 3d | 1 | 0.64mi |
| 367 Hawley St Rochester, NY | 4.0 | 1.5 | 1210 | $1,395 | $1.15 | 44d | 1 | 0.70mi |
| 190 Warwick Ave Rochester, NY | 3.0 | 1.5 | 1240 | $1,400 | $1.13 | 44d | 1 | 0.72mi |
| 192 Bartlett St Unit 192 Rochester, NY | 3.0 | 1.0 | 1099 | $1,295 | $1.18 | 14d | 1 | 0.82mi |
| 249 1/2 Columbia Ave #249 Rochester, NY | 3.0 | 1.0 | 1600 | $1,300 | $0.81 | 14d | 1 | 0.91mi |
| 161 Fillmore St Rochester, NY | 4.0 | 2.0 | 1612 | $1,400 | $0.87 | 14d | 1 | 0.96mi |
| 48 Thorndale Ter Rochester, NY | 4.0 | 1.5 | 1700 | $1,400 | $0.82 | 14d | 1 | 1.05mi |
| 136 Garfield St Rochester, NY | 3.0 | 1.0 | 1152 | $1,200 | $1.04 | 19d | 1 | 1.10mi |
| 193 Reynolds St Rochester, NY | 3.0 | 1.5 | 1342 | $1,800 | $1.34 | 21d | 1 | 1.10mi |
| 32 Stanton St Rochester, NY | 3.0 | 1.0 | 1390 | $1,500 | $1.08 | 10d | 1 | 1.11mi |
| 478 Tremont St Rochester, NY | 3.0 | 2.0 | 1424 | $1,500 | $1.05 | 44d | 1 | 1.19mi |
| 175 Lattimore Rd Rochester, NY | 3.0 | 1.0 | 1480 | $2,265 | $1.53 | 14d | 1 | 1.37mi |
| 59 Gold St Rochester, NY | 3.0 | 1.5 | 1264 | $2,000 | $1.58 | 44d | 1 | 1.47mi |
| 839 Elmwood Ave Rochester, NY | 3.0 | 1.0 | 1500 | $2,600 | $1.73 | 23d | 1 | 1.48mi |
Listing history 10 events
-
2026-04-27status Pending
-
2026-04-20price $229,900
-
2026-04-09$234,900 Active
-
2025-12-28historical
-
2025-09-23price $234,900
-
2025-07-28$209,900 Active
-
2021-06-16soldstatus $80,500 Closed Sale or Rented 244-char remark
Show marketing remark (244 chars)
Hardwood floors, open kitchen, large picture windows, basement, garage and front covered porch. These are just a few features for this 4 bedrooms, 2 bath Colonial with approximately 1,504 SF. Property is in need of repairs. Make an offer today.
-
2021-05-23status Pending Sale 244-char remark
Show marketing remark (244 chars)
Hardwood floors, open kitchen, large picture windows, basement, garage and front covered porch. These are just a few features for this 4 bedrooms, 2 bath Colonial with approximately 1,504 SF. Property is in need of repairs. Make an offer today.
-
2021-04-29$37,100 Active 244-char remark
Show marketing remark (244 chars)
Hardwood floors, open kitchen, large picture windows, basement, garage and front covered porch. These are just a few features for this 4 bedrooms, 2 bath Colonial with approximately 1,504 SF. Property is in need of repairs. Make an offer today.
-
2000-06-19soldstatus $47,000
ⓘ Source: listings_history table (triggers on properties + properties_extension) + one-shot
backfill from property_details.listing_events for pre-trigger history.
Tax reassessment forecast NY · Partial reset (capped growth)
- Current annual tax
- $888 · $74/mo
- Projected year-2 tax
- $2,387 · $199/mo
- Expected delta
- +$1,499/yr (+$125/mo · 168.7%)
ⓘ Screening estimate from a state-policy table — verify with the county assessor before closing.
Climate risk First Street
- Flood 6/10 Major FEMA zone X (unshaded) · 70% chance over 30 yrs
- Wildfire 1/10 Low
- Heat 2/10 Low 7 d/yr ≥96°F today · 15 d/yr by 30 yrs out
- Wind 1/10 Low
- Air quality 2/10 Low 1 unhealthy d/yr today · 1 by 30 yrs out
Nearby sold comps map
Loading sold comps map…
Walkable amenities ~0.75 mi
Loading nearby amenities…
Taxation est. · year 1
- Rental income
- $22,552
- − Mortgage interest
- −$12,878
- − Property taxes
- −$888
- − Insurance
- −$1,150
- − Repairs & maintenance
- −$1,804
- − Management
- −$1,804
- − Depreciation
- −$6,688
- Taxable loss
- −$2,660
- Est. tax savings @ 24.0%
- +$638
- After-tax cash flow
- $1,949/yr
For passive investors: Depreciation is non-cash, so a rental often shows a tax loss while cash-flowing — sheltering income. Rental losses are passive: they offset passive income freely, and up to $25,000/yr can offset ordinary (W-2) income if you actively participate and your MAGI is under $100k (phasing out to $0 by $150k); unused losses carry forward. On sale, claimed depreciation is recaptured at up to 25%, and gains may owe capital-gains tax (a 1031 exchange can defer both). Figures are a year-1 estimate at your 24.0% rate — not tax advice; consult a CPA.
Schools (NCES district)
- District
- Rochester City School District
- NCES district ID
- 3624750
- Math proficiency
- 21% ▬ 0.00%
- Reading proficiency
- 26% ▲ 4.00%
- Median HH income
- $30,923
- Composite
- 18.98/100
- National rank
- #8850
- State rank
- #589 of 590 in NY
Livability — Rochester
- Score
- 76/100
- State rank
- #222
- US rank
- #3482
Category grades
Schools grade is shown separately in the Schools card above.
Census & demographics
- Census place
- Rochester, NY
- City population
- 432,803
- Population (ZIP)
- 14,223
Population outlook (Monroe County) Hauer SSP2
- Today (2025)
- 759,460 people
- By 2030
- 757,154 · -0.3%
- By 2040
- 740,644 · -2.5%
- By 2050
- 714,443 · -5.9%
- By 2075
- 645,883 · -15.0%
- By 2100
- 547,084 · -28.0%
Race, ethnicity, and origin ACS 2023
- Neighborhood character
- Predominantly Black (66%)
- Race & ethnicity
- Black 66% White 20% Two or more races 8% Hispanic / Latino 6% Asian 1%
- Hispanic origin (detail)
- Puerto Rican 5%
- Common ancestry
- Romanian 2% Swedish 1% Lithuanian 1%
- Foreign-born
- 8% · Canada
- Languages at home
- 92% English-only · Spanish 3% Arabic 1% French/Haitian/Cajun 1%
Political lean MEDSL · Monroe
- 2024 margin
- D (+19.1) · D 59.5% · R 40.5%
- 2008→2024 swing
- +1.4pp toward D · 2008: 17.7pp · 2024: 19.1pp
- All cycles
- 2024: D+19.1 2020: D+21.0 2016: D+14.1 2012: D+17.4 2008: D+17.7
Not yet ingested
- Civics
- —
Market trends
- HPI YoY
- ▼ -30.67%
- Current HPI
- 276.3851
- Rent YoY
- —
- Metro
- —
- State GDP YoY
- ▲ 2.60%
- F500 in state
- 92
Industry mix (Fortune 500 HQ in NY)
| Industry | F500 HQs | Revenue |
|---|---|---|
| Financial Services | 10 | $950B |
|
||
| Consumer Goods | 9 | $162B |
|
||
| Insurance | 4 | $225B |
|
||
| Telecommunications | 2 | $144B |
|
||
| Pharmaceuticals | 2 | $112B |
|
||
| Media / Entertainment | 2 | $69B |
|
||
Price history
+389.1% since first listed10 events — show timeline
- 2026-04-27 Pending — UNYREIS
- 2026-04-20 Price Changed $229,900 UNYREIS
- 2026-04-09 Listed $234,900 UNYREIS
- 2025-12-28 Listing Removed — UNYREIS
- 2025-09-23 Price Changed $234,900 UNYREIS
- 2025-07-28 Listed $209,900 UNYREIS
- 2021-06-16 Sold (MLS) $80,500 UNYREIS
- 2021-05-23 Pending — UNYREIS
- 2021-04-29 Listed $37,100 UNYREIS
- 2000-06-19 Sold (Public Records) $47,000 Public Records
Property tax history
+1.0%/yrLatest (2025): $888 · +0.0% YoY. Source: county tax records.
Cash-flow waterfall
monthlySold comps — $/sqft
last 12 mo · ≤1 miLoading sold comps…