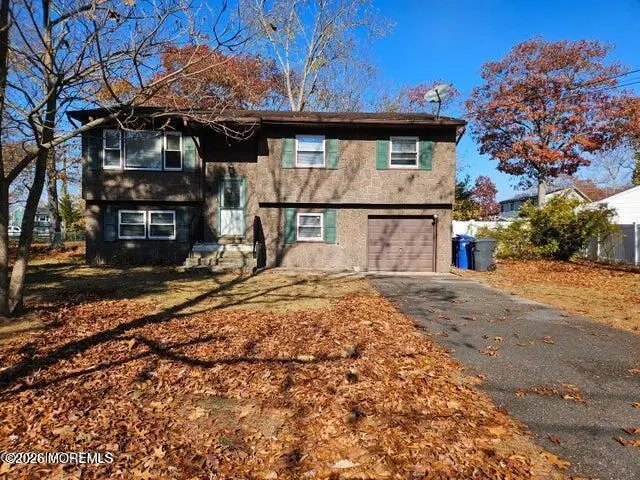
23 Almond Dr · Toms River, NJ
Flood risk 1/10 · Minimal
- FEMA flood zone
- X (unshaded)
- Chance of flooding over 30 yrs
- 0.0%
- Est. flood insurance / yr
- $507 – $1,088
Fire risk 2/10 · Minimal
- Est. fire insurance / yr
- $526 – $976
Heat risk 8/10 · Major
- Hot days now (above 96°F)
- 7 days/yr
- Hot days in 30 yrs
- 15 days/yr
Wind risk 8/10 · Major
- Chance of severe wind over 30 yrs
- 80.0%
Air-quality risk 3/10 · Minor
- Unhealthy air days now
- 3 days/yr
- Unhealthy air days in 30 yrs
- 4 days/yr
Risk factors via First Street. Map © Google.
Why this score? — see what drove the D grade
The composite is a weighted blend of 9 inputs, each scored 0–100. Each bar is that input's sub-score; the figure is the points it added to the 100-point composite (weight × sub-score).
- ARV discount +15.0/15.0
- Cash flow +8.5/30.0
- Livability +4.0/5.0
- Rent growth +2.9/5.0
- Schools +2.9/10.0
- Condition / age +2.5/5.0
- 1% rule +2.4/10.0
- DSCR +2.3/10.0
- Appreciation +0.0/10.0
$499,900
🖨 Deal sheet 📄 Offer letter ✓ Due diligence
Listing remarks MLS
5BR 2BA home nestled in the heart of desirable Silverton. Hardwood floors throughout the main floor, plush carpeting on the lower level. Large kitchen with ample cabinet space and fully fenced in yard on a corner lot. Full bath on each floor for convenience. Come be a part of Silverton's thriving community today!
Key facts
- Large kitchen
- Ample cabinet space
- Fully fenced yard
Tags
Neighborhood map
What this means for you Summary
Snapshot
- This is a 5-bed/2.0-bath single-family listed at $500k.
Deal economics
- At list price, monthly cash flow is $-435 ($-5k/yr) — negative.
- To cash-flow at today's rent, offer at most $423k (15.4% below list).
- To meet the 1% rule (rent ≥ 1% of price), the offer needs to be $368k (26.3% below list).
- Recommended offer: $368k (26.3% below list) — sets the bar for 1% rule.
- Cap rate 5.2% vs local median 3.8% in Toms River — top-decile yield for the area; either an underpriced asset or a hidden risk that comps aren't pricing in. Stress-test before assuming the spread holds.
Location & tenants
- Location reads 81/100 on livability (#61 in NJ, #1,538 nationally) — a professional / high-income tenant draw. Strengths: employment A+, housing A+, health & safety A+; Watch: commute D, cost of living F.
- Toms River Regional School District (suburban): math 18% / reading 44% proficiency, ranked #316 of 472 in NJ (top 67%) — families likely to look elsewhere, expect single-tenant / working-renter base with shorter leases.
- Market conditions: Rents rising (+1.5%/yr); 424 active listings in the ZIP; 1 comparable units currently listed for rent nearby; solid renter incomes; 4,434 units permitted in Ocean County in 2024 (868 in 5+ unit buildings).
- This rent runs 42% of the median local income ($105k/yr) — at the standard rent-burdened threshold; future hikes will face affordability resistance.
Forward outlook
- Local home prices are declining (-3.0%/yr); year-one equity from $3k of loan paydown is wiped out by about $15k of value loss. Plan a longer hold.
- Ocean County population projected to shrink 8% by 2050 — rents likely to lag national; underwrite the cash flow, not the appreciation.
Negotiation context
- It's been on market 72 days — a 6% lower offer ($470k) is reasonable based on typical stale-listing flexibility.
- 4 sale attempts since 14y ago with the ask held roughly flat each time — persistent listings suggest the price (not the market) is what's stuck; bring a comps-based counter.
- Current owner paid $150k; list at $500k implies a 233% gain — meaningful room to come down on a strong offer.
Risks & watch-outs
- Climate carrying-cost: severe wind risk, 80% chance of damaging wind over 30y; extreme-heat days projected 7→15/yr by 2055 (HVAC capex compounding) — expect insurance premiums to compound above CPI over the hold.
Questions for the listing agent
- What do current leases actually rent for vs. the listed asking? Can we see a recent rent roll and the last 12 months of T-12 income?
- It's been on market 72 days. Have you received any prior offers? Is the seller open to a 26% concession, seller financing, or rate buy-down credit?
- Built in 1966 — when were the roof, HVAC, electrical panel, plumbing, and water heater last replaced?
- Why hasn't it sold? Are there any deal-killer items the seller is aware of (foundation, flood, title, zoning, code violations)?
- Is there a deadline driving the sale (1031 exchange, divorce, estate, relocation)? That informs how much negotiation room exists.
- The area grade is low — what's the realistic commute time and amenity access for the typical tenant pool here? Any planned neighborhood developments (good or bad) we should know about?
- What's the average days-on-market for RENTAL listings here right now (not sales)? A rising rental-DOM trend means longer vacancies and softer asking-rent achievability than the comps imply.
- What's the recent tenant-quality profile in this submarket — average credit score on applications, eviction rate, late-payment / NSF rate, and stable-employment percentage? A property-management company in the area should have these aggregated.
- How much new for-sale + rental construction is in the pipeline within 1–3 miles? Heavy new supply typically softens prices + rents 12–24 months out; constrained supply supports both.
Investment metrics
- 1% rule
- 0.74% ✗
- Cap rate
- 5.25%
- Cash-on-cash
- -3.73%
- DSCR
- 0.83
- GRM
- 11.3
CMA / ARV
- ARV (median comp)
- $609,546
- List price
- $499,900
- Delta
- -17.99%
- Verdict
- UNDERPRICED
- Comps
- 20 within 1.0 mi
Show comp detail 12 sales within ~0.75 mi
| Address | Dist | Beds/Ba | Sqft | Sold | Price | $/sf | Match |
|---|---|---|---|---|---|---|---|
| 47 Oak Hill Dr | 0.16mi | 4/2.0 (-1) | 1,593 (+0%) | 12mo | $585,000 | $367 | 78 |
| 130 Shasta Ln | 0.30mi | 5/2.0 | 1,746 (+10%) | 9mo | $565,000 | $324 | 63 |
| 68 Shasta Ln | 0.33mi | 4/1.5 (-1) | 1,592 (0%) | 21mo | $539,900 | $339 | 60 |
| 100 Aida Way | 0.48mi | 4/2.0 (-1) | 1,588 (-0%) | 17mo | $605,000 | $381 | 58 |
| 113 Holly Tree Ln | 0.56mi | 4/2.0 (-1) | 1,612 (+1%) | 12mo | $550,000 | $341 | 57 |
| 144 Marilyn Dr | 0.60mi | 4/1.5 (-1) | 1,588 (-0%) | 13mo | $590,000 | $372 | 54 |
| 27 Shasta Ln | 0.44mi | 4/2.0 (-1) | 1,522 (-4%) | 20mo | $485,000 | $319 | 51 |
| 18 Silver Creek Ln | 0.33mi | 4/2.0 (-1) | 1,413 (-11%) | 15mo | $440,000 | $311 | 49 |
| 37 Bimini Rd | 0.65mi | 4/2.0 (-1) | 1,743 (+10%) | 11mo | $600,000 | $344 | 39 |
| 230 Aldo Dr | 0.70mi | 4/2.0 (-1) | 1,668 (+5%) | 22mo | $536,000 | $321 | 36 |
| 200 Silver Bay Rd | 0.72mi | 4/2.0 (-1) | 1,823 (+14%) | 5mo | $408,000 | $224 | 33 |
| 19 Ardmore Dr | 0.72mi | 4/1.5 (-1) | 1,388 (-13%) | 8mo | $490,000 | $353 | 31 |
Match score weights: distance 35% · size 25% · config 20% · recency 20%. Top-matched comps best support the ARV.
Projected returns pro-forma
-3.0% appreciation · 1.49% rent growth · sell at horizon
- IRR
- -24.2%
- Equity multiple
- 0.18×
- Total profit
- $-114,263
- Equity at exit
- $74,537
- IRR
- -24.2%
- Equity multiple
- -0.12×
- Total profit
- $-157,203
- Equity at exit
- $43,222
Cash invested: $139,972 (down + closing). Projections, not guarantees.
Landlord ↔ Tenant lean methodology
- Overall (STATE)
- 21 Tenant-Leaning
- State New Jersey
- 21 Tenant-Leaning · D+6
- County
- — inherits STATE
- City
- — inherits STATE
ZIP-level market 08753
- Rents YoY
- 1.5%
- Active inventory
- 424
- Price-to-rent
- 11.3×
Monthly cashflow live
- Estimated rent
- $3,684 medium interval (Pro) →
- Mortgage (P&I)
- −$2,622
- Tax from tax record
- −$516 /mo · $6,188/yr
- Insurance
- −$208
- HOA
- −$0
- Vacancy / Maint / Mgmt
- −$774
- Net cashflow
- $-435
Break-even live
UW: 25.0% down · 7.5% · 30yr · 1.5% tax · 5.0% vac · 8.0% maint · 8.0% mgmt
Financing live
Cash to close
- Down payment
- $124,975
- Closing costs
- $14,997
- Reserves months
- —
- Total cash needed
- —
Loan-product check · same deal, 3 products live
Conventional
25% down · 7.5% · 30yr
- Down + closing
- —
- Monthly P&I
- —
- Monthly cashflow
- —
- DSCR
- —
- Eligible?
- —
Personal DTI + credit; lowest rate.
DSCR
20% down · 8.5% · 30yr
- Down + closing
- —
- Monthly P&I
- —
- Monthly cashflow
- —
- DSCR
- —
- Eligible?
- —
No personal income docs; deal must DSCR.
Hard money
10% down · 12.0% · 12mo
- Down + closing
- —
- Monthly P&I
- —
- Monthly cashflow
- —
- DSCR
- —
- Eligible?
- —
Short-term bridge; refi at stabilization.
Rent comps 1 comps
| Address | Beds | Baths | Sqft | Rent | $/sqft | DOM | Units | Dist |
|---|---|---|---|---|---|---|---|---|
| 18 Brookfield Dr Brick, NJ | 4.0 | 2.0 | 1634 | $3,300 | $2.02 | 19d | 1 | 0.64mi |
Listing history 20 events
-
2026-06-18days on market $499,900 Active 72 DOM
-
2026-06-17days on market $499,900 Active 71 DOM
-
2026-06-16days on market $499,900 Active 70 DOM
-
2026-06-15days on market $499,900 Active 69 DOM
-
2026-06-13days on market $499,900 Active 67 DOM
-
2026-06-13days on market $499,900 Active 66 DOM
-
2026-06-09days on market $499,900 Active 63 DOM
-
2026-06-08days on market $499,900 Active 62 DOM
-
2026-06-07statusdays on market $499,900 Active 61 DOM
-
2026-05-19historical $3,200
Show marketing remark (314 chars)
5BR 2BA home nestled in the heart of desirable Silverton. Hardwood floors throughout the main floor, plush carpeting on the lower level. Large kitchen with ample cabinet space and fully fenced in yard on a corner lot. Full bath on each floor for convenience. Come be a part of Silverton's thriving community today!
-
2026-05-19status Pending 314-char remark
Show marketing remark (314 chars)
5BR 2BA home nestled in the heart of desirable Silverton. Hardwood floors throughout the main floor, plush carpeting on the lower level. Large kitchen with ample cabinet space and fully fenced in yard on a corner lot. Full bath on each floor for convenience. Come be a part of Silverton's thriving community today!
-
2026-04-21price $499,900 314-char remark
Show marketing remark (314 chars)
5BR 2BA home nestled in the heart of desirable Silverton. Hardwood floors throughout the main floor, plush carpeting on the lower level. Large kitchen with ample cabinet space and fully fenced in yard on a corner lot. Full bath on each floor for convenience. Come be a part of Silverton's thriving community today!
-
2026-03-20$525,000 Active 314-char remark
Show marketing remark (314 chars)
5BR 2BA home nestled in the heart of desirable Silverton. Hardwood floors throughout the main floor, plush carpeting on the lower level. Large kitchen with ample cabinet space and fully fenced in yard on a corner lot. Full bath on each floor for convenience. Come be a part of Silverton's thriving community today!
-
2026-03-10$3,200
-
2024-12-04historical $3,400
-
2024-11-22$3,400
-
2012-10-07soldstatus $150,000 18-char remark
Show marketing remark (18 chars)
* script to follow
-
2012-10-01soldstatus $150,000
-
2012-08-09$159,900 18-char remark
Show marketing remark (18 chars)
* script to follow
-
1979-07-01soldstatus $51,500
ⓘ Source: listings_history table (triggers on properties + properties_extension) + one-shot
backfill from property_details.listing_events for pre-trigger history.
Tax reassessment forecast NJ · Partial reset (capped growth)
- Current annual tax
- $6,188 · $516/mo
- Projected year-2 tax
- $9,318 · $776/mo
- Expected delta
- +$3,130/yr (+$261/mo · 50.6%)
ⓘ Screening estimate from a state-policy table — verify with the county assessor before closing.
Climate risk First Street
- Flood 1/10 Low FEMA zone X (unshaded) · 0% chance over 30 yrs
- Wildfire 2/10 Low
- Heat 8/10 Severe 7 d/yr ≥96°F today · 15 d/yr by 30 yrs out
- Wind 8/10 Severe 80% chance of damaging wind over 30 yrs
- Air quality 3/10 Moderate 3 unhealthy d/yr today · 4 by 30 yrs out
Nearby sold comps map
Loading sold comps map…
Walkable amenities ~0.75 mi
Loading nearby amenities…
Taxation est. · year 1
- Rental income
- $44,203
- − Mortgage interest
- −$28,002
- − Property taxes
- −$6,188
- − Insurance
- −$2,500
- − Repairs & maintenance
- −$3,536
- − Management
- −$3,536
- − Depreciation
- −$14,543
- Taxable loss
- −$14,101
- Est. tax savings @ 24.0%
- +$3,384
- After-tax cash flow
- $-1,841/yr
For passive investors: Depreciation is non-cash, so a rental often shows a tax loss while cash-flowing — sheltering income. Rental losses are passive: they offset passive income freely, and up to $25,000/yr can offset ordinary (W-2) income if you actively participate and your MAGI is under $100k (phasing out to $0 by $150k); unused losses carry forward. On sale, claimed depreciation is recaptured at up to 25%, and gains may owe capital-gains tax (a 1031 exchange can defer both). Figures are a year-1 estimate at your 24.0% rate — not tax advice; consult a CPA.
Schools (NCES district)
- District
- Toms River Regional School District
- NCES district ID
- 3416230
- Math proficiency
- 18% ▼ -19.00%
- Reading proficiency
- 44% ▼ -10.00%
- Median HH income
- $72,370
- Composite
- 29.07/100
- National rank
- #6602
- State rank
- #316 of 472 in NJ
Livability — Toms River
- Score
- 81/100
- State rank
- #61
- US rank
- #1538
Category grades
Schools grade is shown separately in the Schools card above.
Census & demographics
- Census place
- Toms River, NJ
- County
- Ocean County · 439,426 people
- City population
- 131,205
- Metro
- New York-Newark-Jersey City, NY-NJ-PA
- Population (ZIP)
- 65,448
- Household income
- $105,224
- Rent vs Own
- Severe rent burden
- 828.0
Population outlook (Ocean County) Hauer SSP2
- Today (2025)
- 586,991 people
- By 2030
- 581,403 · -1.0%
- By 2040
- 564,913 · -3.8%
- By 2050
- 538,149 · -8.3%
- By 2075
- 468,845 · -20.1%
- By 2100
- 350,297 · -40.3%
Race, ethnicity, and origin ACS 2023
- Neighborhood character
- Predominantly White (77%)
- Race & ethnicity
- White 77% Hispanic / Latino 12% Two or more races 7% Asian 4% Black 3%
- Hispanic origin (detail)
- Mexican 3% Puerto Rican 4%
- Common ancestry
- Romanian 9% Lithuanian 1% Slovak 1%
- Foreign-born
- 10% · Canada, Guatemala, Jamaica
- Languages at home
- 87% English-only · Spanish 7% Other Indo-European 3% Tagalog/Filipino 1%
Political lean MEDSL · Ocean
- 2024 margin
- Solid R (+36.0) · D 31.4% · R 67.4% · Other 1.2%
- 2008→2024 swing
- -17.6pp toward R · 2008: -18.4pp · 2024: -36.0pp
- All cycles
- 2024: R+36.0 2020: R+28.7 2016: R+34.0 2012: R+17.7 2008: R+18.4
Not yet ingested
- Civics
- —
Market trends
- HPI YoY
- ▼ -527.36%
- Current HPI
- 374.5075
- Rent YoY
- ▲ 1.49%
- Metro
- New York-Newark-Jersey City, NY-NJ-PA
- State GDP YoY
- ▲ 2.05%
- F500 in state
- 34
Industry mix (Fortune 500 HQ in NJ)
| Industry | F500 HQs | Revenue |
|---|---|---|
| Consumer Goods | 3 | $31B |
|
||
| Pharmaceuticals | 2 | $153B |
|
||
| Technology | 2 | $21B |
|
||
| Insurance | 2 | $20B |
|
||
| Healthcare | 2 | $19B |
|
||
| Financial Services | 1 | $70B |
|
||
Price history
-93.8% since first listed11 events — show timeline
- 2026-05-19 Rental Removed $3,200 MOMLS
- 2026-05-19 Pending — MOMLS
- 2026-04-21 Price Changed $499,900 MOMLS
- 2026-03-20 Listed $525,000 MOMLS
- 2026-03-10 Listed for Rent $3,200 MOMLS
- 2024-12-04 Rental Removed $3,400 MOMLS
- 2024-11-22 Listed for Rent $3,400 MOMLS
- 2012-10-07 Sold (MLS) $150,000 MOMLS
- 2012-10-01 Sold (Public Records) $150,000 Public Records
- 2012-08-09 Listed $159,900 MOMLS
- 1979-07-01 Sold (Public Records) $51,500 Public Records
Property tax history
+3.6%/yrLatest (2025): $6,188 · +7.3% YoY. Source: county tax records.
Cash-flow waterfall
monthlySold comps — $/sqft
last 12 mo · ≤1 miLoading sold comps…