 Multi-family
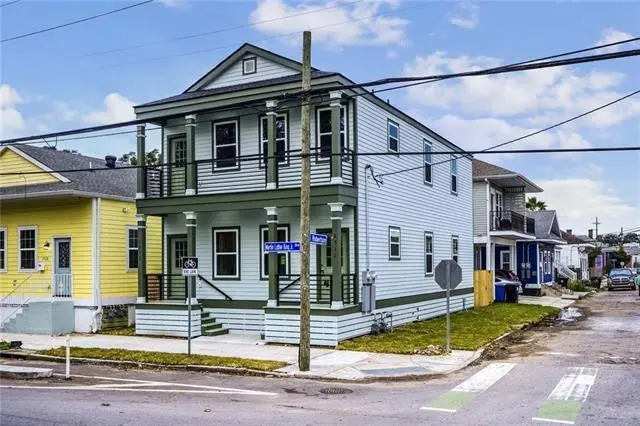
2530-32 Martin Luther King Jr Blvd · New Orleans, LA
Flood risk 8/10 · Major
- FEMA flood zone
- X
- Chance of flooding over 30 yrs
- 0.76%
- Est. flood insurance / yr
- $507 – $1,088
Fire risk 1/10 · Minimal
- Est. fire insurance / yr
- $1,269 – $2,357
Heat risk 10/10 · Severe
- Hot days now (above 108°F)
- 7 days/yr
- Hot days in 30 yrs
- 21 days/yr
Wind risk 10/10 · Severe
- Chance of severe wind over 30 yrs
- 99.0%
Air-quality risk 3/10 · Minor
- Unhealthy air days now
- 3 days/yr
- Unhealthy air days in 30 yrs
- 4 days/yr
Risk factors via First Street. Map © Google.
Why this score? — see what drove the C+ grade
The composite is a weighted blend of 9 inputs, each scored 0–100. Each bar is that input's sub-score; the figure is the points it added to the 100-point composite (weight × sub-score).
- Cash flow +19.3/30.0
- Appreciation +10.0/10.0
- ARV discount +7.5/15.0
- DSCR +6.1/10.0
- 1% rule +5.1/10.0
- Rent growth +4.0/5.0
- Livability +4.0/5.0
- Condition / age +4.0/5.0
- Schools +1.6/10.0
$350,000
🖨 Deal sheet 📄 Offer letter ✓ Due diligence
Multi-family units
County records classify this as Multi-Family (5+ Unit). Listing-text estimate: 1 unit. estimate disagrees with records
5+ unit building — per-unit beds/baths from public records are typically unavailable; the breakdown below (if shown) is an estimate from the listing text.
Listing remarks MLS
Build in 2025 this muti family income producing property is available for sale. featuring 3 bedrooms 2 bath for each unit. totaling 6 bedrooms 4 bath rooms total. Stainless steel appliances gross rents totaling $3734 per month.
Key facts
- 1,716 sq ft lot
- Listed 97 days
Neighborhood map
What this means for you Summary
Snapshot
- This is a multifamily listed at $350k. Condition is rated good.
Deal economics
- At list price, monthly cash flow is $315 ($4k/yr) — positive.
- The deal already cash-flows at list — no discount required.
- Meets the 1% rule at list price ($4k rent vs $350k).
- Recommended offer: $318k (9.0% below list) — sets the bar for market timing.
- Cap rate 7.6% vs local median 4.4% in New Orleans — top-decile yield for the area; either an underpriced asset or a hidden risk that comps aren't pricing in. Stress-test before assuming the spread holds.
Location & tenants
- Location reads 81/100 on livability (#3 in LA, #1,383 nationally) — a professional / high-income tenant draw. Strengths: amenities A+, commute A+, health & safety A+; Watch: crime C-, employment D.
- Orleans Parish (urban): math 11% / reading 27% proficiency, ranked #69 of 98 in LA (top 70%) — low school quality limits family demand, transient renter base, plan for 1-2y turnover; 68% free/reduced lunch — lower-income household profile, screen leases tightly.
- Market conditions: Rents rising fast (+6.0%/yr); 137 active listings in the ZIP; 40 comparable units currently listed for rent nearby; rentals at typical pace (median 24d on market — plan ~3-4 weeks tenant-placement turnaround); lower-income renter base — watch delinquency; 710 units permitted in Orleans Parish in 2024 (244 in 5+ unit buildings).
- At $3,545/mo this rent would consume 108% of the median local household income ($39k/yr) (locally 714% of renters already pay >50% of income on rent) — very limited rent-growth headroom before tenants either downsize or default.
Forward outlook
- In year one you build about $37k of equity ($2k loan paydown + $35k appreciation (10.0% local appreciation)).
- Orleans County population projected at +61% by 2050 — long-run rental-demand tailwind backs the buy-and-hold thesis.
- At projected returns (10.0% appreciation + 6.0% rent growth), your $98k cash investment doubles in ~3 years — after that, you're playing with house money.
- By year 2, paydown + projected appreciation supports a ~$60k cash-out refi (75% LTV) — recoverable capital for the next deal without selling this one.
Negotiation context
- It's been on market 97 days — a 9% lower offer ($318k) is reasonable based on typical stale-listing flexibility.
- 3 sale attempts since 2y ago; this cycle's ask has dropped $35k (9%) from the opening price — seller is motivated, your offer sets the floor, not the list.
Risks & watch-outs
- Watch-outs: flood insurance adds $66/mo.
- Climate carrying-cost: severe flood risk; severe wind risk, 99% chance of damaging wind over 30y; extreme-heat days projected 7→21/yr by 2055 (HVAC capex compounding) — expect insurance premiums to compound above CPI over the hold.
Questions for the listing agent
- It's been on market 97 days. Have you received any prior offers? Is the seller open to a 9% concession, seller financing, or rate buy-down credit?
- What's the actual annual flood-insurance premium (NFIP or private), and is the property in a SFHA with mandatory coverage?
- Why hasn't it sold? Are there any deal-killer items the seller is aware of (foundation, flood, title, zoning, code violations)?
- Is there a deadline driving the sale (1031 exchange, divorce, estate, relocation)? That informs how much negotiation room exists.
- What's the average days-on-market for RENTAL listings here right now (not sales)? A rising rental-DOM trend means longer vacancies and softer asking-rent achievability than the comps imply.
- What's the recent tenant-quality profile in this submarket — average credit score on applications, eviction rate, late-payment / NSF rate, and stable-employment percentage? A property-management company in the area should have these aggregated.
- How much new apartment / multifamily construction is in the pipeline within 1–3 miles? Heavy new supply (>2% of stock underway) typically softens rents 12–24 months out; light construction supports rent growth.
Investment metrics
- 1% rule
- 1.01% ✓
- Cap rate
- 7.60%
- Cash-on-cash
- 4.67%
- DSCR
- 1.21
- GRM
- 8.2
CMA / ARV
- ARV (median comp)
- $215,810
- List price
- $350,000
- Delta
- 62.18%
- Verdict
- OVERPRICED
- Comps
- 20 within 1.0 mi
Show comp detail 12 sales within ~0.75 mi
| Address | Dist | Beds/Ba | Sqft | Sold | Price | $/sf | Match |
|---|---|---|---|---|---|---|---|
| 2124 26 Rev John Raphel Jr Way | 0.11mi | 4/4.0 | 2,369 (+8%) | 5mo | $199,900 | $84 | 78 |
| 2122 24 Rev John Raphel Jr Way | 0.25mi | 4/4.0 | 2,369 (+8%) | 5mo | $199,900 | $84 | 72 |
| 2217 Willow St | 0.28mi | 4/3.0 | 2,082 (-5%) | 8mo | $189,000 | $91 | 71 |
| 2013 15 St Andrew St | 0.36mi | 6/2.0 | 2,084 (-5%) | 6mo | $252,000 | $121 | 70 |
| 2419 S Saratoga St | 0.51mi | 6/3.0 | 2,280 (+4%) | 0mo | $400,000 | $175 | 70 |
| 2121 St Andrew St | 0.32mi | 6/4.0 | 2,430 (+10%) | 3mo | $414,000 | $170 | 65 |
| 2233-2235 Josephine St | 0.25mi | 4/2.0 | 1,938 (-12%) | 8mo | $159,000 | $82 | 61 |
| 1917 19 Josephine St | 0.45mi | 6/6.0 | 2,369 (+8%) | 7mo | $375,000 | $158 | 60 |
| 2113-15 Fourth St | 0.59mi | —/— | 2,379 (+8%) | 0mo | $315,000 | $132 | 59 |
| 2113 15 Fourth St | 0.59mi | 5/3.0 | 2,379 (+8%) | 0mo | $315,000 | $132 | 59 |
| 2023 A B First St | 0.56mi | 6/4.5 | 2,445 (+11%) | 1mo | $485,000 | $198 | 55 |
| 2712 14 S Johnson St | 0.68mi | 4/4.0 | 1,870 (-15%) | 6mo | $246,200 | $132 | 38 |
Match score weights: distance 35% · size 25% · config 20% · recency 20%. Top-matched comps best support the ARV.
Projected returns pro-forma
10.0% appreciation · 5.98% rent growth · sell at horizon
- IRR
- 28.2%
- Equity multiple
- 3.26×
- Total profit
- $221,742
- Equity at exit
- $315,308
- IRR
- 25.5%
- Equity multiple
- 7.76×
- Total profit
- $662,439
- Equity at exit
- $679,973
Cash invested: $98,000 (down + closing). Projections, not guarantees.
Landlord ↔ Tenant lean methodology
- Overall (STATE)
- 90 Strongly Landlord-Friendly
- State Louisiana
- 90 Strongly Landlord-Friendly · R+12
- County
- — inherits STATE
- City
- — inherits STATE
ZIP-level market 70113
- Rents YoY
- 6.0%
- Active inventory
- 137
- Price-to-rent
- 16.5×
Monthly cashflow live
- Estimated rent
- $3,545 high interval (Pro) →
- Mortgage (P&I)
- −$1,835
- Tax est. 1.5%
- −$438 /mo · $5,250/yr
- Insurance
- −$146
- Flood insurance flood zone
- −$66 /mo · $798/yr
- HOA
- −$0
- Vacancy / Maint / Mgmt
- −$744
- Net cashflow
- $315
Break-even live
2-unit breakdown (identical units grouped — click to expand)
| Units | Beds | Baths | Est. rent |
|---|---|---|---|
| 2× units | 3 | 2 | $3,546 |
| #1 | 3 | 2 | $1,773 |
| #2 | 3 | 2 | $1,773 |
| Total (2 units) | $3,545 | ||
UW: 25.0% down · 7.5% · 30yr · 1.5% tax · 5.0% vac · 8.0% maint · 8.0% mgmt
Financing live
Cash to close
- Down payment
- $87,500
- Closing costs
- $10,500
- Reserves months
- —
- Total cash needed
- —
Loan-product check · same deal, 3 products live
Conventional
25% down · 7.5% · 30yr
- Down + closing
- —
- Monthly P&I
- —
- Monthly cashflow
- —
- DSCR
- —
- Eligible?
- —
Personal DTI + credit; lowest rate.
DSCR
20% down · 8.5% · 30yr
- Down + closing
- —
- Monthly P&I
- —
- Monthly cashflow
- —
- DSCR
- —
- Eligible?
- —
No personal income docs; deal must DSCR.
Hard money
10% down · 12.0% · 12mo
- Down + closing
- —
- Monthly P&I
- —
- Monthly cashflow
- —
- DSCR
- —
- Eligible?
- —
Short-term bridge; refi at stabilization.
Rent comps 40 comps
| Address | Beds | Baths | Sqft | Rent | $/sqft | DOM | Units | Dist |
|---|---|---|---|---|---|---|---|---|
| 1407 Magnolia St New Orleans, LA | 3.0 | 2.0 | 1824 | $1,500 | $0.82 | 23d | 1 | 0.12mi |
| 2318 Martin Luther King Junior Blvd New Orleans, LA | 3.0 | 2.0 | 1400 | $1,700 | $1.21 | 23d | 1 | 0.12mi |
| 2702 Felicity St Unit 4 New Orleans, LA | 1.0 | 1.0 | 1734 | $825 | $0.48 | 3d | 1 | 0.15mi |
| 2123 S Liberty St Unit 2125 New Orleans, LA | 3.0 | 2.0 | 1500 | $2,100 | $1.40 | 3d | 1 | 0.25mi |
| 2231 S Liberty St New Orleans, LA | 3.0 | 3.5 | 1752 | $2,000 | $1.14 | 17d | 1 | 0.31mi |
| 1944 Jackson Ave New Orleans, LA | 3.0 | 2.5 | 1572 | $2,500 | $1.59 | 44d | 1 | 0.44mi |
| 2403 S Saratoga St New Orleans, LA | 3.0 | 2.5 | 1600 | $2,500 | $1.56 | 23d | 1 | 0.49mi |
| 1201 Baronne St #1 New Orleans, LA | 3.0 | 2.5 | 1892 | $2,700 | $1.43 | 17d | 1 | 0.52mi |
| 1201 Baronne St #2 New Orleans, LA | 2.0 | 2.5 | 1998 | $1,850 | $0.93 | 17d | 1 | 0.52mi |
| 2301 Dryades St New Orleans, LA | 3.0 | 3.0 | 2070 | $3,000 | $1.45 | 3d | 1 | 0.56mi |
| 875 O'Keefe Ave #301 New Orleans, LA | 3.0 | 2.5 | 2029 | $4,500 | $2.22 | 17d | 1 | 0.57mi |
| 1001 Julia St Unit 10B New Orleans, LA | 2.0 | 2.0 | 1418 | $6,650 | $4.69 | 10d | 1 | 0.60mi |
| 1100 Girod St Unit PHC New Orleans, LA | 2.0 | 2.5 | 1609 | $5,500 | $3.42 | 12d | 1 | 0.63mi |
| 822 Howard Ave Unit 1272354P New Orleans, LA | 1.0–5.0 | 1.0–4.0 | 1749 | $3,985 | $2.28 | 1d | 3 | 0.64mi |
| 1000 Girod St Ph 2 New Orleans, LA | 3.0 | 3.5 | 2008 | $4,800 | $2.39 | 44d | 1 | 0.64mi |
| 2614 S Johnson St New Orleans, LA | 3.0 | 2.0 | 1536 | $2,079 | $1.35 | 14d | 1 | 0.65mi |
| 803 Baronne St New Orleans, LA | 3.0 | 2.0 | 1791 | $3,525 | $1.97 | 3d | 1 | 0.66mi |
| 2617 S Johnson St New Orleans, LA | 2.0 | 1.0 | 1500 | $1,300 | $0.87 | 23d | 1 | 0.67mi |
| 2833 S Derbigny St New Orleans, LA | 3.0 | 2.0 | 1500 | $1,795 | $1.20 | 23d | 1 | 0.68mi |
| 801 Saint Joseph St #1 New Orleans, LA | 2.0 | 2.5 | 2400 | $14,000 | $5.83 | 44d | 1 | 0.68mi |
| 1716 Saint Charles Ave Unit A New Orleans, LA | 1.0 | 1.0 | 1631 | $3,500 | $2.15 | 44d | 1 | 0.69mi |
| 1525 Melpomene St Unit Na New Orleans, LA | 3.0 | 1.5 | 1700 | $4,000 | $2.35 | 44d | 1 | 0.72mi |
| 840 Carondelet St New Orleans, LA | 1.0–2.0 | 1.0–2.0 | 1220 | $4,325 | $3.55 | 1d | 4 | 0.73mi |
| 518 S Rampart St New Orleans, LA | 3.0 | 2.0 | 1853 | $3,995 | $2.16 | 3d | 1 | 0.73mi |
| 2625 Baronne St Unit 1 New Orleans, LA | 3.0 | 1.5 | 2100 | $2,600 | $1.24 | 44d | 1 | 0.73mi |
| 2606 S Miro St New Orleans, LA | 3.0 | 2.0 | 1450 | $2,016 | $1.39 | 23d | 1 | 0.74mi |
| 1908 Washington Ave Unit NA New Orleans, LA | 2.0 | 2.5 | 1498 | $2,100 | $1.40 | 20d | 1 | 0.74mi |
| 1750 Saint Charles Ave #516 New Orleans, LA | 2.0 | 2.0 | 1507 | $2,600 | $1.73 | 16d | 1 | 0.74mi |
| 2100 Saint Charles Ave New Orleans, LA | 1.0–2.0 | 1.5–2.0 | 1077 | $3,500 | $3.25 | 3d | 2 | 0.74mi |
| 2100 Saint Charles Ave Unit 3M New Orleans, LA | 2.0 | 2.0 | 1425 | $3,500 | $2.46 | 44d | 1 | 0.75mi |
| 1635 2nd St New Orleans, LA | 2.0 | 1.0 | 1500 | $2,175 | $1.45 | 16d | 1 | 0.75mi |
| 2713 Baronne St New Orleans, LA | 3.0 | 2.5 | 1600 | $2,300 | $1.44 | 23d | 1 | 0.75mi |
| 825 Lafayette St #4 New Orleans, LA | 2.0 | 2.0 | 1642 | $3,800 | $2.31 | 44d | 1 | 0.81mi |
| 3044 Louisiana Avenue Pkwy New Orleans, LA | 3.0 | 2.0 | 1800 | $1,900 | $1.06 | 23d | 1 | 0.81mi |
| 2010 Prytania St New Orleans, LA | 2.0 | 2.0 | 1600 | $2,350 | $1.47 | 23d | 1 | 0.82mi |
| 3429 Clara St New Orleans, LA | 3.0 | 2.0 | 1620 | $2,350 | $1.45 | 14d | 1 | 0.83mi |
| 3035 Delachaise St New Orleans, LA | 3.0 | 1.0 | 1968 | $1,750 | $0.89 | 2d | 1 | 0.84mi |
| 4027 S Derbigny St New Orleans, LA | 3.0 | 2.0 | 2950 | $1,950 | $0.66 | 23d | 1 | 0.90mi |
| 1330 Saint Mary St New Orleans, LA | 2.0 | 2.0 | 1486 | $2,795 | $1.88 | 23d | 1 | 0.90mi |
| 3212 Danneel St New Orleans, LA | 3.0 | 2.0 | 1945 | $2,000 | $1.03 | 23d | 1 | 0.90mi |
Listing history 22 events
-
2026-06-18days on market $350,000 Active 97 DOM
-
2026-06-17days on market $350,000 Active 96 DOM
-
2026-06-16days on market $350,000 Active 95 DOM
-
2026-06-15days on market $350,000 Active 94 DOM
-
2026-06-13days on market $350,000 Active 92 DOM
-
2026-06-10days on market $350,000 Active 89 DOM
-
2026-06-09days on market $350,000 Active 88 DOM
-
2026-06-08days on market $350,000 Active 87 DOM
-
2026-06-07days on market $350,000 Active 86 DOM
-
2026-06-05pricedays on market $350,000 Active 83 DOM
-
2026-06-03days on market $365,000 Active 82 DOM
-
2026-06-02days on market $365,000 Active 81 DOM
-
2026-06-01days on market $365,000 Active 80 DOM
-
2026-05-31days on market $365,000 Active 79 DOM
-
2026-05-12historical $1,850
-
2026-04-25price $365,000 227-char remark
Show marketing remark (227 chars)
Build in 2025 this muti family income producing property is available for sale. featuring 3 bedrooms 2 bath for each unit. totaling 6 bedrooms 4 bath rooms total. Stainless steel appliances gross rents totaling $3734 per month.
-
2026-04-16price $380,000 227-char remark
Show marketing remark (227 chars)
Build in 2025 this muti family income producing property is available for sale. featuring 3 bedrooms 2 bath for each unit. totaling 6 bedrooms 4 bath rooms total. Stainless steel appliances gross rents totaling $3734 per month.
-
2026-03-31price $1,850
-
2026-03-06$385,000 Active 227-char remark
Show marketing remark (227 chars)
Build in 2025 this muti family income producing property is available for sale. featuring 3 bedrooms 2 bath for each unit. totaling 6 bedrooms 4 bath rooms total. Stainless steel appliances gross rents totaling $3734 per month.
-
2026-02-06$2,100
-
2024-11-29price $429,000
-
2024-11-15$449,000 Active
ⓘ Source: listings_history table (triggers on properties + properties_extension) + one-shot
backfill from property_details.listing_events for pre-trigger history.
Climate risk First Street
- Flood 8/10 Severe FEMA zone X · 76% chance over 30 yrs
- Wildfire 1/10 Low
- Heat 10/10 Extreme 7 d/yr ≥108°F today · 21 d/yr by 30 yrs out
- Wind 10/10 Extreme 99% chance of damaging wind over 30 yrs
- Air quality 3/10 Moderate 3 unhealthy d/yr today · 4 by 30 yrs out
Nearby sold comps map
Loading sold comps map…
Walkable amenities ~0.75 mi
Loading nearby amenities…
Taxation est. · year 1
- Rental income
- $42,540
- − Mortgage interest
- −$19,605
- − Property taxes
- −$5,250
- − Insurance
- −$2,548
- − Repairs & maintenance
- −$3,403
- − Management
- −$3,403
- − Depreciation
- −$10,182
- Taxable loss
- −$1,851
- Est. tax savings @ 24.0%
- +$444
- After-tax cash flow
- $4,228/yr
For passive investors: Depreciation is non-cash, so a rental often shows a tax loss while cash-flowing — sheltering income. Rental losses are passive: they offset passive income freely, and up to $25,000/yr can offset ordinary (W-2) income if you actively participate and your MAGI is under $100k (phasing out to $0 by $150k); unused losses carry forward. On sale, claimed depreciation is recaptured at up to 25%, and gains may owe capital-gains tax (a 1031 exchange can defer both). Figures are a year-1 estimate at your 24.0% rate — not tax advice; consult a CPA.
Condition & rehab AI · 12 photos
This multi-family property is in excellent condition with modern amenities and a well-maintained exterior. It is ready for immediate occupancy and can be further enhanced with smart home features and landscaping improvements.
Value-add opportunities
- Both Landscaping and curb appeal improvements — Enhances the home's curb appeal and can attract more buyers or renters.
- Both Add smart home features — Improves convenience and can increase the home's market value.
- Both Add a smart thermostat — Enhances energy efficiency and can be a selling point for buyers.
- Both Add a smart security system — Enhances safety and can be a selling point for buyers.
- Both Add a smart lighting system — Enhances energy efficiency and can be a selling point for buyers.
Renovation cost estimate screening
Value-add ROI direction
- Both Landscaping and curb appeal improvements — Enhances the home's curb appeal and can attract more buyers or renters. ↑
- Both Add smart home features — Improves convenience and can increase the home's market value. ↑
- Both Add a smart thermostat — Enhances energy efficiency and can be a selling point for buyers. ↑
- Both Add a smart security system — Enhances safety and can be a selling point for buyers. ↑
- Both Add a smart lighting system — Enhances energy efficiency and can be a selling point for buyers. ↑
ⓘ Cost ranges are severity-bucket heuristics (US national rule-of-thumb). Get contractor quotes + a written scope before underwriting a rehab budget.
Schools (NCES district)
- District
- Orleans Parish
- NCES district ID
- 2201170
- Math proficiency
- 11% ▼ -52.00%
- Reading proficiency
- 27% ▼ -46.00%
- Median HH income
- $37,011
- Composite
- 15.78/100
- National rank
- #9271
- State rank
- #69 of 98 in LA
Livability — New Orleans
- Score
- 81/100
- State rank
- #3
- US rank
- #1383
Category grades
Schools grade is shown separately in the Schools card above.
Census & demographics
- Census place
- New Orleans, LA
- County
- Orleans Parish · 338,817 people
- City population
- 338,817
- Metro
- New Orleans-Metairie, LA
- Population (ZIP)
- 9,387
- Household income
- $39,333
- Rent vs Own
- Severe rent burden
- 714.0
Population outlook (Orleans County) Hauer SSP2
- Today (2025)
- 513,025 people
- By 2030
- 575,781 · +12.2%
- By 2040
- 700,174 · +36.5%
- By 2050
- 826,541 · +61.1%
- By 2075
- 1,123,374 · +119.0%
- By 2100
- 1,355,609 · +164.2%
Race, ethnicity, and origin ACS 2023
- Neighborhood character
- Diverse neighborhood (Simpson 0.57)
- Race & ethnicity
- Black 61% White 20% Hispanic / Latino 13% Two or more races 11% Asian 2%
- Hispanic origin (detail)
- Mexican 2%
- Common ancestry
- Lithuanian 2% Portuguese 1% Slovak 1%
- Foreign-born
- 13% · Canada, Vietnam, China
- Languages at home
- 86% English-only · Spanish 11% Other Indo-European 1% Vietnamese 1%
Political lean MEDSL · Orleans
- 2024 margin
- Solid D (+67.0) · D 82.2% · R 15.2% · Other 2.7%
- 2008→2024 swing
- +6.7pp toward D · 2008: 60.3pp · 2024: 67.0pp
- All cycles
- 2024: D+67.0 2020: D+68.2 2016: D+66.2 2012: D+62.5 2008: D+60.3
Not yet ingested
- Civics
- —
Market trends
- HPI YoY
- ▲ 65.92%
- Current HPI
- 229.3968
- Rent YoY
- ▲ 5.98%
- Metro
- New Orleans-Metairie, LA
- State GDP YoY
- ▲ 3.29%
- F500 in state
- 10
Industry mix (Fortune 500 HQ in LA)
| Industry | F500 HQs | Revenue |
|---|---|---|
| Telecommunications | 2 | $23B |
|
||
| Utilities | 1 | $12B |
|
||
| Wholesale / Distribution | 1 | $5B |
|
||
| Advertising | 1 | $2B |
|
||
Price history
-99.6% since first listed8 events — show timeline
- 2026-05-12 Rental Removed $1,850 RAAMLS
- 2026-04-25 Price Changed $365,000 AcadianaMLS
- 2026-04-16 Price Changed $380,000 AcadianaMLS
- 2026-03-31 Price Changed $1,850 RAAMLS
- 2026-03-06 Listed $385,000 AcadianaMLS
- 2026-02-06 Listed for Rent $2,100 RAAMLS
- 2024-11-29 Price Changed $429,000 AcadianaMLS
- 2024-11-15 Listed $449,000 AcadianaMLS
Cash-flow waterfall
monthlySold comps — $/sqft
last 12 mo · ≤1 miLoading sold comps…