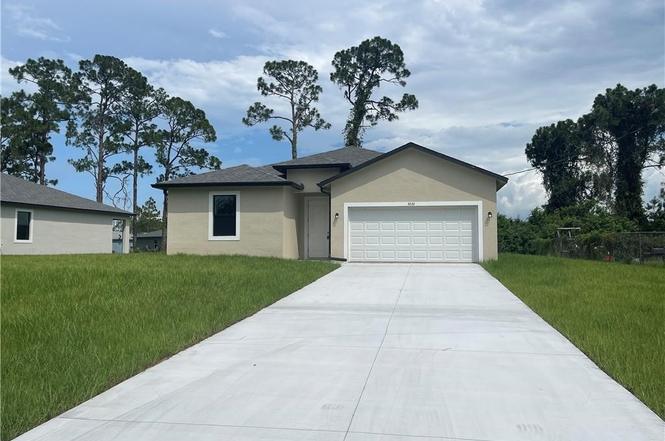
3032 W Briarwood Cir · Port LaBelle, FL
Flood risk 1/10 · Minimal
- FEMA flood zone
- X (unshaded)
- Chance of flooding over 30 yrs
- 0.0%
- Est. flood insurance / yr
- $507 – $1,088
Fire risk 2/10 · Minimal
- Est. fire insurance / yr
- $947 – $1,759
Heat risk 9/10 · Severe
- Hot days now (above 108°F)
- 7 days/yr
- Hot days in 30 yrs
- 26 days/yr
Wind risk 10/10 · Severe
- Chance of severe wind over 30 yrs
- 99.0%
Air-quality risk 2/10 · Minimal
- Unhealthy air days now
- 0 days/yr
- Unhealthy air days in 30 yrs
- 1 days/yr
Risk factors via First Street. Map © Google.
Why this score? — see what drove the D- grade
The composite is a weighted blend of 9 inputs, each scored 0–100. Each bar is that input's sub-score; the figure is the points it added to the 100-point composite (weight × sub-score).
- Appreciation +10.0/10.0
- ARV discount +7.6/15.0
- Cash flow +7.2/30.0
- Schools +3.1/10.0
- Livability +3.1/5.0
- 1% rule +2.5/10.0
- Rent growth +2.5/5.0
- Condition / age +2.5/5.0
- DSCR +1.4/10.0
$299,999
🖨 Deal sheet 📄 Offer letter ✓ Due diligence
Listing remarks
SELLER INCENTIVES TO BUYERS!! Welcome Home! This thoughtfully designed single-family residence in Lehigh Acres offers modern living with a touch of Southern charm. Boasting 3 spacious bedrooms, 2 bathrooms, and 1,530 square feet of building area, this home is perfect for families and entertaining. Enjoy the open-concept floor plan featuring a gourmet kitchen with quartz countertops, sleek stainless steel appliances, and kitchen peninsula. The master suite includes a walk-in closet and an en-suite bathroom with dual vanities and a luxurious walk-in shower. Additional highlights include energy-efficient windows, a spacious one-car garage, and a private backyard ready for your personal touch a
Key facts
- Quartz countertops
- Dual vanities
- Walk-in closet
Tags
Property features AI
Finance
- Financial info: Pets allowed
- HOA & community: No association fee
Exterior
- Parking: Attached 2-car garage; Covered and paved driveway; Assigned parking
- Security: Smoke detectors; Security/high-impact doors
- Utilities: Public water; Septic tank sewer; Cable not available
- Home design: Single-story home; Entry level 1; New construction; Faces northwest
- Construction: Built with block, concrete and stucco; Shingle roof; New construction
- Exterior features: Security/high-impact doors; Smoke detectors; Rectangular lot; Publicly maintained road; Lot dimensions approximately 93 x 125 x 78 x 125; Lot faces southeast
Interior
- Kitchen: Pantry; Dishwasher; Microwave; Range; Refrigerator; Freezer; Icemaker
- Bedrooms: Bedrooms on main level (2 bedrooms listed)
- Flooring: Vinyl flooring
- Bathrooms: 2 full bathrooms
- Heating & cooling: Heat pump heating; Central electric air conditioning
- Interior features: Impact glass windows; Cathedral and vaulted ceilings; Open family/dining area; Living/dining room combination; Pantry; Main-level primary bedroom; Split bedroom layout; Walk-in closets; Separate shower (shower only)
- Laundry & utility: Washer; Dryer
Neighborhood map
What this means for you Summary
Snapshot
- This is a 3-bed/2.0-bath single-family listed at $300k.
Deal economics
- At list price, monthly cash flow is $-412 ($-5k/yr) — negative.
- To cash-flow at today's rent, offer at most $227k (24.2% below list).
- To meet the 1% rule (rent ≥ 1% of price), the offer needs to be $225k (25.0% below list).
- Recommended offer: $225k (25.0% below list) — sets the bar for 1% rule.
Location & tenants
- Location reads 62/100 on livability (#750 in FL) — a middle-class / working-renter tenant base. Strengths: cost of living A+, housing A+; Watch: schools F, amenities F, commute F.
- Hendry (town): math 35% / reading 40% proficiency, ranked #65 of 73 in FL (top 89%) — families likely to look elsewhere, expect single-tenant / working-renter base with shorter leases; 75% free/reduced lunch — lower-income household profile, screen leases tightly.
- Market conditions: 942 active listings in the ZIP; 5 comparable units currently listed for rent nearby; rentals at typical pace (median 24d on market — plan ~3-4 weeks tenant-placement turnaround); 557 units permitted in Hendry County in 2024 (45 in 5+ unit buildings).
- At $2,249/mo this rent would consume 47% of the median local household income ($57k/yr) (locally 498% of renters already pay >50% of income on rent) — very limited rent-growth headroom before tenants either downsize or default.
Forward outlook
- In year one you build about $32k of equity ($2k loan paydown + $30k appreciation (10.0% local appreciation)).
- Hendry County population projected to shrink 7% by 2050 — rents likely to lag national; underwrite the cash flow, not the appreciation.
- By year 2, paydown + projected appreciation supports a ~$52k cash-out refi (75% LTV) — recoverable capital for the next deal without selling this one.
Negotiation context
- It's been on market 122 days — a 12% lower offer ($264k) is reasonable based on typical stale-listing flexibility.
- 7 sale attempts since 3y ago with the ask held roughly flat each time — persistent listings suggest the price (not the market) is what's stuck; bring a comps-based counter.
- Current owner paid $20k; list at $300k implies a 1389% gain — meaningful room to come down on a strong offer.
Risks & watch-outs
- Climate carrying-cost: severe wind risk, 99% chance of damaging wind over 30y; extreme-heat days projected 7→26/yr by 2055 (HVAC capex compounding) — expect insurance premiums to compound above CPI over the hold.
Questions for the listing agent
- What do current leases actually rent for vs. the listed asking? Can we see a recent rent roll and the last 12 months of T-12 income?
- It's been on market 122 days. Have you received any prior offers? Is the seller open to a 25% concession, seller financing, or rate buy-down credit?
- Why hasn't it sold? Are there any deal-killer items the seller is aware of (foundation, flood, title, zoning, code violations)?
- Is there a deadline driving the sale (1031 exchange, divorce, estate, relocation)? That informs how much negotiation room exists.
- Schools are F-rated, which usually means shorter tenancies and higher turnover. Who's the typical renter profile here, and what's been the actual vacancy rate?
- The area grade is low — what's the realistic commute time and amenity access for the typical tenant pool here? Any planned neighborhood developments (good or bad) we should know about?
- What's the average days-on-market for RENTAL listings here right now (not sales)? A rising rental-DOM trend means longer vacancies and softer asking-rent achievability than the comps imply.
- What's the recent tenant-quality profile in this submarket — average credit score on applications, eviction rate, late-payment / NSF rate, and stable-employment percentage? A property-management company in the area should have these aggregated.
- How much new for-sale + rental construction is in the pipeline within 1–3 miles? Heavy new supply typically softens prices + rents 12–24 months out; constrained supply supports both.
Investment metrics
- 1% rule
- 0.75% ✗
- Cap rate
- 4.65%
- Cash-on-cash
- -5.88%
- DSCR
- 0.74
- GRM
- 11.1
CMA / ARV
- ARV (on-the-fly)
- $300,580
- Comps found
- 12
Show comp detail 12 sales within ~0.75 mi
| Address | Dist | Beds/Ba | Sqft | Sold | Price | $/sf | Match |
|---|---|---|---|---|---|---|---|
| 3019 Lancer Rd | 0.24mi | 4/2.0 (+1) | 1,530 (-3%) | 7mo | $299,000 | $195 | 73 |
| 3014 Cherry Ln | 0.23mi | 4/2.0 (+1) | 1,499 (-5%) | 7mo | $299,999 | $200 | 70 |
| 3023 Cherry Ln | 0.29mi | 4/2.0 (+1) | 1,499 (-5%) | 5mo | $269,999 | $180 | 69 |
| 3019 N Tulip Rd | 0.33mi | 4/2.0 (+1) | 1,499 (-5%) | 3mo | $285,000 | $190 | 68 |
| 3003 NW Beechwood Cir | 0.67mi | 3/2.0 | 1,585 (+0%) | 1mo | $505,000 | $319 | 67 |
| 3012 Lady Ln | 0.47mi | 3/2.0 | 1,498 (-5%) | 6mo | $340,000 | $227 | 64 |
| 3121 Memphis Ln | 0.59mi | 4/2.0 (+1) | 1,593 (+1%) | 4mo | $289,900 | $182 | 63 |
| 3013 Honeywood Rd | 0.32mi | 3/2.0 | 1,409 (-11%) | 4mo | $254,000 | $180 | 63 |
| 3060 NE Beechwood Cir | 0.70mi | 3/2.0 | 1,592 (+1%) | 4mo | $245,000 | $154 | 63 |
| 3036 Harvard Cir | 0.55mi | 3/2.5 | 1,464 (-8%) | 1mo | $225,000 | $154 | 59 |
| 2040 S Montana Cir | 0.54mi | 3/2.0 | 1,392 (-12%) | 0mo | $230,000 | $165 | 54 |
| 3043 S Beechwood Cir | 0.75mi | 3/2.0 | 1,389 (-12%) | 6mo | $279,999 | $202 | 40 |
Match score weights: distance 35% · size 25% · config 20% · recency 20%. Top-matched comps best support the ARV.
Projected returns pro-forma
10.0% appreciation · 3.0% rent growth · sell at horizon
- IRR
- 20.1%
- Equity multiple
- 2.63×
- Total profit
- $137,282
- Equity at exit
- $270,263
- IRR
- 18.4%
- Equity multiple
- 6.06×
- Total profit
- $425,091
- Equity at exit
- $582,832
Cash invested: $84,000 (down + closing). Projections, not guarantees.
Landlord ↔ Tenant lean methodology
- Overall (STATE)
- 87 Strongly Landlord-Friendly
- State Florida
- 87 Strongly Landlord-Friendly · R+3
- County
- — inherits STATE
- City
- — inherits STATE
ZIP-level market 33935
- Home prices YoY
- 16.3%
- Active inventory
- 942
- Price-to-rent
- 11.1×
Monthly cashflow live
- Estimated rent
- $2,249 high interval (Pro) →
- Mortgage (P&I)
- −$1,573
- Tax from tax record
- −$490 /mo · $5,880/yr
- Insurance
- −$125
- HOA
- −$0
- Vacancy / Maint / Mgmt
- −$472
- Net cashflow
- $-412
Break-even live
UW: 25.0% down · 7.5% · 30yr · 1.5% tax · 5.0% vac · 8.0% maint · 8.0% mgmt
Financing live
Cash to close
- Down payment
- $75,000
- Closing costs
- $9,000
- Reserves months
- —
- Total cash needed
- —
Loan-product check · same deal, 3 products live
Conventional
25% down · 7.5% · 30yr
- Down + closing
- —
- Monthly P&I
- —
- Monthly cashflow
- —
- DSCR
- —
- Eligible?
- —
Personal DTI + credit; lowest rate.
DSCR
20% down · 8.5% · 30yr
- Down + closing
- —
- Monthly P&I
- —
- Monthly cashflow
- —
- DSCR
- —
- Eligible?
- —
No personal income docs; deal must DSCR.
Hard money
10% down · 12.0% · 12mo
- Down + closing
- —
- Monthly P&I
- —
- Monthly cashflow
- —
- DSCR
- —
- Eligible?
- —
Short-term bridge; refi at stabilization.
Rent comps 5 comps
| Address | Beds | Baths | Sqft | Rent | $/sqft | DOM | Units | Dist |
|---|---|---|---|---|---|---|---|---|
| 3020 N Lakewood Rd Labelle, FL | 4.0 | 2.0 | 1499 | $1,950 | $1.30 | 23d | 1 | 0.28mi |
| 3051 NW Beechwood Cir Labelle, FL | 4.0 | 2.0 | 1499 | $2,200 | $1.47 | 23d | 1 | 0.78mi |
| 5012 Gunn Pl Labelle, FL | 3.0 | 2.5 | 1783 | $2,500 | $1.40 | 2d | 1 | 1.12mi |
| 5029 W Hummingbird Dr Labelle, FL | 3.0 | 2.0 | 1212 | $2,450 | $2.02 | 3d | 1 | 1.20mi |
| 5029 S Rosebud Cir Labelle, FL | 3.0 | 2.0 | 1389 | $1,780 | $1.28 | 23d | 1 | 1.25mi |
Listing history 29 events
-
2026-06-18days on market $299,999 Active 122 DOM
-
2026-06-17days on market $299,999 Active 121 DOM
-
2026-06-16days on market $299,999 Active 120 DOM
-
2026-06-15days on market $299,999 Active 119 DOM
-
2026-06-13days on market $299,999 Active 117 DOM
-
2026-06-13days on market $299,999 Active 116 DOM
-
2026-06-10days on market $299,999 Active 114 DOM
-
2026-06-09days on market $299,999 Active 113 DOM
-
2026-06-08days on market $299,999 Active 112 DOM
-
2026-06-07days on market $299,999 Active 111 DOM
-
2026-06-03days on market $299,999 Active 107 DOM
-
2026-06-02days on market $299,999 Active 106 DOM
-
2026-06-01days on market $299,999 Active 105 DOM
-
2026-05-31days on market $299,999 Active 104 DOM
-
2026-02-17price $299,999
-
2026-02-09$315,000 Active
-
2026-02-02historical
-
2025-10-15$315,000 Active
-
2024-12-31historical
-
2024-11-02historical $2,350
-
2024-09-06$2,350
-
2024-09-06historical $2,350
-
2024-09-06$2,350
-
2024-08-01$329,900 Active
-
2023-08-18historical
-
2023-08-03$329,900 Active
-
2023-03-29historical
-
2023-01-24$329,900 Active
-
2022-04-18soldstatus $20,143
ⓘ Source: listings_history table (triggers on properties + properties_extension) + one-shot
backfill from property_details.listing_events for pre-trigger history.
Tax reassessment forecast FL · Resets to sale price
- Current annual tax
- $5,880 · $490/mo
- Projected year-2 tax
- $5,880 · $490/mo
- Expected delta
- $0/yr ($0/mo · -0.0%)
ⓘ Screening estimate from a state-policy table — verify with the county assessor before closing.
Climate risk First Street
- Flood 1/10 Low FEMA zone X (unshaded) · 0% chance over 30 yrs
- Wildfire 2/10 Low
- Heat 9/10 Extreme 7 d/yr ≥108°F today · 26 d/yr by 30 yrs out
- Wind 10/10 Extreme 99% chance of damaging wind over 30 yrs
- Air quality 2/10 Low 0 unhealthy d/yr today · 1 by 30 yrs out
Nearby sold comps map
Loading sold comps map…
Walkable amenities ~0.75 mi
Loading nearby amenities…
Taxation est. · year 1
- Rental income
- $26,987
- − Mortgage interest
- −$16,805
- − Property taxes
- −$5,880
- − Insurance
- −$1,500
- − Repairs & maintenance
- −$2,159
- − Management
- −$2,159
- − Depreciation
- −$8,727
- Taxable loss
- −$10,242
- Est. tax savings @ 24.0%
- +$2,458
- After-tax cash flow
- $-2,480/yr
For passive investors: Depreciation is non-cash, so a rental often shows a tax loss while cash-flowing — sheltering income. Rental losses are passive: they offset passive income freely, and up to $25,000/yr can offset ordinary (W-2) income if you actively participate and your MAGI is under $100k (phasing out to $0 by $150k); unused losses carry forward. On sale, claimed depreciation is recaptured at up to 25%, and gains may owe capital-gains tax (a 1031 exchange can defer both). Figures are a year-1 estimate at your 24.0% rate — not tax advice; consult a CPA.
Schools (NCES district)
- District
- Hendry
- NCES district ID
- 1200780
- Math proficiency
- 35% ▼ -11.00%
- Reading proficiency
- 40% ▼ -4.00%
- Median HH income
- $37,043
- Composite
- 31.16/100
- National rank
- #6054
- State rank
- #65 of 73 in FL
Livability — Port LaBelle
- Score
- 62/100
- State rank
- #750
- US rank
- #16264
Category grades
Schools grade is shown separately in the Schools card above.
Census & demographics
- Census place
- Port LaBelle, FL
- County
- Hendry County · 23,186 people
- Metro
- Clewiston, FL
- Population (ZIP)
- 23,186
- Household income
- $57,009
- Rent vs Own
- Severe rent burden
- 498.0
Population outlook (Hendry County) Hauer SSP2
- Today (2025)
- 38,866 people
- By 2030
- 38,558 · -0.8%
- By 2040
- 37,743 · -2.9%
- By 2050
- 36,117 · -7.1%
- By 2075
- 30,070 · -22.6%
- By 2100
- 21,966 · -43.5%
Race, ethnicity, and origin ACS 2023
- Neighborhood character
- Majority Hispanic (56%)
- Race & ethnicity
- Hispanic / Latino 56% White 39% Two or more races 21% Black 2% Native American 2%
- Hispanic origin (detail)
- Mexican 40% Puerto Rican 3% Cuban 5%
- Common ancestry
- Lithuanian 2% Serbian 2% Slovak 1%
- Foreign-born
- 27% · Canada, Jamaica
- Languages at home
- 50% English-only · Spanish 50%
Political lean MEDSL · Hendry
- 2024 margin
- Solid R (+38.3) · D 30.4% · R 68.7%
- 2008→2024 swing
- -31.1pp toward R · 2008: -7.2pp · 2024: -38.3pp
- All cycles
- 2024: R+38.3 2020: R+23.0 2016: R+14.2 2012: R+5.9 2008: R+7.2
Not yet ingested
- Civics
- —
Market trends
- HPI YoY
- ▲ 75.20%
- Current HPI
- 537.4928
- Rent YoY
- —
- Metro
- Clewiston, FL
- State GDP YoY
- ▲ 3.28%
- F500 in state
- 36
Industry mix (Fortune 500 HQ in FL)
| Industry | F500 HQs | Revenue |
|---|---|---|
| Industrial Technology | 2 | $29B |
|
||
| Insurance | 2 | $17B |
|
||
| Retail | 1 | $60B |
|
||
| Technology Distribution | 1 | $58B |
|
||
| Homebuilding | 1 | $35B |
|
||
| Technology Manufacturing | 1 | $35B |
|
||
Price history
+1389.3% since first listed15 events — show timeline
- 2026-02-17 Price Changed $299,999 FORTMLS
- 2026-02-09 Listed $315,000 FORTMLS
- 2026-02-02 Listing Removed — FORTMLS
- 2025-10-15 Listed $315,000 FORTMLS
- 2024-12-31 Listing Removed — FORTMLS
- 2024-11-02 Rental Removed $2,350 FORTMLS
- 2024-09-06 Listed for Rent $2,350 FORTMLS
- 2024-09-06 Rental Removed $2,350 NAPLESMLS
- 2024-09-06 Listed for Rent $2,350 NAPLESMLS
- 2024-08-01 Listed $329,900 FORTMLS
- 2023-08-18 Listing Removed — FORTMLS
- 2023-08-03 Listed $329,900 FORTMLS
- 2023-03-29 Listing Removed — FORTMLS
- 2023-01-24 Listed $329,900 FORTMLS
- 2022-04-18 Sold (Public Records) $20,143 Public Records
Property tax history
+40.3%/yrLatest (2025): $5,880 · +4.7% YoY. Source: county tax records.
Cash-flow waterfall
monthlySold comps — $/sqft
last 12 mo · ≤1 miLoading sold comps…