3942 Golden Crane Pass · Red Bank, SC
Flood risk No data
- FEMA flood zone
- —
- Chance of flooding over 30 yrs
- —
- Est. flood insurance / yr
- —
Fire risk No data
- Est. fire insurance / yr
- —
Heat risk No data
- Hot days now (above threshold)
- —
- Hot days in 30 yrs
- —
Wind risk No data
- Chance of severe wind over 30 yrs
- —
Air-quality risk No data
- Unhealthy air days now
- —
- Unhealthy air days in 30 yrs
- —
Risk factors via First Street. Map © Google.
Why this score? — see what drove the D grade
The composite is a weighted blend of 9 inputs, each scored 0–100. Each bar is that input's sub-score; the figure is the points it added to the 100-point composite (weight × sub-score).
- Cash flow +12.6/30.0
- ARV discount +7.5/15.0
- Schools +4.2/10.0
- Condition / age +4.0/5.0
- 1% rule +3.8/10.0
- DSCR +3.8/10.0
- Rent growth +3.3/5.0
- Livability +3.3/5.0
- Appreciation +0.0/10.0
$272,000
🖨 Deal sheet (PDF) 📄 Offer letter ✓ Due diligence
Listing remarks MLS
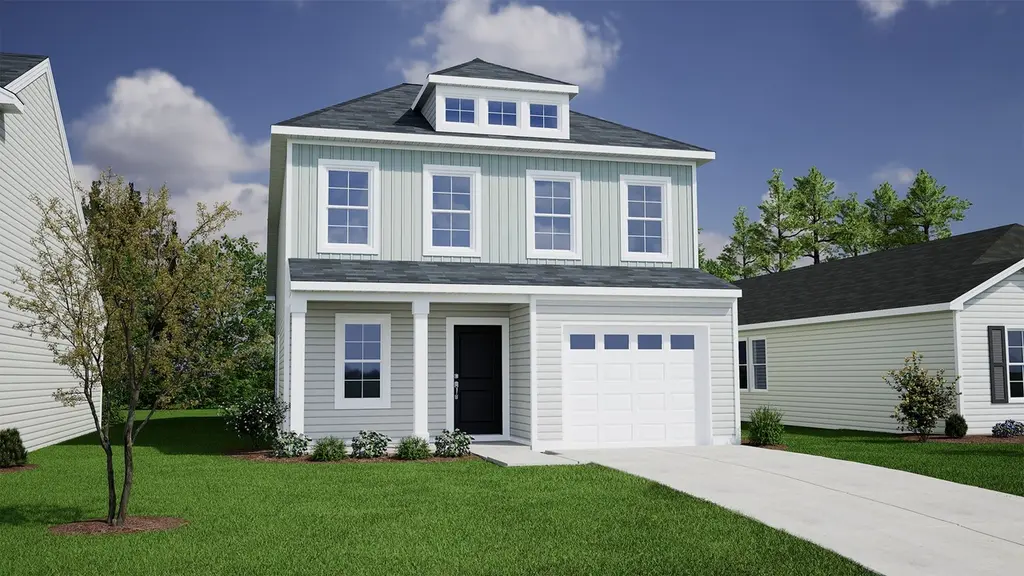
This fourbedroom, twoandahalfbath Evans floorplan features a highly desirable layout with the primary bedroom located on the main floor. The home showcases an openconcept design with vaulted ceilings in the living area. The kitchen area includes beautiful gray cabinetry, white quartz countertops, a gas range and bartop seating perfect for entertaining. This home also includes a covered porch and storage shed for additional space. Upstairs, additional spacious bedrooms and a bonus room provides plenty of room for family, guests, or flex space. This home creates a warm and functional environment making it the perfection place to call home!
Key facts
- Open-concept design
- Gray cabinetry
- Vaulted ceilings
Tags
Property features AI
Finance
- Other: Community pool; Cable TV available; New construction builder warranty
- HOA & community: Homeowners association present; Association maintains common areas, street lights, playground, and pool
Exterior
- Parking: Attached garage with 1 garage space
- Utilities: Public water; Public sewer
- Home design: Two-story house; Entry facing unspecified direction
- Construction: Slab foundation
- Exterior features: Front covered porch; Back covered porch; Sprinkler system; Stone and vinyl exterior finish; Paved road access
Interior
- Kitchen: Eat-in kitchen with island; Granite countertops; Recessed lighting
- Bedrooms: Main-level primary suite with double vanity, separate shower, and walk-in closet; Second-level bedrooms with private closets (Bedrooms 2–4)
- Flooring: Luxury vinyl plank in great room and kitchen
- Bathrooms: Two full bathrooms; One partial bathroom; One main-level full bath; One main-level half bath
- Heating & cooling: Central cooling with split system and zoned controls; Gas heating on first and second levels with split system and zoning
- Interior features: Smoke detector; Pull-down attic access; Vaulted ceilings in master bedroom
- Laundry & utility: Washer/dryer located on main level; Tankless hot water system
Neighborhood map
What this means for you Summary
Snapshot
- This is a 4-bed/2.5-bath single-family listed at $272k. Condition is rated good.
Deal economics
- At list price, monthly cash flow is $-32 ($-389/yr) — negative.
- To cash-flow at today's rent, offer at most $267k (1.7% below list).
- To meet the 1% rule (rent ≥ 1% of price), the offer needs to be $239k (12.1% below list).
- Recommended offer: $239k (12.1% below list) — sets the bar for 1% rule.
Location & tenants
- Location reads 66/100 on livability (#121 in SC) — a middle-class / working-renter tenant base. Strengths: cost of living A+, housing A+, health & safety B; Watch: employment C-, crime D+, amenities F.
- Lexington 01 (suburban): math 42% / reading 53% proficiency, ranked #11 of 80 in SC (top 14%) — families likely to look elsewhere, expect single-tenant / working-renter base with shorter leases.
- Zoned schools: Deerfield Elementary (math 42% / reading 52%, grade D-, #209 of 597 statewide, top 36%, 803 students, 32% FRL); Carolina Springs Middle (math 25% / reading 39%, grade F, #119 of 229 statewide, top 54%, 914 students, 46% FRL); White Knoll High (math 47% / reading 85%, grade B, #81 of 196 statewide, top 42%, 2,204 students, 45% FRL).
- Market conditions: Rents rising (+3.2%/yr); 572 active listings in the ZIP; 2 comparable units currently listed for rent nearby; solid renter incomes; 1,712 units permitted in Lexington County in 2024 (0 in 5+ unit buildings).
- This rent runs 37% of the median local income ($77k/yr) — at the standard rent-burdened threshold; future hikes will face affordability resistance.
Forward outlook
- Local home prices are declining (-3.0%/yr); year-one equity from $2k of loan paydown is wiped out by about $8k of value loss. Plan a longer hold.
- Lexington County population projected at +26% by 2050 — long-run rental-demand tailwind backs the buy-and-hold thesis.
Negotiation context
- It's been on market 41 days — a 3% lower offer ($264k) is reasonable based on typical stale-listing flexibility.
- 2 sale attempts with the ask held roughly flat each time — persistent listings suggest the price (not the market) is what's stuck; bring a comps-based counter.
Questions for the listing agent
- What do current leases actually rent for vs. the listed asking? Can we see a recent rent roll and the last 12 months of T-12 income?
- It's been on market 41 days. Have you received any prior offers? Is the seller open to a 12% concession, seller financing, or rate buy-down credit?
- What does the HOA fee cover, when was the last increase, and are there any pending special assessments or reserve-fund shortfalls?
- Is there a deadline driving the sale (1031 exchange, divorce, estate, relocation)? That informs how much negotiation room exists.
- Schools are F-rated, which usually means shorter tenancies and higher turnover. Who's the typical renter profile here, and what's been the actual vacancy rate?
- Crime grade is D in this area — have there been break-ins, vandalism, or insurance claims at this property in the last 3 years? What carrier currently insures it and at what premium?
- The area grade is low — what's the realistic commute time and amenity access for the typical tenant pool here? Any planned neighborhood developments (good or bad) we should know about?
- What's the average days-on-market for RENTAL listings here right now (not sales)? A rising rental-DOM trend means longer vacancies and softer asking-rent achievability than the comps imply.
- What's the recent tenant-quality profile in this submarket — average credit score on applications, eviction rate, late-payment / NSF rate, and stable-employment percentage? A property-management company in the area should have these aggregated.
- How much new for-sale + rental construction is in the pipeline within 1–3 miles? Heavy new supply typically softens prices + rents 12–24 months out; constrained supply supports both.
Investment metrics
- 1% rule
- 0.88% ✗
- Cap rate
- 6.15%
- Cash-on-cash
- -0.51%
- DSCR
- 0.98
- GRM
- 9.5
CMA / ARV
No comps found within radius.
Projected returns pro-forma
-3.0% appreciation · 3.24% rent growth · sell at horizon
- IRR
- -16.8%
- Equity multiple
- 0.40×
- Total profit
- $-45,500
- Equity at exit
- $40,556
- IRR
- -8.2%
- Equity multiple
- 0.48×
- Total profit
- $-39,643
- Equity at exit
- $23,518
Cash invested: $76,160 (down + closing). Projections, not guarantees.
Landlord ↔ Tenant lean methodology
- Overall (STATE)
- 90 Strongly Landlord-Friendly
- State South Carolina
- 90 Strongly Landlord-Friendly · R+6
- County
- — inherits STATE
- City
- — inherits STATE
ZIP-level market 29073
- Home prices YoY
- -19.1%
- Rents YoY
- 3.2%
- Active inventory
- 572
- Price-to-rent
- 9.5×
Monthly cashflow live
- Estimated rent
- $2,390 medium interval (Pro) →
- Mortgage (P&I)
- −$1,426
- Tax est. 1.5%
- −$340 /mo · $4,080/yr
- Insurance
- −$113
- HOA
- −$41
- Vacancy / Maint / Mgmt
- −$502
- Net cashflow
- $-32
Break-even live
Sensitivity live
| Price | -10% $156 | -5% $62 | +0% $-32 | +5% $-126 | +10% $-220 |
|---|---|---|---|---|---|
| Rent | -10% $-221 | -5% $-127 | +0% $-32 | +5% $62 | +10% $156 |
| Rate | -1.0pp $105 | -0.5pp $37 | base $-32 | +0.5pp $-103 | +1.0pp $-175 |
UW: 25.0% down · 7.5% · 30yr · 1.5% tax · 5.0% vac · 8.0% maint · 8.0% mgmt
Financing live
Cash to close
- Down payment
- $68,000
- Closing costs
- $8,160
- Reserves months
- —
- Total cash needed
- —
Loan-product check · same deal, 3 products live
Conventional
25% down · 7.5% · 30yr
- Down + closing
- —
- Monthly P&I
- —
- Monthly cashflow
- —
- DSCR
- —
- Eligible?
- —
Personal DTI + credit; lowest rate.
DSCR
20% down · 8.5% · 30yr
- Down + closing
- —
- Monthly P&I
- —
- Monthly cashflow
- —
- DSCR
- —
- Eligible?
- —
No personal income docs; deal must DSCR.
Hard money
10% down · 12.0% · 12mo
- Down + closing
- —
- Monthly P&I
- —
- Monthly cashflow
- —
- DSCR
- —
- Eligible?
- —
Short-term bridge; refi at stabilization.
Rent comps 2 comps
| Address | Beds | Baths | Sqft | Rent | $/sqft | DOM | Units | Dist |
|---|---|---|---|---|---|---|---|---|
| 141 Whitton Ct Lexington, SC | 3.0 | 2.5 | 1910 | $2,045 | $1.07 | 25d | 1 | 0.71mi |
| 124 Cross Hill Rd Lexington, SC | 3.0 | 2.0 | 1126 | $1,681 | $1.49 | 25d | 1 | 1.28mi |
HOA detail
- Monthly dues
- $41 · $492/yr
- Likely covers
- gas
Listing history 17 events
-
2026-06-22days on market $272,000 Active 41 DOM
-
2026-06-18days on market $272,000 Active 38 DOM
-
2026-06-17price $272,000 Active 37 DOM
-
2026-06-17days on market $271,600 Active 37 DOM
-
2026-06-16days on market $271,600 Active 36 DOM
-
2026-06-15days on market $271,600 Active 35 DOM
-
2026-06-14days on market $271,600 Active 33 DOM
-
2026-06-10days on market $271,600 Active 30 DOM
-
2026-06-09days on market $271,600 Active 29 DOM
-
2026-06-08days on market $271,600 Active 28 DOM
-
2026-06-07days on market $271,600 Active 27 DOM
-
2026-06-03days on market $271,600 Active 23 DOM
-
2026-06-03days on market $271,600 Active 22 DOM
-
2026-06-02days on market $271,600 Active 21 DOM
-
2026-05-31days on market $271,600 Active 20 DOM
-
2026-05-14$271,600 Active 645-char remark
Show marketing remark (645 chars)
This fourbedroom, twoandahalfbath Evans floorplan features a highly desirable layout with the primary bedroom located on the main floor. The home showcases an openconcept design with vaulted ceilings in the living area. The kitchen area includes beautiful gray cabinetry, white quartz countertops, a gas range and bartop seating perfect for entertaining. This home also includes a covered porch and storage shed for additional space. Upstairs, additional spacious bedrooms and a bonus room provides plenty of room for family, guests, or flex space. This home creates a warm and functional environment making it the perfection place to call home!
-
2026-05-11$271,600 Active
ⓘ Source: listings_history table (triggers on properties + properties_extension) + one-shot
backfill from property_details.listing_events for pre-trigger history.
Nearby sold comps map
Loading sold comps map…
Walkable amenities ~0.75 mi
Loading nearby amenities…
Taxation est. · year 1
- Rental income
- $28,683
- − Mortgage interest
- −$15,236
- − Property taxes
- −$4,080
- − Insurance
- −$1,360
- − Repairs & maintenance
- −$2,295
- − Management
- −$2,295
- − HOA
- −$492
- − Depreciation
- −$7,913
- Taxable loss
- −$4,987
- Est. tax savings @ 24.0%
- +$1,197
- After-tax cash flow
- $808/yr
For passive investors: Depreciation is non-cash, so a rental often shows a tax loss while cash-flowing — sheltering income. Rental losses are passive: they offset passive income freely, and up to $25,000/yr can offset ordinary (W-2) income if you actively participate and your MAGI is under $100k (phasing out to $0 by $150k); unused losses carry forward. On sale, claimed depreciation is recaptured at up to 25%, and gains may owe capital-gains tax (a 1031 exchange can defer both). Figures are a year-1 estimate at your 24.0% rate — not tax advice; consult a CPA.
Condition & rehab AI · 12 photos
This home is in excellent condition with a good layout and modern finishes. It is move-in ready and would benefit from landscaping and smart home integration to further enhance its value.
Value-add opportunities
- Both landscaping — improves curb appeal and adds value
- Both smart home integration — enhances convenience and adds modern appeal
Renovation cost estimate screening
Value-add ROI direction
- Both landscaping — improves curb appeal and adds value ↑
- Both smart home integration — enhances convenience and adds modern appeal ↑
ⓘ Cost ranges are severity-bucket heuristics (US national rule-of-thumb). Get contractor quotes + a written scope before underwriting a rehab budget.
Schools (NCES district)
- District
- Lexington 01
- NCES district ID
- 4502700
- Math proficiency
- 42% ▼ -12.00%
- Reading proficiency
- 53% ▼ -2.00%
- Median HH income
- $61,298
- Composite
- 41.75/100
- National rank
- #3399
- State rank
- #11 of 80 in SC
Livability — Red Bank
- Score
- 66/100
- State rank
- #121
- US rank
- #11985
Category grades
Schools grade is shown separately in the Schools card above.
Census & demographics
- County
- Lexington County · 232,571 people
- Metro
- Columbia, SC
- Population (ZIP)
- 53,156
- Household income
- $77,229
- Rent vs Own
- Severe rent burden
- 935.0
Population outlook (Lexington County) Hauer SSP2
- Today (2025)
- 322,999 people
- By 2030
- 342,356 · +6.0%
- By 2040
- 377,715 · +16.9%
- By 2050
- 406,984 · +26.0%
- By 2075
- 465,447 · +44.1%
- By 2100
- 485,674 · +50.4%
Race, ethnicity, and origin ACS 2023
- Neighborhood character
- Predominantly White (72%)
- Race & ethnicity
- White 72% Black 14% Two or more races 7% Hispanic / Latino 6% Asian 2%
- Hispanic origin (detail)
- Mexican 2% Puerto Rican 1%
- Common ancestry
- Romanian 3% Italian 2% Slovak 1%
- Foreign-born
- 4% · Canada, China
- Languages at home
- 93% English-only · Spanish 5% Other Indo-European 1%
Political lean MEDSL · Lexington
- 2024 margin
- Solid R (+33.5) · D 32.5% · R 66.0% · Other 1.4%
- 2008→2024 swing
- +4.6pp toward D · 2008: -38.0pp · 2024: -33.5pp
- All cycles
- 2024: R+33.5 2020: R+30.1 2016: R+36.7 2012: R+37.8 2008: R+38.0
Not yet ingested
- Civics
- —
Market trends
- HPI YoY
- ▼ -59.20%
- Current HPI
- 249.8957
- Rent YoY
- ▲ 3.24%
- Metro
- Columbia, SC
- State GDP YoY
- ▲ 4.51%
- F500 in state
- 2
Industry mix (Fortune 500 HQ in SC)
| Industry | F500 HQs | Revenue |
|---|---|---|
| Packaging | 1 | $7B |
|
||
Price history
+0.0% since first listed2 events — show timeline
- 2026-05-14 Listed $271,600 Zillow
- 2026-05-11 Listed $271,600 Consolidated MLS
Cash-flow waterfall
monthlySold comps — $/sqft
last 12 mo · ≤1 miLoading sold comps…