 Multi-family
None · New Orleans, LA
Flood risk 7/10 · Major
- FEMA flood zone
- X
- Chance of flooding over 30 yrs
- 0.6%
- Est. flood insurance / yr
- $507 – $1,088
Fire risk 1/10 · Minimal
- Est. fire insurance / yr
- $1,269 – $2,357
Heat risk 10/10 · Severe
- Hot days now (above 108°F)
- 7 days/yr
- Hot days in 30 yrs
- 21 days/yr
Wind risk 10/10 · Severe
- Chance of severe wind over 30 yrs
- 99.0%
Air-quality risk 4/10 · Minor
- Unhealthy air days now
- 4 days/yr
- Unhealthy air days in 30 yrs
- 4 days/yr
Risk factors via First Street. Map © Google.
Why this score? — see what drove the C- grade
The composite is a weighted blend of 9 inputs, each scored 0–100. Each bar is that input's sub-score; the figure is the points it added to the 100-point composite (weight × sub-score).
- Cash flow +17.9/30.0
- ARV discount +15.0/15.0
- DSCR +5.6/10.0
- 1% rule +4.8/10.0
- Livability +4.0/5.0
- Rent growth +2.5/5.0
- Condition / age +2.2/5.0
- Schools +1.6/10.0
- Appreciation +0.0/10.0
$310,000
🖨 Deal sheet 📄 Offer letter ✓ Due diligence
Multi-family units
County records classify this as Multi-Family (2-4 Unit). Listing-text estimate: 1 unit. estimate disagrees with records
Listing remarks MLS
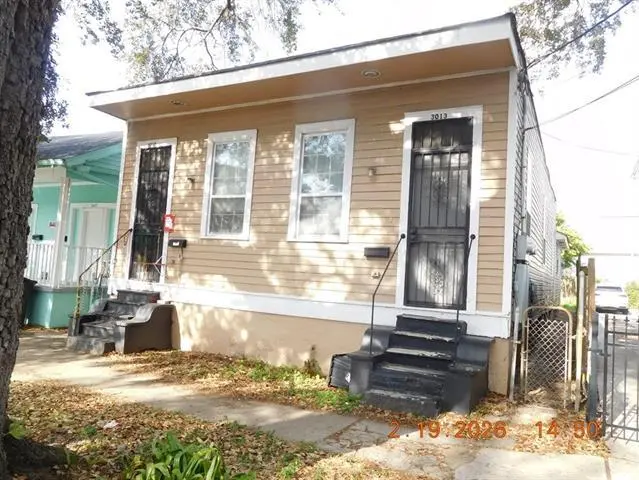
Here's an exceptional opportunity to live in the heart of Mid-City, where convenience meets culture. This double is just minutes from the Canal Streetcar line, universities, medical facilities, Bayou St John, Whole Foods, City Park, Lafitte Greenway, the CBD, local dining, bars, coffee shops and other businesses. This property is truly in a great location and presents an awesome choice to anyone desiring to be an owner-occupant or investor seeking strong rental appeal in one of the city's most vibrant neighborhoods. Whether you are expanding your portfolio or seeking a live-in investment, this property checks all the boxes. Each unit features an identical layout with hard surface flooring and ceiling fans throughout. Both units were updated during the past one to two years.
Key facts
- Updated units
- Ceiling fans
- Mid-city location
Tags
Neighborhood map
What this means for you Summary
Snapshot
- This is a multifamily listed at $310k. Condition is rated fair.
Deal economics
- At list price, monthly cash flow is $194 ($2k/yr) — positive.
- The deal already cash-flows at list — no discount required.
- To meet the 1% rule (rent ≥ 1% of price), the offer needs to be $304k (1.9% below list).
- Recommended offer: $291k (6.0% below list) — sets the bar for market timing.
- Cap rate 7.3% vs local median 4.4% in New Orleans — top-decile yield for the area; either an underpriced asset or a hidden risk that comps aren't pricing in. Stress-test before assuming the spread holds.
Location & tenants
- Location reads 81/100 on livability (#3 in LA, #1,383 nationally) — a professional / high-income tenant draw. Strengths: amenities A+, commute A+, health & safety A+; Watch: crime C-, employment D.
- Orleans Parish (urban): math 11% / reading 27% proficiency, ranked #69 of 98 in LA (top 70%) — low school quality limits family demand, transient renter base, plan for 1-2y turnover; 68% free/reduced lunch — lower-income household profile, screen leases tightly.
- Market conditions: Rents soft (-0.2%/yr); 381 active listings in the ZIP; 40 comparable units currently listed for rent nearby; rentals at typical pace (median 20d on market — plan ~3-4 weeks tenant-placement turnaround); 710 units permitted in Orleans Parish in 2024 (244 in 5+ unit buildings).
- At $3,042/mo this rent would consume 69% of the median local household income ($53k/yr) (locally 3381% of renters already pay >50% of income on rent) — very limited rent-growth headroom before tenants either downsize or default.
Forward outlook
- Local home prices are declining (-3.0%/yr); year-one equity from $2k of loan paydown is wiped out by about $9k of value loss. Plan a longer hold.
- Orleans County population projected at +61% by 2050 — long-run rental-demand tailwind backs the buy-and-hold thesis.
Negotiation context
- It's been on market 88 days — a 6% lower offer ($291k) is reasonable based on typical stale-listing flexibility.
Risks & watch-outs
- Watch-outs: flood insurance adds $66/mo.
- Climate carrying-cost: major flood risk; severe wind risk, 99% chance of damaging wind over 30y; extreme-heat days projected 7→21/yr by 2055 (HVAC capex compounding) — expect insurance premiums to compound above CPI over the hold.
Questions for the listing agent
- It's been on market 88 days. Have you received any prior offers? Is the seller open to a 6% concession, seller financing, or rate buy-down credit?
- Have any recent inspections been done? Can we get a copy of the seller's disclosures and any deferred-maintenance estimates?
- What's the actual annual flood-insurance premium (NFIP or private), and is the property in a SFHA with mandatory coverage?
- Why hasn't it sold? Are there any deal-killer items the seller is aware of (foundation, flood, title, zoning, code violations)?
- Is there a deadline driving the sale (1031 exchange, divorce, estate, relocation)? That informs how much negotiation room exists.
- What's the average days-on-market for RENTAL listings here right now (not sales)? A rising rental-DOM trend means longer vacancies and softer asking-rent achievability than the comps imply.
- What's the recent tenant-quality profile in this submarket — average credit score on applications, eviction rate, late-payment / NSF rate, and stable-employment percentage? A property-management company in the area should have these aggregated.
- How much new apartment / multifamily construction is in the pipeline within 1–3 miles? Heavy new supply (>2% of stock underway) typically softens rents 12–24 months out; light construction supports rent growth.
Investment metrics
- 1% rule
- 0.98% ✗
- Cap rate
- 7.30%
- Cash-on-cash
- 3.61%
- DSCR
- 1.16
- GRM
- 8.5
CMA / ARV
- ARV (median comp)
- $398,142
- List price
- $310,000
- Delta
- -22.14%
- Verdict
- UNDERPRICED
- Comps
- 20 within 1.0 mi
Show comp detail 12 sales within ~0.75 mi
| Address | Dist | Beds/Ba | Sqft | Sold | Price | $/sf | Match |
|---|---|---|---|---|---|---|---|
| — | 0.00mi | —/— | 1,816 (-7%) | 3mo | $210,000 | $116 | 86 |
| 1668 Paul Morphy St | 0.27mi | 4/2.0 | 1,980 (+2%) | 0mo | $285,000 | $144 | 84 |
| 1707-05 Rousselin Dr | 0.38mi | —/— | 1,950 (0%) | 0mo | $300,000 | $154 | 82 |
| 1707 05 Rousselin Dr | 0.38mi | 6/2.0 | 1,950 (0%) | 0mo | $300,000 | $154 | 82 |
| 1682-84 N Dupre St | 0.27mi | —/— | 2,114 (+8%) | 2mo | $400,500 | $189 | 72 |
| 1682 84 N Dupre St | 0.27mi | 4/3.0 | 2,114 (+8%) | 2mo | $400,500 | $189 | 72 |
| 2601 03 St Ann St | 0.65mi | 4/2.0 | 1,946 (-0%) | 5mo | $220,000 | $113 | 65 |
| 2912-14 St. Peter St | 0.66mi | —/— | 1,912 (-2%) | 2mo | $290,000 | $152 | 64 |
| 2912 14 St. Peter St | 0.67mi | 4/2.0 | 1,912 (-2%) | 2mo | $290,000 | $152 | 64 |
| 2613-15 St Philip St | 0.51mi | —/— | 1,810 (-7%) | 2mo | $239,000 | $132 | 63 |
| 2613 15 St Philip St | 0.51mi | 6/2.0 | 1,810 (-7%) | 2mo | $239,000 | $132 | 63 |
| 1737 39 Duels St | 0.72mi | 4/2.0 | 1,692 (-13%) | 2mo | $200,000 | $118 | 42 |
Match score weights: distance 35% · size 25% · config 20% · recency 20%. Top-matched comps best support the ARV.
Projected returns pro-forma
-3.0% appreciation · 0.0% rent growth · sell at horizon
- IRR
- -15.6%
- Equity multiple
- 0.46×
- Total profit
- $-46,681
- Equity at exit
- $46,222
- IRR
- -13.5%
- Equity multiple
- 0.32×
- Total profit
- $-58,808
- Equity at exit
- $26,803
Cash invested: $86,800 (down + closing). Projections, not guarantees.
Landlord ↔ Tenant lean methodology
- Overall (STATE)
- 90 Strongly Landlord-Friendly
- State Louisiana
- 90 Strongly Landlord-Friendly · R+12
- County
- — inherits STATE
- City
- — inherits STATE
ZIP-level market 70119
- Home prices YoY
- -34.8%
- Rents YoY
- -0.2%
- Active inventory
- 381
- Price-to-rent
- 17.0×
Monthly cashflow live
- Estimated rent
- $3,042 high interval (Pro) →
- Mortgage (P&I)
- −$1,626
- Tax est. 1.5%
- −$388 /mo · $4,650/yr
- Insurance
- −$129
- Flood insurance flood zone
- −$66 /mo · $798/yr
- HOA
- −$0
- Vacancy / Maint / Mgmt
- −$639
- Net cashflow
- $194
Break-even live
2-unit breakdown (identical units grouped — click to expand)
| Units | Beds | Baths | Est. rent |
|---|---|---|---|
| 2× units | 2 | 1 | $3,042 |
| #1 | 2 | 1 | $1,521 |
| #2 | 2 | 1 | $1,521 |
| Total (2 units) | $3,042 | ||
UW: 25.0% down · 7.5% · 30yr · 1.5% tax · 5.0% vac · 8.0% maint · 8.0% mgmt
Financing live
Cash to close
- Down payment
- $77,500
- Closing costs
- $9,300
- Reserves months
- —
- Total cash needed
- —
Loan-product check · same deal, 3 products live
Conventional
25% down · 7.5% · 30yr
- Down + closing
- —
- Monthly P&I
- —
- Monthly cashflow
- —
- DSCR
- —
- Eligible?
- —
Personal DTI + credit; lowest rate.
DSCR
20% down · 8.5% · 30yr
- Down + closing
- —
- Monthly P&I
- —
- Monthly cashflow
- —
- DSCR
- —
- Eligible?
- —
No personal income docs; deal must DSCR.
Hard money
10% down · 12.0% · 12mo
- Down + closing
- —
- Monthly P&I
- —
- Monthly cashflow
- —
- DSCR
- —
- Eligible?
- —
Short-term bridge; refi at stabilization.
Rent comps 40 comps
| Address | Beds | Baths | Sqft | Rent | $/sqft | DOM | Units | Dist |
|---|---|---|---|---|---|---|---|---|
| 1466 N White St New Orleans, LA | 3.0 | 1.5 | 1500 | $2,250 | $1.50 | 3d | 1 | 0.07mi |
| 2664 Lepage St New Orleans, LA | 3.0 | 2.0 | 1750 | $2,725 | $1.56 | 43d | 1 | 0.16mi |
| 3024 Esplanade Ave New Orleans, LA | 3.0 | 2.5 | 2300 | $4,500 | $1.96 | 43d | 1 | 0.26mi |
| 2422 Columbus St New Orleans, LA | 2.0 | 2.0 | 1550 | $2,500 | $1.61 | 21d | 1 | 0.37mi |
| 1232 N Dorgenois St New Orleans, LA | 2.0 | 2.0 | 1323 | $1,800 | $1.36 | 23d | 1 | 0.41mi |
| 1821 Rosiere St New Orleans, LA | 2.0 | 1.0 | 1400 | $1,300 | $0.93 | 23d | 1 | 0.42mi |
| 1823 Rosiere St New Orleans, LA | 2.0 | 1.0 | 1400 | $1,450 | $1.04 | 23d | 1 | 0.42mi |
| 2331 Columbus St New Orleans, LA | 3.0 | 1.0 | 1976 | $1,850 | $0.94 | 23d | 1 | 0.42mi |
| 2641 Ursulines Ave Unit A New Orleans, LA | 2.0 | 1.0 | 1350 | $2,200 | $1.63 | 17d | 1 | 0.43mi |
| 2329 Laharpe St New Orleans, LA | 3.0 | 1.0 | 1250 | $1,000 | $0.80 | 19d | 1 | 0.43mi |
| 1431 Leda Ct New Orleans, LA | 2.0 | 1.0 | 1300 | $1,950 | $1.50 | 23d | 1 | 0.49mi |
| 1433 N Miro St New Orleans, LA | 1.0 | 2.0 | 1227 | $2,000 | $1.63 | 10d | 1 | 0.54mi |
| 914 N Broad St New Orleans, LA | 2.0 | 2.0 | 1450 | $2,200 | $1.52 | 23d | 1 | 0.55mi |
| 3702 Trafalgar St New Orleans, LA | 3.0 | 2.0 | 1428 | $2,350 | $1.65 | 16d | 1 | 0.55mi |
| 824 N Dupre St New Orleans, LA | 3.0 | 2.0 | 1315 | $2,250 | $1.71 | 17d | 1 | 0.56mi |
| 1901 Gentilly Blvd New Orleans, LA | 3.0 | 2.5 | 2205 | $4,000 | $1.81 | 43d | 1 | 0.57mi |
| 3443 Esplanade Ave New Orleans, LA | 3.0 | 1.0–2.0 | 997 | $2,042 | $2.05 | 3d | 30 | 0.58mi |
| 3100 Orleans Ave New Orleans, LA | 2.0 | 1.0 | 1875 | $1,350 | $0.72 | 23d | 1 | 0.68mi |
| 2130 N Broad St New Orleans, LA | 2.0 | 1.0 | 1579 | $1,350 | $0.85 | 23d | 1 | 0.71mi |
| 1831 N Miro St New Orleans, LA | 3.0 | 2.0 | 1882 | $2,500 | $1.33 | 43d | 1 | 0.77mi |
| 2175 N Broad St New Orleans, LA | 2.0 | 1.0 | 1500 | $1,500 | $1.00 | 16d | 1 | 0.77mi |
| 2129 Dumaine St New Orleans, LA | 3.0 | 2.0 | 1226 | $1,850 | $1.51 | 3d | 1 | 0.81mi |
| 3700 Orleans Ave New Orleans, LA | 1.0–3.0 | 1.0–2.0 | 1081 | $2,285 | $2.11 | 3d | 48 | 0.89mi |
| 1929 Dumaine St New Orleans, LA | 3.0 | 1.0 | 1293 | $1,500 | $1.16 | 3d | 1 | 0.91mi |
| 1472 N Claiborne Ave New Orleans, LA | 3.0 | 1.0 | 1312 | $1,900 | $1.45 | 16d | 1 | 0.97mi |
| 1933 Industry St New Orleans, LA | 3.0 | 2.0 | 1400 | $1,595 | $1.14 | 16d | 1 | 0.98mi |
| 1936 N Johnson St Unit 36 New Orleans, LA | 3.0 | 2.0 | 1844 | $2,400 | $1.30 | 23d | 1 | 1.02mi |
| 1938 N Johnson St Unit 38 New Orleans, LA | 3.0 | 2.0 | 1844 | $2,400 | $1.30 | 23d | 1 | 1.02mi |
| 3701 Conti St New Orleans, LA | 2.0 | 1.0–2.0 | 935 | $2,923 | $3.12 | 3d | 17 | 1.03mi |
| 1433 Esplanade Ave New Orleans, LA | 3.0 | 2.0 | 2411 | $5,000 | $2.07 | 2d | 1 | 1.04mi |
| 315 N Miro St New Orleans, LA | 3.0 | 3.0 | 1276 | $2,500 | $1.96 | 23d | 1 | 1.06mi |
| 315 N Miro St New Orleans, LA | 3.0 | 3.0 | 1276 | $2,300 | $1.80 | 20d | 1 | 1.06mi |
| 1423 N Villere St Unit A New Orleans, LA | 2.0 | 3.0 | 1964 | $2,500 | $1.27 | 43d | 1 | 1.07mi |
| 1434 Annette St New Orleans, LA | 2.0 | 1.0 | 1536 | $1,700 | $1.11 | 3d | 1 | 1.09mi |
| 1434 Annette St New Orleans, LA | 2.0 | 1.0 | 1536 | $1,700 | $1.11 | 3d | 1 | 1.09mi |
| 4226 Dumaine St New Orleans, LA | 3.0 | 2.0 | 1411 | $2,250 | $1.59 | 17d | 1 | 1.11mi |
| 2033 Conti St New Orleans, LA | 3.0 | 3.0 | 1249 | $2,250 | $1.80 | 14d | 1 | 1.11mi |
| 4227 Saint Ann St New Orleans, LA | 3.0 | 2.0 | 1900 | $2,800 | $1.47 | 3d | 1 | 1.13mi |
| 2105 Bienville St New Orleans, LA | 3.0 | 3.0 | 1231 | $2,350 | $1.91 | 17d | 1 | 1.13mi |
| 1908 Saint Louis St New Orleans, LA | 3.0 | 3.0 | 1234 | $2,300 | $1.86 | 23d | 1 | 1.13mi |
Listing history 15 events
-
2026-06-18days on market $310,000 Active 88 DOM
-
2026-06-17days on market $310,000 Active 87 DOM
-
2026-06-16days on market $310,000 Active 86 DOM
-
2026-06-15days on market $310,000 Active 85 DOM
-
2026-06-13days on market $310,000 Active 83 DOM
-
2026-06-10days on market $310,000 Active 80 DOM
-
2026-06-09days on market $310,000 Active 79 DOM
-
2026-06-08days on market $310,000 Active 78 DOM
-
2026-06-07days on market $310,000 Active 77 DOM
-
2026-06-05days on market $310,000 Active 74 DOM
-
2026-06-03days on market $310,000 Active 73 DOM
-
2026-06-02days on market $310,000 Active 72 DOM
-
2026-06-01days on market $310,000 Active 71 DOM
-
2026-05-31days on market $310,000 Active 70 DOM
-
2026-03-19$310,000 Active 784-char remark
Show marketing remark (784 chars)
Here's an exceptional opportunity to live in the heart of Mid-City, where convenience meets culture. This double is just minutes from the Canal Streetcar line, universities, medical facilities, Bayou St John, Whole Foods, City Park, Lafitte Greenway, the CBD, local dining, bars, coffee shops and other businesses. This property is truly in a great location and presents an awesome choice to anyone desiring to be an owner-occupant or investor seeking strong rental appeal in one of the city's most vibrant neighborhoods. Whether you are expanding your portfolio or seeking a live-in investment, this property checks all the boxes. Each unit features an identical layout with hard surface flooring and ceiling fans throughout. Both units were updated during the past one to two years.
ⓘ Source: listings_history table (triggers on properties + properties_extension) + one-shot
backfill from property_details.listing_events for pre-trigger history.
Climate risk First Street
- Flood 7/10 Severe FEMA zone X · 60% chance over 30 yrs
- Wildfire 1/10 Low
- Heat 10/10 Extreme 7 d/yr ≥108°F today · 21 d/yr by 30 yrs out
- Wind 10/10 Extreme 99% chance of damaging wind over 30 yrs
- Air quality 4/10 Moderate 4 unhealthy d/yr today · 4 by 30 yrs out
Nearby sold comps map
Loading sold comps map…
Walkable amenities ~0.75 mi
Loading nearby amenities…
Taxation est. · year 1
- Rental income
- $36,504
- − Mortgage interest
- −$17,365
- − Property taxes
- −$4,650
- − Insurance
- −$2,348
- − Repairs & maintenance
- −$2,920
- − Management
- −$2,920
- − Depreciation
- −$9,018
- Taxable loss
- −$2,717
- Est. tax savings @ 24.0%
- +$652
- After-tax cash flow
- $2,985/yr
For passive investors: Depreciation is non-cash, so a rental often shows a tax loss while cash-flowing — sheltering income. Rental losses are passive: they offset passive income freely, and up to $25,000/yr can offset ordinary (W-2) income if you actively participate and your MAGI is under $100k (phasing out to $0 by $150k); unused losses carry forward. On sale, claimed depreciation is recaptured at up to 25%, and gains may owe capital-gains tax (a 1031 exchange can defer both). Figures are a year-1 estimate at your 24.0% rate — not tax advice; consult a CPA.
Condition & rehab AI · 12 photos
This property requires moderate renovations to improve its condition and increase its value. The exterior and interior need significant updates, including painting, updating fixtures, and landscaping. These improvements will enhance both the resale and rental value of the property.
Repairs flagged
- Major siding — Significant wear and tear
- Major steps and railings — Worn and unsafe
- Major landscaping — Overgrown and unkempt
- Major exterior paint — Worn and peeling
- Major interior paint — Worn and uneven
- Major kitchen cabinets — Worn and outdated
- Major bathroom fixtures — Worn and outdated
- Major appliances — Worn and outdated
- Major furniture — Worn and outdated
Value-add opportunities
- Both Painting and updating exterior — Enhances curb appeal and value
- Both Updating kitchen and bathroom fixtures — Improves functionality and aesthetics
- Both Reconditioning appliances — Enhances functionality and aesthetics
- Both Landscaping and yard maintenance — Enhances curb appeal and value
Renovation cost estimate screening
| Repair item | Severity | Est. cost |
|---|---|---|
| siding · Significant wear and tear | Major | $15,000–50,000 |
| steps and railings · Worn and unsafe | Major | $15,000–50,000 |
| landscaping · Overgrown and unkempt | Major | $15,000–50,000 |
| exterior paint · Worn and peeling | Major | $15,000–50,000 |
| interior paint · Worn and uneven | Major | $15,000–50,000 |
| kitchen cabinets · Worn and outdated | Major | $15,000–50,000 |
| bathroom fixtures · Worn and outdated | Major | $15,000–50,000 |
| appliances · Worn and outdated | Major | $15,000–50,000 |
| furniture · Worn and outdated | Major | $15,000–50,000 |
| Total estimated repair cost · 9 items | $135,000–450,000 |
Value-add ROI direction
- Both Painting and updating exterior — Enhances curb appeal and value ↑
- Both Updating kitchen and bathroom fixtures — Improves functionality and aesthetics ↑
- Both Reconditioning appliances — Enhances functionality and aesthetics ↑
- Both Landscaping and yard maintenance — Enhances curb appeal and value ↑
ⓘ Cost ranges are severity-bucket heuristics (US national rule-of-thumb). Get contractor quotes + a written scope before underwriting a rehab budget.
Schools (NCES district)
- District
- Orleans Parish
- NCES district ID
- 2201170
- Math proficiency
- 11% ▼ -52.00%
- Reading proficiency
- 27% ▼ -46.00%
- Median HH income
- $37,011
- Composite
- 15.78/100
- National rank
- #9271
- State rank
- #69 of 98 in LA
Livability — New Orleans
- Score
- 81/100
- State rank
- #3
- US rank
- #1383
Category grades
Schools grade is shown separately in the Schools card above.
Census & demographics
- Census place
- New Orleans, LA
- County
- Orleans Parish · 338,817 people
- City population
- 338,817
- Metro
- New Orleans-Metairie, LA
- Population (ZIP)
- 37,253
- Household income
- $53,143
- Rent vs Own
- Severe rent burden
- 3381.0
Population outlook (Orleans County) Hauer SSP2
- Today (2025)
- 513,025 people
- By 2030
- 575,781 · +12.2%
- By 2040
- 700,174 · +36.5%
- By 2050
- 826,541 · +61.1%
- By 2075
- 1,123,374 · +119.0%
- By 2100
- 1,355,609 · +164.2%
Race, ethnicity, and origin ACS 2023
- Neighborhood character
- Diverse neighborhood (Simpson 0.64)
- Race & ethnicity
- Black 44% White 40% Two or more races 10% Hispanic / Latino 9% Asian 1%
- Hispanic origin (detail)
- Mexican 2%
- Common ancestry
- Lithuanian 8% Slovak 2% Romanian 1%
- Foreign-born
- 6% · Canada, Jamaica
- Languages at home
- 91% English-only · Spanish 6% French/Haitian/Cajun 1% Other Indo-European 0%
Political lean MEDSL · Orleans
- 2024 margin
- Solid D (+67.0) · D 82.2% · R 15.2% · Other 2.7%
- 2008→2024 swing
- +6.7pp toward D · 2008: 60.3pp · 2024: 67.0pp
- All cycles
- 2024: D+67.0 2020: D+68.2 2016: D+66.2 2012: D+62.5 2008: D+60.3
Not yet ingested
- Civics
- —
Market trends
- HPI YoY
- ▼ -135.38%
- Current HPI
- 253.1929
- Rent YoY
- ▼ -0.20%
- Metro
- New Orleans-Metairie, LA
- State GDP YoY
- ▲ 3.29%
- F500 in state
- 10
Industry mix (Fortune 500 HQ in LA)
| Industry | F500 HQs | Revenue |
|---|---|---|
| Telecommunications | 2 | $23B |
|
||
| Utilities | 1 | $12B |
|
||
| Wholesale / Distribution | 1 | $5B |
|
||
| Advertising | 1 | $2B |
|
||
Price history
1 event — show timeline
- 2026-03-19 Listed $310,000 AcadianaMLS
Cash-flow waterfall
monthlySold comps — $/sqft
last 12 mo · ≤1 miLoading sold comps…