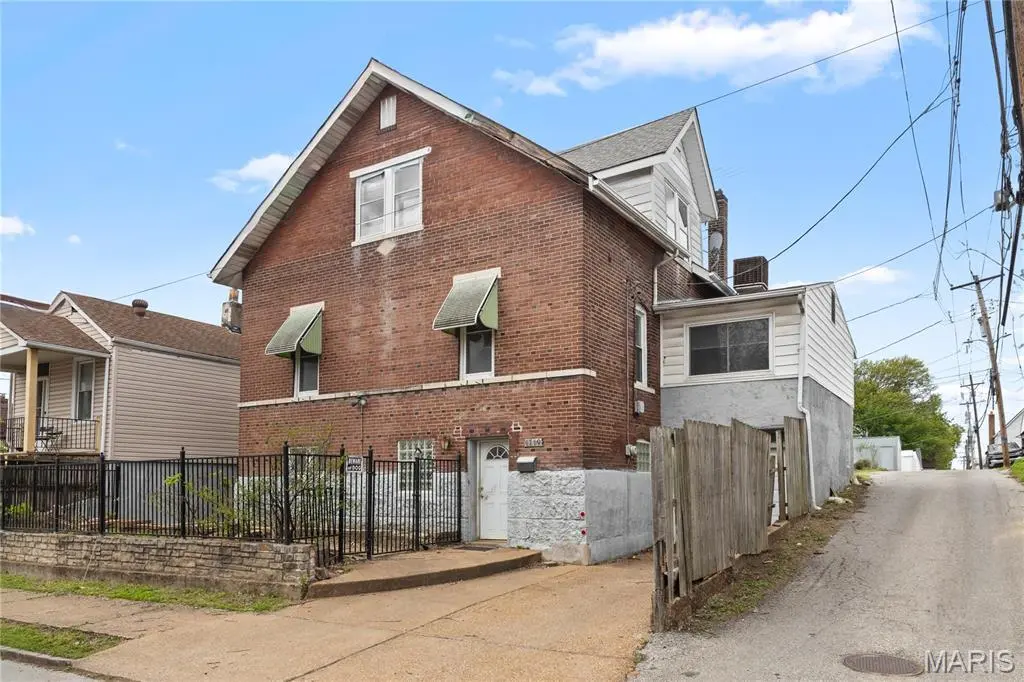
1719 Edwards St · St. Louis, MO
Flood risk 1/10 · Minimal
- FEMA flood zone
- X (unshaded)
- Chance of flooding over 30 yrs
- 0.0%
- Est. flood insurance / yr
- $473 – $860
Fire risk 1/10 · Minimal
- Est. fire insurance / yr
- $1,054 – $1,958
Heat risk 5/10 · Moderate
- Hot days now (above 107°F)
- 7 days/yr
- Hot days in 30 yrs
- 21 days/yr
Wind risk 2/10 · Minimal
- Chance of severe wind over 30 yrs
- 1.0%
Air-quality risk 3/10 · Minor
- Unhealthy air days now
- 3 days/yr
- Unhealthy air days in 30 yrs
- 4 days/yr
Risk factors via First Street. Map © Google.
Why this score? — see what drove the B- grade
The composite is a weighted blend of 9 inputs, each scored 0–100. Each bar is that input's sub-score; the figure is the points it added to the 100-point composite (weight × sub-score).
- Cash flow +30.0/30.0
- DSCR +10.0/10.0
- 1% rule +9.2/10.0
- ARV discount +7.5/15.0
- Rent growth +4.1/5.0
- Livability +2.5/5.0
- Condition / age +2.5/5.0
- Schools +1.2/10.0
- Appreciation +0.0/10.0
$175,000
🖨 Deal sheet 📄 Offer letter ✓ Due diligence
Listing remarks MLS
Historic raised 2-story renovation opportunity on The Hill with approx 1900 SQ FT, 4 bedrooms and 2 baths. Corner location, predominant brick exterior with fenced front yard, GARAGE addition. Staircase up to bright living room. Newer STAINLESS STEEL kitchen gas range and dishwasher. Huge 22-FT REC ROOM over garage. Formal dining, family room, full bath with tub/shower combo, and 3-season SUNROOM with sliding door to FENCED PATIO. Bedrooms upstairs with views of city lights, plus hall bath with shower. Vinyl tilt-in INSULATED WINDOWS and newer DUAL HVAC systems. Short walk to award-winning RESTAURANTS! Close to world-class 1370-acre FOREST PARK (nature reserve, lakes, boating, museums, zoo, science center, theater, sports, 2 golf courses and more), near Highways 44/100/64 and popular St Louis attractions. Property to be conveyed in its current condition.
Key facts
- 2,495 sq ft lot
- Garage
- Built 1915
Neighborhood map
What this means for you Summary
Snapshot
- This is a 4-bed/2.0-bath single-family listed at $175k.
Deal economics
- At list price, monthly cash flow is $815 ($10k/yr) — positive.
- The deal already cash-flows at list — no discount required.
- Meets the 1% rule at list price ($2k rent vs $175k).
- Recommended offer: $172k (1.5% below list) — sets the bar for market timing.
- Cap rate 11.9% vs local median 5.0% in St. Louis — top-decile yield for the area; either an underpriced asset or a hidden risk that comps aren't pricing in. Stress-test before assuming the spread holds.
Location & tenants
- Location reads: area grade B — affects rentability + tenant quality, not the cash-flow math above.
- St. Louis City (urban): math 10% / reading 18% proficiency, ranked #312 of 324 in MO (top 96%) — low school quality limits family demand, transient renter base, plan for 1-2y turnover; 80% free/reduced lunch — lower-income household profile, screen leases tightly.
- Market conditions: Rents rising fast (+6.2%/yr); 98 active listings in the ZIP; 10 comparable units currently listed for rent nearby; rentals at typical pace (median 18d on market — plan ~3-4 weeks tenant-placement turnaround); 40% of comp listings sitting > 30 days — soft ceiling on asking rent; solid renter incomes; 294 units permitted in St. Louis city in 2024 (227 in 5+ unit buildings).
- This rent runs 37% of the median local income ($82k/yr) — at the standard rent-burdened threshold; future hikes will face affordability resistance.
Forward outlook
- Local home prices are declining (-3.0%/yr); year-one equity from $1k of loan paydown is wiped out by about $5k of value loss. Plan a longer hold.
- St. Louis County population projected to shrink 6% by 2050 — rents likely to lag national; underwrite the cash flow, not the appreciation.
- At projected returns (-3.0% appreciation + 6.2% rent growth), your $49k cash investment doubles in ~6 years — after that, you're playing with house money.
Negotiation context
- It's been on market 27 days — a 2% lower offer ($172k) is reasonable based on typical stale-listing flexibility.
Risks & watch-outs
- Watch-outs: built in 1915 — expect roof / HVAC / electrical / plumbing capex.
- Climate carrying-cost: extreme-heat days projected 7→21/yr by 2055 (HVAC capex compounding) — expect insurance premiums to compound above CPI over the hold.
Questions for the listing agent
- Built in 1915 — when were the roof, HVAC, electrical panel, plumbing, and water heater last replaced?
- Is there a deadline driving the sale (1031 exchange, divorce, estate, relocation)? That informs how much negotiation room exists.
- What's the average days-on-market for RENTAL listings here right now (not sales)? A rising rental-DOM trend means longer vacancies and softer asking-rent achievability than the comps imply.
- What's the recent tenant-quality profile in this submarket — average credit score on applications, eviction rate, late-payment / NSF rate, and stable-employment percentage? A property-management company in the area should have these aggregated.
- How much new for-sale + rental construction is in the pipeline within 1–3 miles? Heavy new supply typically softens prices + rents 12–24 months out; constrained supply supports both.
Investment metrics
- 1% rule
- 1.42% ✓
- Cap rate
- 11.88%
- Cash-on-cash
- 19.95%
- DSCR
- 1.89
- GRM
- 5.9
CMA / ARV
- ARV (median comp)
- $367,855
- List price
- $175,000
- Delta
- -52.43%
- Verdict
- UNDERPRICED
- Comps
- 20 within 1.0 mi
Show comp detail 1 sale within ~0.75 mi
| Address | Dist | Beds/Ba | Sqft | Sold | Price | $/sf | Match |
|---|---|---|---|---|---|---|---|
| 5630 Botanical Ave | 0.69mi | 3/2.0 (-1) | 850 (+12%) | 20mo | $365,000 | $429 | 27 |
Match score weights: distance 35% · size 25% · config 20% · recency 20%. Top-matched comps best support the ARV.
Projected returns pro-forma
-3.0% appreciation · 6.24% rent growth · sell at horizon
- IRR
- 15.6%
- Equity multiple
- 1.65×
- Total profit
- $31,924
- Equity at exit
- $26,093
- IRR
- 26.5%
- Equity multiple
- 3.68×
- Total profit
- $131,426
- Equity at exit
- $15,131
Cash invested: $49,000 (down + closing). Projections, not guarantees.
Landlord ↔ Tenant lean methodology
- Overall (STATE)
- 81 Strongly Landlord-Friendly
- State Missouri
- 81 Strongly Landlord-Friendly · R+10
- County
- — inherits STATE
- City
- — inherits STATE
ZIP-level market 63110
- Rents YoY
- 6.2%
- Active inventory
- 98
- Price-to-rent
- 5.9×
Monthly cashflow live
- Estimated rent
- $2,492 high interval (Pro) →
- Mortgage (P&I)
- −$918
- Tax from tax record
- −$164 /mo · $1,964/yr
- Insurance
- −$73
- HOA
- −$0
- Vacancy / Maint / Mgmt
- −$523
- Net cashflow
- $815
Break-even live
UW: 25.0% down · 7.5% · 30yr · 1.5% tax · 5.0% vac · 8.0% maint · 8.0% mgmt
Financing live
Cash to close
- Down payment
- $43,750
- Closing costs
- $5,250
- Reserves months
- —
- Total cash needed
- —
Loan-product check · same deal, 3 products live
Conventional
25% down · 7.5% · 30yr
- Down + closing
- —
- Monthly P&I
- —
- Monthly cashflow
- —
- DSCR
- —
- Eligible?
- —
Personal DTI + credit; lowest rate.
DSCR
20% down · 8.5% · 30yr
- Down + closing
- —
- Monthly P&I
- —
- Monthly cashflow
- —
- DSCR
- —
- Eligible?
- —
No personal income docs; deal must DSCR.
Hard money
10% down · 12.0% · 12mo
- Down + closing
- —
- Monthly P&I
- —
- Monthly cashflow
- —
- DSCR
- —
- Eligible?
- —
Short-term bridge; refi at stabilization.
Rent comps 10 comps
| Address | Beds | Baths | Sqft | Rent | $/sqft | DOM | Units | Dist |
|---|---|---|---|---|---|---|---|---|
| 5700 Highlands Plaza Dr Saint Louis, MO | 3.0 | 1.0–2.0 | 1029 | $4,100 | $3.98 | 1d | 24 | 0.75mi |
| 4370 Swan Ave Unit B St. Louis, MO | 3.0 | 1.0 | 900 | $1,500 | $1.67 | 43d | 1 | 0.89mi |
| 3132 Park Hampton Ct Saint Louis, MO | 3.0 | 2.5 | 1106 | $2,100 | $1.90 | 43d | 1 | 1.19mi |
| 6225 Marmaduke Ave Saint Louis, MO | 3.0 | 2.0 | 1008 | $2,179 | $2.16 | 4d | 1 | 1.25mi |
| 3227 Jasper Park Saint Louis, MO | 3.0 | 1.0 | 972 | $1,695 | $1.74 | 17d | 1 | 1.32mi |
| 925 S Sarah St Unit 1031865P St. Louis, MO | 4.0 | 2.0 | 796 | $5,889 | $7.40 | 43d | 1 | 1.43mi |
| 4041 Chouteau Ave St. Louis, MO | 3.0 | 1.0–2.0 | 990 | $3,095 | $3.12 | 14d | 53 | 1.48mi |
| 4041 Chouteau Ave St. Louis, MO | 3.0 | 1.0–2.0 | 990 | $3,298 | $3.33 | 1d | 39 | 1.48mi |
| 18 S Kingshighway Blvd Saint Louis, MO | 4.0 | 1.0–2.0 | 730 | $2,535 | $3.47 | 43d | 42 | 1.48mi |
| 18 S Kingshighway Blvd Saint Louis, MO | 3.0 | 1.0–2.0 | 780 | $2,570 | $3.29 | 2d | 52 | 1.48mi |
Listing history 4 events
-
2026-05-12status Pending 865-char remark
Show marketing remark (865 chars)
Historic raised 2-story renovation opportunity on The Hill with approx 1900 SQ FT, 4 bedrooms and 2 baths. Corner location, predominant brick exterior with fenced front yard, GARAGE addition. Staircase up to bright living room. Newer STAINLESS STEEL kitchen gas range and dishwasher. Huge 22-FT REC ROOM over garage. Formal dining, family room, full bath with tub/shower combo, and 3-season SUNROOM with sliding door to FENCED PATIO. Bedrooms upstairs with views of city lights, plus hall bath with shower. Vinyl tilt-in INSULATED WINDOWS and newer DUAL HVAC systems. Short walk to award-winning RESTAURANTS! Close to world-class 1370-acre FOREST PARK (nature reserve, lakes, boating, museums, zoo, science center, theater, sports, 2 golf courses and more), near Highways 44/100/64 and popular St Louis attractions. Property to be conveyed in its current condition.
-
2026-04-24price $175,000 865-char remark
Show marketing remark (865 chars)
Historic raised 2-story renovation opportunity on The Hill with approx 1900 SQ FT, 4 bedrooms and 2 baths. Corner location, predominant brick exterior with fenced front yard, GARAGE addition. Staircase up to bright living room. Newer STAINLESS STEEL kitchen gas range and dishwasher. Huge 22-FT REC ROOM over garage. Formal dining, family room, full bath with tub/shower combo, and 3-season SUNROOM with sliding door to FENCED PATIO. Bedrooms upstairs with views of city lights, plus hall bath with shower. Vinyl tilt-in INSULATED WINDOWS and newer DUAL HVAC systems. Short walk to award-winning RESTAURANTS! Close to world-class 1370-acre FOREST PARK (nature reserve, lakes, boating, museums, zoo, science center, theater, sports, 2 golf courses and more), near Highways 44/100/64 and popular St Louis attractions. Property to be conveyed in its current condition.
-
2026-04-16$185,000 Active 865-char remark
Show marketing remark (865 chars)
Historic raised 2-story renovation opportunity on The Hill with approx 1900 SQ FT, 4 bedrooms and 2 baths. Corner location, predominant brick exterior with fenced front yard, GARAGE addition. Staircase up to bright living room. Newer STAINLESS STEEL kitchen gas range and dishwasher. Huge 22-FT REC ROOM over garage. Formal dining, family room, full bath with tub/shower combo, and 3-season SUNROOM with sliding door to FENCED PATIO. Bedrooms upstairs with views of city lights, plus hall bath with shower. Vinyl tilt-in INSULATED WINDOWS and newer DUAL HVAC systems. Short walk to award-winning RESTAURANTS! Close to world-class 1370-acre FOREST PARK (nature reserve, lakes, boating, museums, zoo, science center, theater, sports, 2 golf courses and more), near Highways 44/100/64 and popular St Louis attractions. Property to be conveyed in its current condition.
-
2026-04-14historical $185,000 865-char remark
Show marketing remark (865 chars)
Historic raised 2-story renovation opportunity on The Hill with approx 1900 SQ FT, 4 bedrooms and 2 baths. Corner location, predominant brick exterior with fenced front yard, GARAGE addition. Staircase up to bright living room. Newer STAINLESS STEEL kitchen gas range and dishwasher. Huge 22-FT REC ROOM over garage. Formal dining, family room, full bath with tub/shower combo, and 3-season SUNROOM with sliding door to FENCED PATIO. Bedrooms upstairs with views of city lights, plus hall bath with shower. Vinyl tilt-in INSULATED WINDOWS and newer DUAL HVAC systems. Short walk to award-winning RESTAURANTS! Close to world-class 1370-acre FOREST PARK (nature reserve, lakes, boating, museums, zoo, science center, theater, sports, 2 golf courses and more), near Highways 44/100/64 and popular St Louis attractions. Property to be conveyed in its current condition.
ⓘ Source: listings_history table (triggers on properties + properties_extension) + one-shot
backfill from property_details.listing_events for pre-trigger history.
Tax reassessment forecast MO · Resets to sale price
- Current annual tax
- $1,964 · $164/mo
- Projected year-2 tax
- $1,964 · $164/mo
- Expected delta
- $0/yr ($0/mo · 0.0%)
ⓘ Screening estimate from a state-policy table — verify with the county assessor before closing.
Climate risk First Street
- Flood 1/10 Low FEMA zone X (unshaded) · 0% chance over 30 yrs
- Wildfire 1/10 Low
- Heat 5/10 Major 7 d/yr ≥107°F today · 21 d/yr by 30 yrs out
- Wind 2/10 Low 100% chance of damaging wind over 30 yrs
- Air quality 3/10 Moderate 3 unhealthy d/yr today · 4 by 30 yrs out
Nearby sold comps map
Loading sold comps map…
Walkable amenities ~0.75 mi
Loading nearby amenities…
Taxation est. · year 1
- Rental income
- $29,909
- − Mortgage interest
- −$9,803
- − Property taxes
- −$1,964
- − Insurance
- −$875
- − Repairs & maintenance
- −$2,393
- − Management
- −$2,393
- − Depreciation
- −$5,091
- Taxable income
- $7,391
- Est. tax owed @ 24.0%
- −$1,774
- After-tax cash flow
- $8,003/yr
For passive investors: Depreciation is non-cash, so a rental often shows a tax loss while cash-flowing — sheltering income. Rental losses are passive: they offset passive income freely, and up to $25,000/yr can offset ordinary (W-2) income if you actively participate and your MAGI is under $100k (phasing out to $0 by $150k); unused losses carry forward. On sale, claimed depreciation is recaptured at up to 25%, and gains may owe capital-gains tax (a 1031 exchange can defer both). Figures are a year-1 estimate at your 24.0% rate — not tax advice; consult a CPA.
Schools (NCES district)
- District
- St. Louis City
- NCES district ID
- 2929280
- Math proficiency
- 10% ▼ -6.00%
- Reading proficiency
- 18% ▼ -3.00%
- Median HH income
- $35,685
- Composite
- 11.54/100
- National rank
- #9699
- State rank
- #312 of 324 in MO
Livability — St. Louis
No livability data for this city. (Only ~50 U.S. cities are tracked.)
Census & demographics
- Census place
- St. Louis, MO
- County
- Saint Louis City · 254,015 people
- City population
- 283,259
- Metro
- St. Louis, MO-IL
- Population (ZIP)
- 17,645
- Household income
- $81,655
- Rent vs Own
- Severe rent burden
- 921.0
Population outlook (St. Louis County) Hauer SSP2
- Today (2025)
- 315,737 people
- By 2030
- 313,865 · -0.6%
- By 2040
- 305,439 · -3.3%
- By 2050
- 296,529 · -6.1%
- By 2075
- 271,028 · -14.2%
- By 2100
- 255,359 · -19.1%
Race, ethnicity, and origin ACS 2023
- Neighborhood character
- Majority White (65%)
- Race & ethnicity
- White 65% Black 19% Two or more races 9% Hispanic / Latino 8% Asian 4%
- Hispanic origin (detail)
- Mexican 5%
- Common ancestry
- Lithuanian 5% Slovak 3% Italian 3%
- Foreign-born
- 6% · Canada, China, South Korea
- Languages at home
- 91% English-only · Spanish 3% French/Haitian/Cajun 1% Other Asian/Pacific 1%
Political lean MEDSL · St. Louis
- 2024 margin
- Solid D (+64.7) · D 81.4% · R 16.7% · Other 2.0%
- 2008→2024 swing
- -3.5pp toward R · 2008: 68.2pp · 2024: 64.7pp
- All cycles
- 2024: D+64.7 2020: D+66.2 2016: D+63.7 2012: D+66.6 2008: D+68.2
Not yet ingested
- Civics
- —
Market trends
- HPI YoY
- ▼ -206.93%
- Current HPI
- 342.2466
- Rent YoY
- ▲ 6.24%
- Metro
- St. Louis, MO-IL
- State GDP YoY
- ▲ 1.84%
- F500 in state
- 20
Industry mix (Fortune 500 HQ in MO)
| Industry | F500 HQs | Revenue |
|---|---|---|
| Healthcare | 1 | $163B |
|
||
| Insurance | 1 | $21B |
|
||
| Industrial Technology | 1 | $17B |
|
||
| Retail | 1 | $16B |
|
||
| Industrial Distribution | 1 | $10B |
|
||
| Utilities | 1 | $9B |
|
||
Price history
-5.4% since first listed4 events — show timeline
- 2026-05-12 Pending — MARIS as Distributed by MLS Grid
- 2026-04-24 Price Changed $175,000 MARIS as Distributed by MLS Grid
- 2026-04-16 Listed $185,000 MARIS as Distributed by MLS Grid
- 2026-04-14 Coming Soon $185,000 MARIS as Distributed by MLS Grid
Property tax history
+3.2%/yrLatest (2024): $1,964 · +5.1% YoY. Source: county tax records.
Cash-flow waterfall
monthlySold comps — $/sqft
last 12 mo · ≤1 miLoading sold comps…