 Multi-family
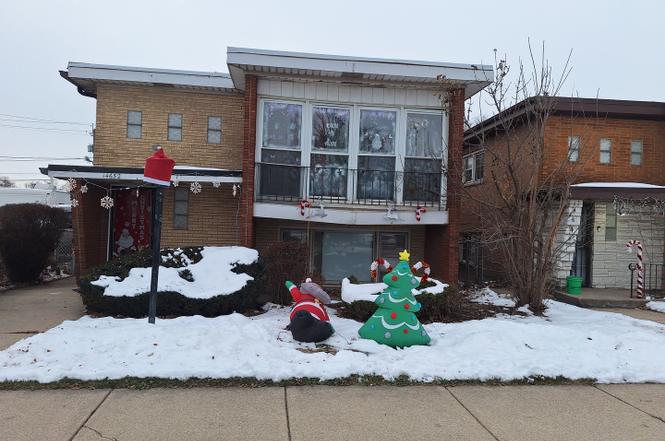
14652 Spaulding Ave · Harvey, IL
Flood risk 4/10 · Minor
- FEMA flood zone
- AH
- Chance of flooding over 30 yrs
- 0.22%
- Est. flood insurance / yr
- $810 – $3,808
Fire risk 1/10 · Minimal
- Est. fire insurance / yr
- $804 – $1,492
Heat risk 3/10 · Minor
- Hot days now (above 102°F)
- 7 days/yr
- Hot days in 30 yrs
- 15 days/yr
Wind risk 2/10 · Minimal
- Chance of severe wind over 30 yrs
- —
Air-quality risk 3/10 · Minor
- Unhealthy air days now
- 4 days/yr
- Unhealthy air days in 30 yrs
- 4 days/yr
Risk factors via First Street. Map © Google.
Why this score? — see what drove the B+ grade
The composite is a weighted blend of 9 inputs, each scored 0–100. Each bar is that input's sub-score; the figure is the points it added to the 100-point composite (weight × sub-score).
- Cash flow +30.0/30.0
- 1% rule +10.0/10.0
- DSCR +10.0/10.0
- Appreciation +10.0/10.0
- ARV discount +7.5/15.0
- Livability +3.4/5.0
- Rent growth +2.5/5.0
- Condition / age +2.5/5.0
- Schools +0.7/10.0
$150,000
🖨 Deal sheet (PDF) 📄 Offer letter ✓ Due diligence
Multi-family units
County records classify this as Multi-Family (2-4 Unit). Listing-text estimate: 1 unit. estimate disagrees with records
Listing remarks MLS
Updated well maintained 2 Flat. Building is already making money! 2 units both recently Updated/Remodeled. New Floors, newer Windows, Doors and heating. Solid Brick building with a detached 2 Car Garage. Owner successfully appealed taxes in 2018!
Key facts
- Close to parks
- Close to schools
- Off street parking
Tags
Property features AI
Finance
- Other: Property holds earnest money; Possession at closing
- Financial info: Special service area: No
Exterior
- Parking: Detached garage; 2 garage spaces (2 parking spaces total)
- Utilities: Water source: Lake Michigan; Public sewer
- Home design: Two-to-four unit property; Fee simple ownership; Built approx. 61–70 years ago; Property built before 1978; Brick construction
- Construction: Brick exterior
- Exterior features: Lot dimensions roughly 35 x 125; Lot around 0.25–0.49 acre; Located in Harvey (Bremen Township)
Interior
- Kitchen: Stove; Refrigerator
- Bedrooms: Five bedrooms total (Unit 1: 2 bedrooms on 1st floor; Unit 2: 3 bedrooms on 2nd floor)
- Bathrooms: Two full bathrooms total (each unit has 1 full bath)
- Heating & cooling: Steam heating; Baseboard heating
- Interior features: 8 total rooms; Two-unit building (2 units total)
- Laundry & utility: Washer and dryer included in Unit 1; Tenants pay electric and water
Neighborhood map
What this means for you Summary
Snapshot
- This is a 4-bed/2.0-bath multifamily listed at $150k.
Deal economics
- At list price, monthly cash flow is $1k ($15k/yr) — positive.
- The deal already cash-flows at list — no discount required.
- Meets the 1% rule at list price ($3k rent vs $150k).
- Recommended offer: $132k (12.0% below list) — sets the bar for market timing.
- Cap rate 18.0% vs local median 9.3% in Harvey — top-decile yield for the area; either an underpriced asset or a hidden risk that comps aren't pricing in. Stress-test before assuming the spread holds.
Location & tenants
- Location reads 67/100 on livability (#539 in IL) — a middle-class / working-renter tenant base. Strengths: commute A+, cost of living A+, housing A-; Watch: health & safety D+, crime F, amenities F.
- Thornton Twp Hsd 205 (suburban): math 7% / reading 8% proficiency, ranked #594 of 620 in IL (top 96%) — low school quality limits family demand, transient renter base, plan for 1-2y turnover.
- Zoned schools: Martin L King Elem School (303 students, 0% FRL); Rosa L Parks Middle School (319 students, 0% FRL); Thornton Township High School (math 7% / reading 7%, grade F, #605 of 693 statewide, top 87%, 1,628 students, 0% FRL).
- Market conditions: 133 active listings in the ZIP; 1 comparable units currently listed for rent nearby; 6,272 units permitted in Cook County in 2024 (4,658 in 5+ unit buildings).
Forward outlook
- In year one you build about $16k of equity ($1k loan paydown + $15k appreciation (10.0% local appreciation)).
- At projected returns (10.0% appreciation + 3.0% rent growth), your $42k cash investment doubles in ~2 years — after that, you're playing with house money.
- By year 3, paydown + projected appreciation supports a ~$41k cash-out refi (75% LTV) — recoverable capital for the next deal without selling this one.
Negotiation context
- It's been on market 188 days — a 12% lower offer ($132k) is reasonable based on typical stale-listing flexibility.
- 12 sale attempts since 9y ago; this cycle's ask has dropped $25k (14%) from the opening price — seller is motivated, your offer sets the floor, not the list.
- Current owner paid $83k; list at $150k implies a 81% gain — meaningful room to come down on a strong offer.
Risks & watch-outs
- Watch-outs: flood insurance adds $192/mo.
- Climate carrying-cost: in FEMA flood zone AH (mandatory federal flood insurance) — expect insurance premiums to compound above CPI over the hold.
Questions for the listing agent
- It's been on market 188 days. Have you received any prior offers? Is the seller open to a 12% concession, seller financing, or rate buy-down credit?
- Built in 1965 — when were the roof, HVAC, electrical panel, plumbing, and water heater last replaced?
- What's the actual annual flood-insurance premium (NFIP or private), and is the property in a SFHA with mandatory coverage?
- Why hasn't it sold? Are there any deal-killer items the seller is aware of (foundation, flood, title, zoning, code violations)?
- Is there a deadline driving the sale (1031 exchange, divorce, estate, relocation)? That informs how much negotiation room exists.
- Schools are F-rated, which usually means shorter tenancies and higher turnover. Who's the typical renter profile here, and what's been the actual vacancy rate?
- Crime grade is F in this area — have there been break-ins, vandalism, or insurance claims at this property in the last 3 years? What carrier currently insures it and at what premium?
- What's the average days-on-market for RENTAL listings here right now (not sales)? A rising rental-DOM trend means longer vacancies and softer asking-rent achievability than the comps imply.
- What's the recent tenant-quality profile in this submarket — average credit score on applications, eviction rate, late-payment / NSF rate, and stable-employment percentage? A property-management company in the area should have these aggregated.
- How much new apartment / multifamily construction is in the pipeline within 1–3 miles? Heavy new supply (>2% of stock underway) typically softens rents 12–24 months out; light construction supports rent growth.
Investment metrics
- 1% rule
- 2.11% ✓
- Cap rate
- 18.00%
- Cash-on-cash
- 41.82%
- DSCR
- 2.86
- GRM
- 3.9
CMA / ARV
No comps found within radius.
Projected returns pro-forma
10.0% appreciation · 3.0% rent growth · sell at horizon
- IRR
- 52.2%
- Equity multiple
- 4.88×
- Total profit
- $162,831
- Equity at exit
- $135,132
- IRR
- 45.9%
- Equity multiple
- 10.91×
- Total profit
- $416,165
- Equity at exit
- $291,417
Cash invested: $42,000 (down + closing). Projections, not guarantees.
Landlord ↔ Tenant lean methodology
- Overall (STATE)
- 43 Moderately Tenant-Leaning
- State Illinois
- 43 Moderately Tenant-Leaning · D+7
- County
- — inherits STATE
- City
- — inherits STATE
ZIP-level market 60426
- Home prices YoY
- 6.9%
- Active inventory
- 133
- Price-to-rent
- 7.9×
Monthly cashflow live
- Estimated rent
- $3,165 medium interval (Pro) →
- Mortgage (P&I)
- −$787
- Tax est. 1.5%
- −$188 /mo · $2,250/yr
- Insurance
- −$62
- Flood insurance flood zone
- −$192 /mo · $2,309/yr
- HOA
- −$0
- Vacancy / Maint / Mgmt
- −$665
- Net cashflow
- $1,271
Break-even live
Sensitivity live
| Price | -10% $1,375 | -5% $1,323 | +0% $1,271 | +5% $1,219 | +10% $1,168 |
|---|---|---|---|---|---|
| Rent | -10% $1,021 | -5% $1,146 | +0% $1,271 | +5% $1,396 | +10% $1,521 |
| Rate | -1.0pp $1,347 | -0.5pp $1,309 | base $1,271 | +0.5pp $1,232 | +1.0pp $1,193 |
2-unit breakdown (identical units grouped — click to expand)
| Units | Beds | Baths | Est. rent |
|---|---|---|---|
| 1× unit | 2 | 1 | $1,582 |
| 1× unit | 3 | 1 | $1,582 |
| Total (2 units) | $3,165 | ||
UW: 25.0% down · 7.5% · 30yr · 1.5% tax · 5.0% vac · 8.0% maint · 8.0% mgmt
Financing live
Cash to close
- Down payment
- $37,500
- Closing costs
- $4,500
- Reserves months
- —
- Total cash needed
- —
Loan-product check · same deal, 3 products live
Conventional
25% down · 7.5% · 30yr
- Down + closing
- —
- Monthly P&I
- —
- Monthly cashflow
- —
- DSCR
- —
- Eligible?
- —
Personal DTI + credit; lowest rate.
DSCR
20% down · 8.5% · 30yr
- Down + closing
- —
- Monthly P&I
- —
- Monthly cashflow
- —
- DSCR
- —
- Eligible?
- —
No personal income docs; deal must DSCR.
Hard money
10% down · 12.0% · 12mo
- Down + closing
- —
- Monthly P&I
- —
- Monthly cashflow
- —
- DSCR
- —
- Eligible?
- —
Short-term bridge; refi at stabilization.
Rent comps 1 comps
| Address | Beds | Baths | Sqft | Rent | $/sqft | DOM | Units | Dist |
|---|---|---|---|---|---|---|---|---|
| 14336 S Harrison Ave Posen, IL | 4.0 | 3.0 | 1707 | $2,600 | $1.52 | 3d | 1 | 1.48mi |
Listing history 50 events
-
2026-06-21days on market $150,000 Active 188 DOM
-
2026-06-18days on market $150,000 Active 185 DOM
-
2026-06-17days on market $150,000 Active 184 DOM
-
2026-06-16days on market $150,000 Active 183 DOM
-
2026-06-15days on market $150,000 Active 182 DOM
-
2026-06-13days on market $150,000 Active 180 DOM
-
2026-06-13days on market $150,000 Active 179 DOM
-
2026-06-09days on market $150,000 Active 176 DOM
-
2026-06-08days on market $150,000 Active 175 DOM
-
2026-06-07days on market $150,000 Active 174 DOM
-
2026-06-04days on market $150,000 Active 171 DOM
-
2026-06-03days on market $150,000 Active 170 DOM
-
2026-06-02days on market $150,000 Active 169 DOM
-
2026-06-01days on market $150,000 Active 168 DOM
-
2026-05-31days on market $150,000 Active 167 DOM
-
2026-04-08price $150,000
-
2026-03-02price $155,000
-
2026-02-10price $160,000
-
2026-01-12price $165,000
-
2025-12-29price $170,000
-
2025-12-15$175,000 Active
-
2020-10-29soldstatus $83,000
-
2020-09-22soldstatus $83,000 Closed Sale 246-char remark
Show marketing remark (246 chars)
Updated well maintained 2 Flat. Building is already making money! 2 units both recently Updated/Remodeled. New Floors, newer Windows, Doors and heating. Solid Brick building with a detached 2 Car Garage. Owner successfully appealed taxes in 2018!
-
2020-09-08status Contingent 246-char remark
Show marketing remark (246 chars)
Updated well maintained 2 Flat. Building is already making money! 2 units both recently Updated/Remodeled. New Floors, newer Windows, Doors and heating. Solid Brick building with a detached 2 Car Garage. Owner successfully appealed taxes in 2018!
-
2020-09-08status Reactivated 246-char remark
Show marketing remark (246 chars)
Updated well maintained 2 Flat. Building is already making money! 2 units both recently Updated/Remodeled. New Floors, newer Windows, Doors and heating. Solid Brick building with a detached 2 Car Garage. Owner successfully appealed taxes in 2018!
-
2020-08-11status Contingent 246-char remark
Show marketing remark (246 chars)
Updated well maintained 2 Flat. Building is already making money! 2 units both recently Updated/Remodeled. New Floors, newer Windows, Doors and heating. Solid Brick building with a detached 2 Car Garage. Owner successfully appealed taxes in 2018!
-
2020-08-07historical 246-char remark
Show marketing remark (246 chars)
Updated well maintained 2 Flat. Building is already making money! 2 units both recently Updated/Remodeled. New Floors, newer Windows, Doors and heating. Solid Brick building with a detached 2 Car Garage. Owner successfully appealed taxes in 2018!
-
2020-06-27price $85,000 246-char remark
Show marketing remark (246 chars)
Updated well maintained 2 Flat. Building is already making money! 2 units both recently Updated/Remodeled. New Floors, newer Windows, Doors and heating. Solid Brick building with a detached 2 Car Garage. Owner successfully appealed taxes in 2018!
-
2020-06-05$87,000 New 246-char remark
Show marketing remark (246 chars)
Updated well maintained 2 Flat. Building is already making money! 2 units both recently Updated/Remodeled. New Floors, newer Windows, Doors and heating. Solid Brick building with a detached 2 Car Garage. Owner successfully appealed taxes in 2018!
-
2020-04-02historical
-
2020-03-13New
-
2019-11-29historical
-
2019-11-05status Reactivated
-
2019-10-16historical Contingent (Do Not Show)
-
2019-10-03New
-
2019-09-13historical
-
2019-07-31price
-
2019-06-29status Reactivated
-
2019-06-29historical
-
2019-06-28Reactivated
-
2017-09-20soldstatus $27,600 Closed Sale
-
2017-07-18status Pending
-
2017-06-27price $29,900
-
2017-06-26status Price Change
-
2017-06-05status Pending
-
2017-05-26price $34,900
-
2017-05-16status Reactivated
-
2017-03-31status Pending
-
2017-03-28status Reactivated
-
2017-03-22status Pending
ⓘ Source: listings_history table (triggers on properties + properties_extension) + one-shot
backfill from property_details.listing_events for pre-trigger history.
Climate risk First Street
- Flood 4/10 Moderate FEMA zone AH · 22% chance over 30 yrs
- Wildfire 1/10 Low
- Heat 3/10 Moderate 7 d/yr ≥102°F today · 15 d/yr by 30 yrs out
- Wind 2/10 Low
- Air quality 3/10 Moderate 4 unhealthy d/yr today · 4 by 30 yrs out
Nearby sold comps map
Loading sold comps map…
Walkable amenities ~0.75 mi
Loading nearby amenities…
Taxation est. · year 1
- Rental income
- $37,980
- − Mortgage interest
- −$8,402
- − Property taxes
- −$2,250
- − Insurance
- −$3,059
- − Repairs & maintenance
- −$3,038
- − Management
- −$3,038
- − Depreciation
- −$4,364
- Taxable income
- $13,828
- Est. tax owed @ 24.0%
- −$3,319
- After-tax cash flow
- $11,937/yr
For passive investors: Depreciation is non-cash, so a rental often shows a tax loss while cash-flowing — sheltering income. Rental losses are passive: they offset passive income freely, and up to $25,000/yr can offset ordinary (W-2) income if you actively participate and your MAGI is under $100k (phasing out to $0 by $150k); unused losses carry forward. On sale, claimed depreciation is recaptured at up to 25%, and gains may owe capital-gains tax (a 1031 exchange can defer both). Figures are a year-1 estimate at your 24.0% rate — not tax advice; consult a CPA.
Schools (NCES district)
- District
- Thornton Twp Hsd 205
- NCES district ID
- 1738970
- Math proficiency
- 7% ▬ 0.00%
- Reading proficiency
- 8% ▼ -2.00%
- Median HH income
- $43,392
- Composite
- 6.92/100
- National rank
- #9976
- State rank
- #594 of 620 in IL
Livability — Harvey
- Score
- 67/100
- State rank
- #539
- US rank
- #11162
Category grades
Schools grade is shown separately in the Schools card above.
Census & demographics
- Census place
- Harvey, IL
- City population
- 23,066
- Population (ZIP)
- 23,066
Population outlook (Cook County) Hauer SSP2
- Today (2025)
- 5,347,519 people
- By 2030
- 5,357,703 · +0.2%
- By 2040
- 5,324,924 · -0.4%
- By 2050
- 5,230,762 · -2.2%
- By 2075
- 4,785,735 · -10.5%
- By 2100
- 4,188,836 · -21.7%
Race, ethnicity, and origin ACS 2023
- Neighborhood character
- Majority Black (59%)
- Race & ethnicity
- Black 59% Hispanic / Latino 33% Two or more races 12% White 3% Asian 2%
- Hispanic origin (detail)
- Mexican 31%
- Foreign-born
- 17% · Canada
- Languages at home
- 67% English-only · Spanish 30% Other Indo-European 2% French/Haitian/Cajun 1%
Political lean MEDSL · Cook
- 2024 margin
- Solid D (+42.0) · D 70.4% · R 28.4% · Other 1.2%
- 2008→2024 swing
- -11.4pp toward R · 2008: 53.4pp · 2024: 42.0pp
- All cycles
- 2024: D+42.0 2020: D+50.3 2016: D+53.0 2012: D+49.4 2008: D+53.4
Not yet ingested
- Civics
- —
Market trends
- HPI YoY
- ▲ 20.36%
- Current HPI
- 313.7895
- Rent YoY
- —
- Metro
- —
- State GDP YoY
- ▲ 1.59%
- F500 in state
- 60
Industry mix (Fortune 500 HQ in IL)
| Industry | F500 HQs | Revenue |
|---|---|---|
| Insurance | 4 | $201B |
|
||
| Consumer Goods | 4 | $87B |
|
||
| Industrial Machinery | 3 | $64B |
|
||
| Healthcare | 2 | $55B |
|
||
| Retail / Pharmacy | 1 | $148B |
|
||
| Agriculture / Food | 1 | $86B |
|
||
Price history
+284.6% since first listed36 events — show timeline
- 2026-04-08 Price Changed $150,000 MRED as Distributed by MLS Grid
- 2026-03-02 Price Changed $155,000 MRED as Distributed by MLS Grid
- 2026-02-10 Price Changed $160,000 MRED as Distributed by MLS Grid
- 2026-01-12 Price Changed $165,000 MRED as Distributed by MLS Grid
- 2025-12-29 Price Changed $170,000 MRED as Distributed by MLS Grid
- 2025-12-15 Listed $175,000 MRED as Distributed by MLS Grid
- 2020-10-29 Sold (Public Records) $83,000 Public Records
- 2020-09-22 Sold (MLS) $83,000 MRED as Distributed by MLS Grid
- 2020-09-08 Pending — MRED as Distributed by MLS Grid
- 2020-09-08 Relisted — MRED as Distributed by MLS Grid
- 2020-08-11 Pending — MRED as Distributed by MLS Grid
- 2020-08-07 Listing Removed — MRED as Distributed by MLS Grid
- 2020-06-27 Price Changed $85,000 MRED as Distributed by MLS Grid
- 2020-06-05 Listed $87,000 MRED as Distributed by MLS Grid
- 2020-04-02 Listing Removed — MRED as Distributed by MLS Grid
- 2020-03-13 Listed — MRED as Distributed by MLS Grid
- 2019-11-29 Listing Removed — MRED as Distributed by MLS Grid
- 2019-11-05 Relisted — MRED as Distributed by MLS Grid
- 2019-10-16 Contingent — MRED as Distributed by MLS Grid
- 2019-10-03 Listed — MRED as Distributed by MLS Grid
- 2019-09-13 Listing Removed — MRED as Distributed by MLS Grid
- 2019-07-31 Price Changed — MRED as Distributed by MLS Grid
- 2019-06-29 Relisted — MRED as Distributed by MLS Grid
- 2019-06-29 Listing Removed — MRED as Distributed by MLS Grid
- 2019-06-28 Listed — MRED as Distributed by MLS Grid
- 2017-09-20 Sold (MLS) $27,600 MRED as Distributed by MLS Grid
- 2017-07-18 Pending — MRED as Distributed by MLS Grid
- 2017-06-27 Price Changed $29,900 MRED as Distributed by MLS Grid
- 2017-06-26 Relisted — MRED as Distributed by MLS Grid
- 2017-06-05 Pending — MRED as Distributed by MLS Grid
- 2017-05-26 Price Changed $34,900 MRED as Distributed by MLS Grid
- 2017-05-16 Relisted — MRED as Distributed by MLS Grid
- 2017-03-31 Pending — MRED as Distributed by MLS Grid
- 2017-03-28 Relisted — MRED as Distributed by MLS Grid
- 2017-03-22 Pending — MRED as Distributed by MLS Grid
- 2017-02-25 Listed $39,000 MRED as Distributed by MLS Grid
Property tax history
+6.0%/yrLatest (2023): $10,641 · +6.6% YoY. Source: county tax records.
Cash-flow waterfall
monthlySold comps — $/sqft
last 12 mo · ≤1 miLoading sold comps…