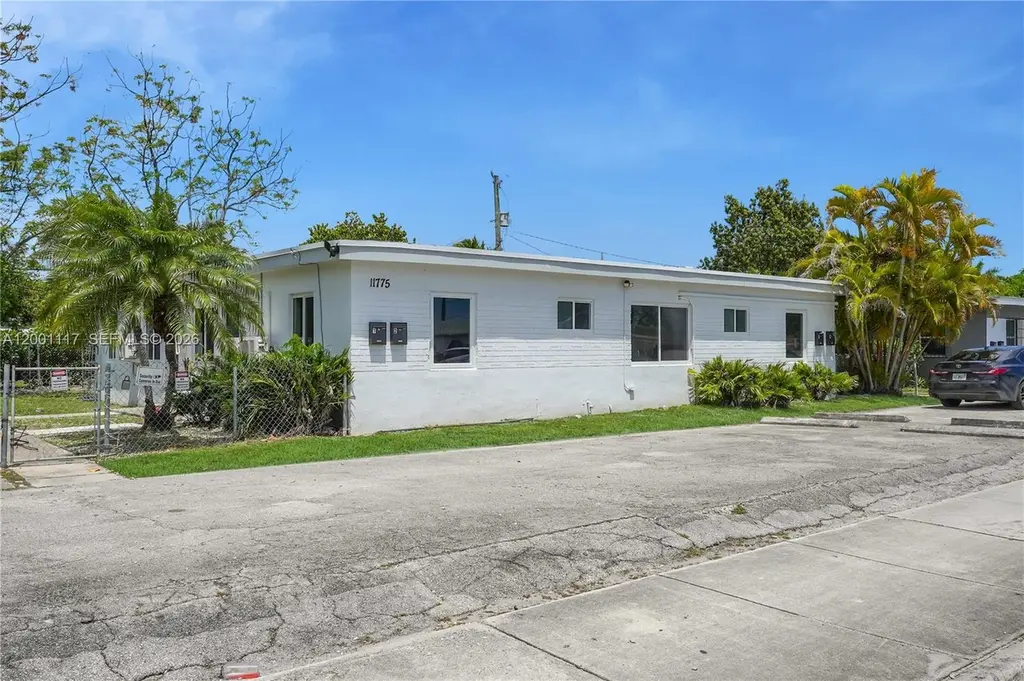
 Fourplex
11775 SW 223rd St · Goulds, FL
Flood risk 5/10 · Moderate
- FEMA flood zone
- X (unshaded)
- Chance of flooding over 30 yrs
- 0.24%
- Est. flood insurance / yr
- $507 – $1,088
Fire risk 1/10 · Minimal
- Est. fire insurance / yr
- $947 – $1,759
Heat risk 10/10 · Severe
- Hot days now (above 104°F)
- 7 days/yr
- Hot days in 30 yrs
- 31 days/yr
Wind risk 10/10 · Severe
- Chance of severe wind over 30 yrs
- 99.0%
Air-quality risk 2/10 · Minimal
- Unhealthy air days now
- 1 days/yr
- Unhealthy air days in 30 yrs
- 1 days/yr
Risk factors via First Street. Map © Google.
Why this score? — see what drove the B- grade
The composite is a weighted blend of 9 inputs, each scored 0–100. Each bar is that input's sub-score; the figure is the points it added to the 100-point composite (weight × sub-score).
- Cash flow +30.0/30.0
- DSCR +10.0/10.0
- 1% rule +9.2/10.0
- ARV discount +7.5/15.0
- Schools +4.2/10.0
- Livability +3.5/5.0
- Rent growth +2.5/5.0
- Condition / age +2.5/5.0
- Appreciation +0.0/10.0
$985,000
🖨 Deal sheet 📄 Offer letter ✓ Due diligence
Multi-family units
County records classify this as Multi-Family (2-4 Unit). Listing-text estimate: 4 units. confirmed
Listing remarks
This fully renovated fourplex in Miami presents a turnkey investment opportunity with major capital improvements already completed. The entire building and all units have been completely renovated, offering modern finishes and minimizing future maintenance costs. The property features 4 parking spaces, a permitted new roof and permitted impact windows, providing both peace of mind and insurance advantages. All major systems have been upgraded, including new electrical and plumbing, ensuring long-term efficiency and reliability. Each unit has been thoughtfully updated with tile flooring throughout, brand-new kitchens with stainless steel appliances, and fully renovated bathrooms. Additionall
Key facts
- Upgraded plumbing
- Renovated fourplex
- Upgraded electrical
Tags
Property features AI
Finance
- Other: Rent includes gardener, sewer, and trash collection
- Financial info: Total actual rent: $91,200; Operating expenses: $15,608; Unit rents: two 1-bedroom units at $1,200 each, four 2-bedroom units at $1,800 each (unit counts and rents per unit type reflected); Some units are leased; at least one unit is month-to-month
Exterior
- Parking: Open parking for tenants; Total of 4 parking spaces
- Security: Security/high-impact doors
- Utilities: Public water; Septic tank sewer; Cable not available
- Home design: Single-story building; Shingle roof; Block construction; Resale property
- Construction: Block construction; Shingle roof
- Exterior features: Patio; Security/high-impact doors; Rectangular lot; Less than quarter acre
Interior
- Kitchen: Microwave; Range; Refrigerator
- Bedrooms: Four 2-bedroom units; Three units with 2 bedrooms (leased); One 2-bedroom unit (leased); Two 1-bedroom units (one is month-to-month, one month-to-month/Yes indicated)
- Flooring: Tile flooring
- Bathrooms: All units have 1 full bathroom
- Heating & cooling: Electric heating; Wall/window cooling units
- Interior features: Impact glass windows; Patio
- Laundry & utility: Washer in each unit; Electric meter for units; Smoke detector in each unit
Neighborhood map
What this means for you Summary
Snapshot
- This is a 4 × 4-bed/2.5-bath units multifamily listed at $985k.
Deal economics
- At list price, monthly cash flow is $5k ($56k/yr) — positive. Per door: $1k/mo.
- The deal already cash-flows at list — no discount required.
- Meets the 1% rule at list price ($14k rent vs $985k).
- Recommended offer: $926k (6.0% below list) — sets the bar for market timing.
Location & tenants
- Location reads 70/100 on livability (#431 in FL) — a middle-class / working-renter tenant base. Strengths: commute A+, health & safety B+, crime B; Watch: employment D, amenities F.
- Miami-Dade (suburban): math 45% / reading 54% proficiency, ranked #40 of 73 in FL (top 55%) — families likely to look elsewhere, expect single-tenant / working-renter base with shorter leases; 64% free/reduced lunch — lower-income household profile, screen leases tightly.
- Market conditions: 205 active listings in the ZIP; 11 comparable units currently listed for rent nearby; rentals at typical pace (median 18d on market — plan ~3-4 weeks tenant-placement turnaround); 10,051 units permitted in Miami-Dade County in 2024 (7,758 in 5+ unit buildings).
- At $14,029/mo this rent would consume 228% of the median local household income ($74k/yr) (locally 392% of renters already pay >50% of income on rent) — very limited rent-growth headroom before tenants either downsize or default.
Forward outlook
- Local home prices are declining (-3.0%/yr); year-one equity from $7k of loan paydown is wiped out by about $30k of value loss. Plan a longer hold.
- Miami-Dade County population projected at +28% by 2050 — long-run rental-demand tailwind backs the buy-and-hold thesis.
- At projected returns (-3.0% appreciation + 3.0% rent growth), your $276k cash investment doubles in ~6 years — after that, you're playing with house money.
Negotiation context
- It's been on market 63 days — a 6% lower offer ($926k) is reasonable based on typical stale-listing flexibility.
- 3 sale attempts since 12y ago with the ask held roughly flat each time — persistent listings suggest the price (not the market) is what's stuck; bring a comps-based counter.
- Current owner paid $670k; 47% above their basis — modest negotiation headroom, anchor on the comps not their cost.
Risks & watch-outs
- Watch-outs: built in 1957 — expect roof / HVAC / electrical / plumbing capex.
- Climate carrying-cost: moderate flood risk; severe wind risk, 99% chance of damaging wind over 30y; extreme-heat days projected 7→31/yr by 2055 (HVAC capex compounding) — expect insurance premiums to compound above CPI over the hold.
Questions for the listing agent
- It's been on market 63 days. Have you received any prior offers? Is the seller open to a 6% concession, seller financing, or rate buy-down credit?
- Can we see the unit-by-unit rent roll, current vacancy, and any below-market leases? What's the average tenancy length?
- What capital expenditures (roof, boiler, parking lot, exteriors) have been made in the last 5 years, and what's planned in the next 2?
- Built in 1957 — when were the roof, HVAC, electrical panel, plumbing, and water heater last replaced?
- Why hasn't it sold? Are there any deal-killer items the seller is aware of (foundation, flood, title, zoning, code violations)?
- Is there a deadline driving the sale (1031 exchange, divorce, estate, relocation)? That informs how much negotiation room exists.
- What's the average days-on-market for RENTAL listings here right now (not sales)? A rising rental-DOM trend means longer vacancies and softer asking-rent achievability than the comps imply.
- What's the recent tenant-quality profile in this submarket — average credit score on applications, eviction rate, late-payment / NSF rate, and stable-employment percentage? A property-management company in the area should have these aggregated.
- How much new apartment / multifamily construction is in the pipeline within 1–3 miles? Heavy new supply (>2% of stock underway) typically softens rents 12–24 months out; light construction supports rent growth.
Investment metrics
- 1% rule
- 1.42% ✓
- Cap rate
- 12.02%
- Cash-on-cash
- 20.44%
- DSCR
- 1.91
- GRM
- 5.9
CMA / ARV
No comps found within radius.
Projected returns pro-forma
-3.0% appreciation · 3.0% rent growth · sell at horizon
- IRR
- 12.7%
- Equity multiple
- 1.51×
- Total profit
- $139,512
- Equity at exit
- $146,867
- IRR
- 21.6%
- Equity multiple
- 2.84×
- Total profit
- $506,524
- Equity at exit
- $85,165
Cash invested: $275,800 (down + closing). Projections, not guarantees.
Landlord ↔ Tenant lean methodology
- Overall (STATE)
- 87 Strongly Landlord-Friendly
- State Florida
- 87 Strongly Landlord-Friendly · R+3
- County
- — inherits STATE
- City
- — inherits STATE
ZIP-level market 33170
- Home prices YoY
- -24.9%
- Active inventory
- 205
- Price-to-rent
- 23.4×
Monthly cashflow live
- Estimated rent
- $14,029 medium interval (Pro) →
- Mortgage (P&I)
- −$5,165
- Tax from tax record
- −$810 /mo · $9,717/yr
- Insurance
- −$410
- HOA
- −$0
- Vacancy / Maint / Mgmt
- −$2,946
- Net cashflow
- $4,697
Break-even live
4-unit breakdown (identical units grouped — click to expand)
| Units | Beds | Baths | Est. rent |
|---|---|---|---|
| 4× units | 4 | 2.5 | $14,028 |
| #1 | 4 | 2.5 | $3,507 |
| #2 | 4 | 2.5 | $3,507 |
| #3 | 4 | 2.5 | $3,507 |
| #4 | 4 | 2.5 | $3,507 |
| Total (4 units) | $14,029 | ||
UW: 25.0% down · 7.5% · 30yr · 1.5% tax · 5.0% vac · 8.0% maint · 8.0% mgmt
Financing live
Cash to close
- Down payment
- $246,250
- Closing costs
- $29,550
- Reserves months
- —
- Total cash needed
- —
Loan-product check · same deal, 3 products live
Conventional
25% down · 7.5% · 30yr
- Down + closing
- —
- Monthly P&I
- —
- Monthly cashflow
- —
- DSCR
- —
- Eligible?
- —
Personal DTI + credit; lowest rate.
DSCR
20% down · 8.5% · 30yr
- Down + closing
- —
- Monthly P&I
- —
- Monthly cashflow
- —
- DSCR
- —
- Eligible?
- —
No personal income docs; deal must DSCR.
Hard money
10% down · 12.0% · 12mo
- Down + closing
- —
- Monthly P&I
- —
- Monthly cashflow
- —
- DSCR
- —
- Eligible?
- —
Short-term bridge; refi at stabilization.
Rent comps 11 comps
| Address | Beds | Baths | Sqft | Rent | $/sqft | DOM | Units | Dist |
|---|---|---|---|---|---|---|---|---|
| 22105 SW 113th Pl Miami, FL | 5.0 | 2.0 | 1764 | $4,000 | $2.27 | 24d | 1 | 0.43mi |
| 23030 SW 114th Path Miami, FL | 5.0 | 4.0 | 2530 | $4,011 | $1.59 | 24d | 1 | 0.57mi |
| 22431 SW 125th Ave Unit 19B Goulds, FL | 5.0 | 3.0 | 2518 | $4,540 | $1.80 | 24d | 1 | 0.78mi |
| 22431 SW 125th Ave Unit 19A Goulds, FL | 5.0 | 3.0 | 2518 | $4,540 | $1.80 | 20d | 1 | 0.78mi |
| 11719 SW 241st St Homestead, FL | 5.0 | 3.0 | 2495 | $4,600 | $1.84 | 24d | 1 | 1.15mi |
| 11719 SW 241st St Homestead, FL | 5.0 | 3.0 | 2495 | $4,600 | $1.84 | 7d | 1 | 1.15mi |
| 11903 SW 241st St Unit 11903 Princeton, FL | 5.0 | 3.0 | 2640 | $4,500 | $1.70 | 17d | 1 | 1.16mi |
| 20301 SW 117th Ave Miami, FL | 5.0 | 2.0 | 2003 | $3,350 | $1.67 | 7d | 1 | 1.26mi |
| 24242 SW 119th Pl Homestead, FL | 5.0 | 3.0 | 2640 | $4,600 | $1.74 | 18d | 1 | 1.27mi |
| 22634 SW 131st Pl Unit 22634 Goulds, FL | 5.0 | 3.0 | 3252 | $4,000 | $1.23 | 11d | 1 | 1.43mi |
| 22634 SW 131st Pl Unit 22634 Goulds, FL | 5.0 | 3.0 | 3252 | $4,000 | $1.23 | 18d | 1 | 1.43mi |
Listing history 33 events
-
2026-06-18days on market $985,000 Active 63 DOM
-
2026-06-17days on market $985,000 Active 62 DOM
-
2026-06-16days on market $985,000 Active 61 DOM
-
2026-06-15days on market $985,000 Active 60 DOM
-
2026-06-13pricedays on market $985,000 Active 58 DOM
-
2026-06-09days on market $1,000,000 Active 54 DOM
-
2026-06-08days on market $1,000,000 Active 53 DOM
-
2026-06-07days on market $1,000,000 Active 52 DOM
-
2026-06-04days on market $1,000,000 Active 49 DOM
-
2026-06-03days on market $1,000,000 Active 48 DOM
-
2026-06-02days on market $1,000,000 Active 47 DOM
-
2026-06-01days on market $1,000,000 Active 46 DOM
-
2026-05-31days on market $1,000,000 Active 45 DOM
-
2026-04-15$1,000,000 Active
-
2024-03-11soldstatus $670,000
-
2023-11-28price $690,000
-
2022-02-11price $1,300
-
2014-11-28soldstatus $117,000 Sold
-
2014-08-29soldstatus $117,000
-
2014-07-07status Pending
-
2014-06-06$148,000 Active
-
2014-05-10historical
-
2014-05-10price $152,000 Active
-
2014-02-17$160,000 Active
-
2012-05-31soldstatus $60,000
-
2004-08-12soldstatus $135,000
-
2001-12-06soldstatus $82,000
-
1999-08-24soldstatus $69,000
-
1999-01-15soldstatus $28,000
-
1994-10-28soldstatus $67,000
-
1979-12-01soldstatus $45,000
-
1979-11-01soldstatus $45,000
-
1978-06-01soldstatus $78,000
ⓘ Source: listings_history table (triggers on properties + properties_extension) + one-shot
backfill from property_details.listing_events for pre-trigger history.
Tax reassessment forecast FL · Resets to sale price
- Current annual tax
- $9,717 · $810/mo
- Projected year-2 tax
- $9,717 · $810/mo
- Expected delta
- $0/yr ($0/mo · 0.0%)
ⓘ Screening estimate from a state-policy table — verify with the county assessor before closing.
Climate risk First Street
- Flood 5/10 Major FEMA zone X (unshaded) · 24% chance over 30 yrs
- Wildfire 1/10 Low
- Heat 10/10 Extreme 7 d/yr ≥104°F today · 31 d/yr by 30 yrs out
- Wind 10/10 Extreme 99% chance of damaging wind over 30 yrs
- Air quality 2/10 Low 1 unhealthy d/yr today · 1 by 30 yrs out
Nearby sold comps map
Loading sold comps map…
Walkable amenities ~0.75 mi
Loading nearby amenities…
Taxation est. · year 1
- Rental income
- $168,348
- − Mortgage interest
- −$55,175
- − Property taxes
- −$9,717
- − Insurance
- −$4,925
- − Repairs & maintenance
- −$13,468
- − Management
- −$13,468
- − Depreciation
- −$28,655
- Taxable income
- $42,940
- Est. tax owed @ 24.0%
- −$10,306
- After-tax cash flow
- $46,062/yr
For passive investors: Depreciation is non-cash, so a rental often shows a tax loss while cash-flowing — sheltering income. Rental losses are passive: they offset passive income freely, and up to $25,000/yr can offset ordinary (W-2) income if you actively participate and your MAGI is under $100k (phasing out to $0 by $150k); unused losses carry forward. On sale, claimed depreciation is recaptured at up to 25%, and gains may owe capital-gains tax (a 1031 exchange can defer both). Figures are a year-1 estimate at your 24.0% rate — not tax advice; consult a CPA.
Schools (NCES district)
- District
- Miami-Dade
- NCES district ID
- 1200390
- Math proficiency
- 45% ▼ -16.00%
- Reading proficiency
- 54% ▼ -5.00%
- Median HH income
- $43,928
- Composite
- 41.76/100
- National rank
- #3397
- State rank
- #40 of 73 in FL
Livability — Goulds
- Score
- 70/100
- State rank
- #431
- US rank
- #7705
Category grades
Schools grade is shown separately in the Schools card above.
Census & demographics
- Census place
- Goulds, FL
- County
- Miami-Dade County · 2,697,751 people
- Metro
- Miami-Fort Lauderdale-Pompano Beach, FL
- Population (ZIP)
- 16,652
- Household income
- $73,958
- Rent vs Own
- Severe rent burden
- 392.0
Population outlook (Miami-Dade County) Hauer SSP2
- Today (2025)
- 3,126,439 people
- By 2030
- 3,325,765 · +6.4%
- By 2040
- 3,697,561 · +18.3%
- By 2050
- 4,012,134 · +28.3%
- By 2075
- 4,605,612 · +47.3%
- By 2100
- 4,866,598 · +55.7%
Race, ethnicity, and origin ACS 2023
- Neighborhood character
- Diverse neighborhood (Simpson 0.56)
- Race & ethnicity
- Hispanic / Latino 60% Two or more races 36% Black 27% White 11%
- Hispanic origin (detail)
- Mexican 6% Puerto Rican 4% Cuban 36% Dominican 3%
- Common ancestry
- Hispanic 2%
- Foreign-born
- 40% · Canada, Jamaica
- Languages at home
- 36% English-only · Spanish 61% French/Haitian/Cajun 2% Other Indo-European 1%
Political lean MEDSL · Miami-Dade
- 2024 margin
- R (+11.4) · D 43.9% · R 55.4%
- 2008→2024 swing
- -27.6pp toward R · 2008: 16.1pp · 2024: -11.4pp
- All cycles
- 2024: R+11.4 2020: D+7.3 2016: D+29.6 2012: D+23.7 2008: D+16.1
Not yet ingested
- Civics
- —
Market trends
- HPI YoY
- ▼ -169.57%
- Current HPI
- 511.3532
- Rent YoY
- —
- Metro
- Miami-Fort Lauderdale-Pompano Beach, FL
- State GDP YoY
- ▲ 3.28%
- F500 in state
- 36
Industry mix (Fortune 500 HQ in FL)
| Industry | F500 HQs | Revenue |
|---|---|---|
| Industrial Technology | 2 | $29B |
|
||
| Insurance | 2 | $17B |
|
||
| Retail | 1 | $60B |
|
||
| Technology Distribution | 1 | $58B |
|
||
| Homebuilding | 1 | $35B |
|
||
| Technology Manufacturing | 1 | $35B |
|
||
Price history
+1182.1% since first listed20 events — show timeline
- 2026-04-15 Listed $1,000,000 MARMLS
- 2024-03-11 Sold (Public Records) $670,000 Public Records
- 2023-11-28 Price Changed $690,000 Beaches MLS
- 2022-02-11 Price Changed $1,300 RENT.
- 2014-11-28 Sold (MLS) $117,000 MARMLS
- 2014-08-29 Sold (Public Records) $117,000 Public Records
- 2014-07-07 Pending — MARMLS
- 2014-06-06 Listed $148,000 MARMLS
- 2014-05-10 Listing Removed — MARMLS
- 2014-05-10 Price Changed $152,000 MARMLS
- 2014-02-17 Listed $160,000 MARMLS
- 2012-05-31 Sold (Public Records) $60,000 Public Records
- 2004-08-12 Sold (Public Records) $135,000 Public Records
- 2001-12-06 Sold (Public Records) $82,000 Public Records
- 1999-08-24 Sold (Public Records) $69,000 Public Records
- 1999-01-15 Sold (Public Records) $28,000 Public Records
- 1994-10-28 Sold (Public Records) $67,000 Public Records
- 1979-12-01 Sold (Public Records) $45,000 Public Records
- 1979-11-01 Sold (Public Records) $45,000 Public Records
- 1978-06-01 Sold (Public Records) $78,000 Public Records
Property tax history
+8.4%/yrLatest (2025): $9,717 · +43.0% YoY. Source: county tax records.
Cash-flow waterfall
monthlySold comps — $/sqft
last 12 mo · ≤1 miLoading sold comps…