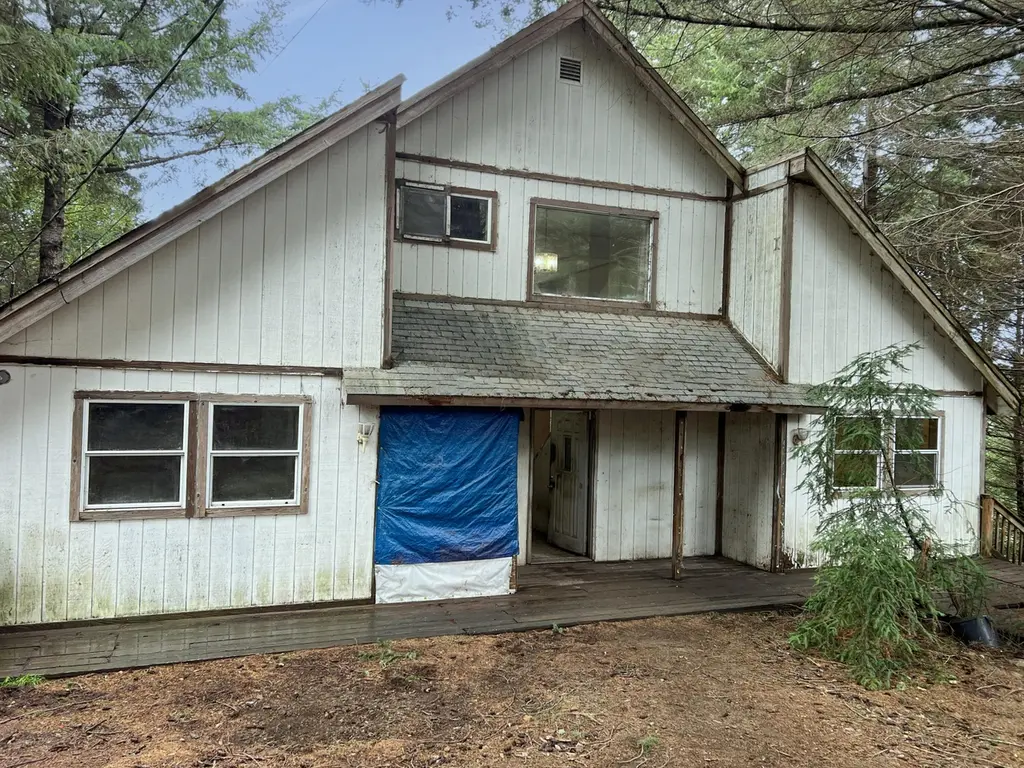
261 Parsons Rd · Shelter Cove, CA
Flood risk 1/10 · Minimal
- FEMA flood zone
- D
- Chance of flooding over 30 yrs
- 0.0%
- Est. flood insurance / yr
- $544 – $1,084
Fire risk 5/10 · Moderate
- Est. fire insurance / yr
- $659 – $1,223
Heat risk 3/10 · Minor
- Hot days now (above 75°F)
- 3 days/yr
- Hot days in 30 yrs
- 9 days/yr
Wind risk 1/10 · Minimal
- Chance of severe wind over 30 yrs
- —
Air-quality risk 7/10 · Major
- Unhealthy air days now
- 12 days/yr
- Unhealthy air days in 30 yrs
- 13 days/yr
Risk factors via First Street. Map © Google.
Why this score? — see what drove the C+ grade
The composite is a weighted blend of 9 inputs, each scored 0–100. Each bar is that input's sub-score; the figure is the points it added to the 100-point composite (weight × sub-score).
- Cash flow +27.6/30.0
- DSCR +9.7/10.0
- ARV discount +7.5/15.0
- 1% rule +7.3/10.0
- Schools +3.1/10.0
- Rent growth +2.5/5.0
- Condition / age +2.5/5.0
- Livability +2.3/5.0
- Appreciation +0.0/10.0
$119,900
🖨 Deal sheet 📄 Offer letter ✓ Due diligence
Listing remarks MLS
This home needs all from top to bottom. Put your creative imagination and special touches to work and make this yours in beautiful Shelter Cove. Lots of potential.
Key facts
- 0.32 acre lot
- Built 1997
- Listed 189 days
Neighborhood map
What this means for you Summary
Snapshot
- This is a 2-bed/2.0-bath single-family listed at $120k.
Deal economics
- At list price, monthly cash flow is $359 ($4k/yr) — positive.
- The deal already cash-flows at list — no discount required.
- Meets the 1% rule at list price ($1k rent vs $120k).
- Recommended offer: $106k (12.0% below list) — sets the bar for market timing.
- Cap rate 9.9% vs local median 1.6% in Shelter Cove — top-decile yield for the area; either an underpriced asset or a hidden risk that comps aren't pricing in. Stress-test before assuming the spread holds.
Location & tenants
- Location reads 46/100 on livability (#1,268 in CA) — a working-class tenant base; expect higher turnover. Watch: health & safety C-, schools D+, housing D.
- Southern Humboldt Joint Unified (rural): math 28% / reading 41% proficiency, ranked #928 of 1,400 in CA (top 66%) — families likely to look elsewhere, expect single-tenant / working-renter base with shorter leases.
- Market conditions: 168 active listings in the ZIP; 188 units permitted in Humboldt County in 2024 (17 in 5+ unit buildings).
Forward outlook
- Local home prices are declining (-3.0%/yr); year-one equity from $829 of loan paydown is wiped out by about $4k of value loss. Plan a longer hold.
- Humboldt County population projected to shrink 4% by 2050 — rents likely to lag national; underwrite the cash flow, not the appreciation.
- At projected returns (-3.0% appreciation + 3.0% rent growth), your $34k cash investment doubles in ~9 years — after that, you're playing with house money.
Negotiation context
- It's been on market 190 days — a 12% lower offer ($106k) is reasonable based on typical stale-listing flexibility.
Risks & watch-outs
- Climate carrying-cost: moderate wildfire risk — expect insurance premiums to compound above CPI over the hold.
Questions for the listing agent
- It's been on market 190 days. Have you received any prior offers? Is the seller open to a 12% concession, seller financing, or rate buy-down credit?
- Why hasn't it sold? Are there any deal-killer items the seller is aware of (foundation, flood, title, zoning, code violations)?
- Is there a deadline driving the sale (1031 exchange, divorce, estate, relocation)? That informs how much negotiation room exists.
- Schools are D-rated, which usually means shorter tenancies and higher turnover. Who's the typical renter profile here, and what's been the actual vacancy rate?
- Crime grade is F in this area — have there been break-ins, vandalism, or insurance claims at this property in the last 3 years? What carrier currently insures it and at what premium?
- What's the average days-on-market for RENTAL listings here right now (not sales)? A rising rental-DOM trend means longer vacancies and softer asking-rent achievability than the comps imply.
- What's the recent tenant-quality profile in this submarket — average credit score on applications, eviction rate, late-payment / NSF rate, and stable-employment percentage? A property-management company in the area should have these aggregated.
- How much new for-sale + rental construction is in the pipeline within 1–3 miles? Heavy new supply typically softens prices + rents 12–24 months out; constrained supply supports both.
Investment metrics
- 1% rule
- 1.23% ✓
- Cap rate
- 9.89%
- Cash-on-cash
- 12.84%
- DSCR
- 1.57
- GRM
- 6.7
CMA / ARV
- ARV (median comp)
- $430,184
- List price
- $119,900
- Delta
- -72.13%
- Verdict
- UNDERPRICED
- Comps
- 20 within 1.0 mi
Show comp detail 7 sales within ~0.75 mi
| Address | Dist | Beds/Ba | Sqft | Sold | Price | $/sf | Match |
|---|---|---|---|---|---|---|---|
| 280 Vista Rd | 0.50mi | 3/— (+1) | 1,476 (-4%) | 1mo | $530,000 | $359 | 64 |
| 9046 Shelter Cove Rd | 0.52mi | 3/2.0 (+1) | 1,500 (-2%) | 7mo | $270,000 | $180 | 62 |
| 336 Nob Hill Dr | 0.48mi | 2/2.0 | 1,694 (+10%) | 2mo | $450,000 | $266 | 59 |
| 599 Nob Hill Ct | 0.34mi | 2/1.0 | 1,460 (-5%) | 23mo | $675,000 | $462 | 52 |
| 28 View Cir | 0.47mi | 3/2.0 (+1) | 1,420 (-8%) | 17mo | $290,000 | $204 | 46 |
| 533 Seafoam Rd | 0.71mi | 2/2.0 | 1,652 (+8%) | 13mo | $510,000 | $309 | 44 |
| 113 Spur Ct | 0.70mi | 3/2.0 (+1) | 1,654 (+8%) | 10mo | $465,000 | $281 | 41 |
Match score weights: distance 35% · size 25% · config 20% · recency 20%. Top-matched comps best support the ARV.
Projected returns pro-forma
-3.0% appreciation · 3.0% rent growth · sell at horizon
- IRR
- 2.7%
- Equity multiple
- 1.10×
- Total profit
- $3,459
- Equity at exit
- $17,877
- IRR
- 12.3%
- Equity multiple
- 1.97×
- Total profit
- $32,515
- Equity at exit
- $10,367
Cash invested: $33,572 (down + closing). Projections, not guarantees.
Landlord ↔ Tenant lean methodology
- Overall (STATE)
- 18 Strongly Tenant-Friendly
- State California
- 18 Strongly Tenant-Friendly · D+13
- County
- — inherits STATE
- City
- — inherits STATE
ZIP-level market 95589
- Home prices YoY
- -34.2%
- Active inventory
- 168
- Price-to-rent
- 6.7×
Monthly cashflow live
- Estimated rent
- $1,481 medium interval (Pro) →
- Mortgage (P&I)
- −$629
- Tax from tax record
- −$132 /mo · $1,582/yr
- Insurance
- −$50
- HOA
- −$0
- Vacancy / Maint / Mgmt
- −$311
- Net cashflow
- $359
Break-even live
UW: 25.0% down · 7.5% · 30yr · 1.5% tax · 5.0% vac · 8.0% maint · 8.0% mgmt
Financing live
Cash to close
- Down payment
- $29,975
- Closing costs
- $3,597
- Reserves months
- —
- Total cash needed
- —
Loan-product check · same deal, 3 products live
Conventional
25% down · 7.5% · 30yr
- Down + closing
- —
- Monthly P&I
- —
- Monthly cashflow
- —
- DSCR
- —
- Eligible?
- —
Personal DTI + credit; lowest rate.
DSCR
20% down · 8.5% · 30yr
- Down + closing
- —
- Monthly P&I
- —
- Monthly cashflow
- —
- DSCR
- —
- Eligible?
- —
No personal income docs; deal must DSCR.
Hard money
10% down · 12.0% · 12mo
- Down + closing
- —
- Monthly P&I
- —
- Monthly cashflow
- —
- DSCR
- —
- Eligible?
- —
Short-term bridge; refi at stabilization.
Listing history 22 events
-
2026-06-19days on market $119,900 Active 190 DOM
-
2026-06-18days on market $119,900 Active 189 DOM
-
2026-06-17days on market $119,900 Active 188 DOM
-
2026-06-16days on market $119,900 Active 187 DOM
-
2026-06-15days on market $119,900 Active 186 DOM
-
2026-06-14days on market $119,900 Active 184 DOM
-
2026-06-12days on market $119,900 Active 183 DOM
-
2026-06-09days on market $119,900 Active 180 DOM
-
2026-06-08days on market $119,900 Active 179 DOM
-
2026-06-07days on market $119,900 Active 178 DOM
-
2026-06-07days on market $119,900 Active 177 DOM
-
2026-06-04days on market $119,900 Active 174 DOM
-
2026-06-02days on market $119,900 Active 173 DOM
-
2026-06-01days on market $119,900 Active 172 DOM
-
2026-05-31days on market $119,900 Active 171 DOM
-
2026-05-31days on market $119,900 Active 170 DOM
-
2026-04-14price $119,900 163-char remark
Show marketing remark (163 chars)
This home needs all from top to bottom. Put your creative imagination and special touches to work and make this yours in beautiful Shelter Cove. Lots of potential.
-
2026-03-17price $129,900 163-char remark
Show marketing remark (163 chars)
This home needs all from top to bottom. Put your creative imagination and special touches to work and make this yours in beautiful Shelter Cove. Lots of potential.
-
2026-03-04price $155,000 163-char remark
Show marketing remark (163 chars)
This home needs all from top to bottom. Put your creative imagination and special touches to work and make this yours in beautiful Shelter Cove. Lots of potential.
-
2026-02-10price $170,000 163-char remark
Show marketing remark (163 chars)
This home needs all from top to bottom. Put your creative imagination and special touches to work and make this yours in beautiful Shelter Cove. Lots of potential.
-
2026-01-15price $181,950 163-char remark
Show marketing remark (163 chars)
This home needs all from top to bottom. Put your creative imagination and special touches to work and make this yours in beautiful Shelter Cove. Lots of potential.
-
2025-12-09$190,000 Active 163-char remark
Show marketing remark (163 chars)
This home needs all from top to bottom. Put your creative imagination and special touches to work and make this yours in beautiful Shelter Cove. Lots of potential.
ⓘ Source: listings_history table (triggers on properties + properties_extension) + one-shot
backfill from property_details.listing_events for pre-trigger history.
Tax reassessment forecast CA · Resets to sale price
- Current annual tax
- $1,582 · $132/mo
- Projected year-2 tax
- $1,582 · $132/mo
- Expected delta
- $0/yr ($0/mo · 0.0%)
ⓘ Screening estimate from a state-policy table — verify with the county assessor before closing.
Climate risk First Street
- Flood 1/10 Low FEMA zone D · 0% chance over 30 yrs
- Wildfire 5/10 Major
- Heat 3/10 Moderate 3 d/yr ≥75°F today · 9 d/yr by 30 yrs out
- Wind 1/10 Low
- Air quality 7/10 Severe 12 unhealthy d/yr today · 13 by 30 yrs out
Nearby sold comps map
Loading sold comps map…
Walkable amenities ~0.75 mi
Loading nearby amenities…
Taxation est. · year 1
- Rental income
- $17,769
- − Mortgage interest
- −$6,716
- − Property taxes
- −$1,582
- − Insurance
- −$600
- − Repairs & maintenance
- −$1,422
- − Management
- −$1,422
- − Depreciation
- −$3,488
- Taxable income
- $2,540
- Est. tax owed @ 24.0%
- −$610
- After-tax cash flow
- $3,701/yr
For passive investors: Depreciation is non-cash, so a rental often shows a tax loss while cash-flowing — sheltering income. Rental losses are passive: they offset passive income freely, and up to $25,000/yr can offset ordinary (W-2) income if you actively participate and your MAGI is under $100k (phasing out to $0 by $150k); unused losses carry forward. On sale, claimed depreciation is recaptured at up to 25%, and gains may owe capital-gains tax (a 1031 exchange can defer both). Figures are a year-1 estimate at your 24.0% rate — not tax advice; consult a CPA.
Schools (NCES district)
- District
- Southern Humboldt Joint Unified
- NCES district ID
- 0637590
- Math proficiency
- 28% ▲ 1.00%
- Reading proficiency
- 41% ▲ 2.00%
- Median HH income
- $38,108
- Composite
- 31.43/100
- National rank
- #11197
- State rank
- #928 of 1400 in CA
Livability — Shelter Cove
- Score
- 46/100
- State rank
- #1268
- US rank
- #26424
Category grades
Schools grade is shown separately in the Schools card above.
Census & demographics
- Census place
- Shelter Cove, CA
- Population (ZIP)
- 1,467
Population outlook (Humboldt County) Hauer SSP2
- Today (2025)
- 135,550 people
- By 2030
- 134,798 · -0.6%
- By 2040
- 132,222 · -2.5%
- By 2050
- 130,850 · -3.5%
- By 2075
- 128,656 · -5.1%
- By 2100
- 120,238 · -11.3%
Race, ethnicity, and origin ACS 2023
- Neighborhood character
- Predominantly White (77%)
- Race & ethnicity
- White 77% Hispanic / Latino 12% Two or more races 8% Black 3%
- Hispanic origin (detail)
- Mexican 11%
- Common ancestry
- Romanian 7% Italian 5% Serbian 1%
- Foreign-born
- 9% · Canada
- Languages at home
- 85% English-only · Spanish 10% Other Indo-European 5%
Political lean MEDSL · Humboldt
- 2024 margin
- Strong D (+28.4) · D 62.0% · R 33.6% · Other 4.5%
- 2008→2024 swing
- +0.2pp no change · 2008: 28.2pp · 2024: 28.4pp
- All cycles
- 2024: D+28.4 2020: D+33.4 2016: D+25.9 2012: D+26.2 2008: D+28.2
Not yet ingested
- Civics
- —
Market trends
- HPI YoY
- ▼ -55.58%
- Current HPI
- 107.0105
- Rent YoY
- —
- Metro
- —
- State GDP YoY
- ▲ 3.21%
- F500 in state
- 116
Industry mix (Fortune 500 HQ in CA)
| Industry | F500 HQs | Revenue |
|---|---|---|
| Technology | 27 | $1,492B |
|
||
| Financial Services | 3 | $174B |
|
||
| Retail | 3 | $44B |
|
||
| Insurance | 3 | $26B |
|
||
| Media / Entertainment | 2 | $115B |
|
||
| Pharmaceuticals / Biotech | 2 | $62B |
|
||
Price history
-36.9% since first listed6 events — show timeline
- 2026-04-14 Price Changed $119,900 HAR
- 2026-03-17 Price Changed $129,900 HAR
- 2026-03-04 Price Changed $155,000 HAR
- 2026-02-10 Price Changed $170,000 HAR
- 2026-01-15 Price Changed $181,950 HAR
- 2025-12-09 Listed $190,000 HAR
Property tax history
+2.5%/yrLatest (2025): $1,582 · +4.1% YoY. Source: county tax records.
Cash-flow waterfall
monthlySold comps — $/sqft
last 12 mo · ≤1 miLoading sold comps…