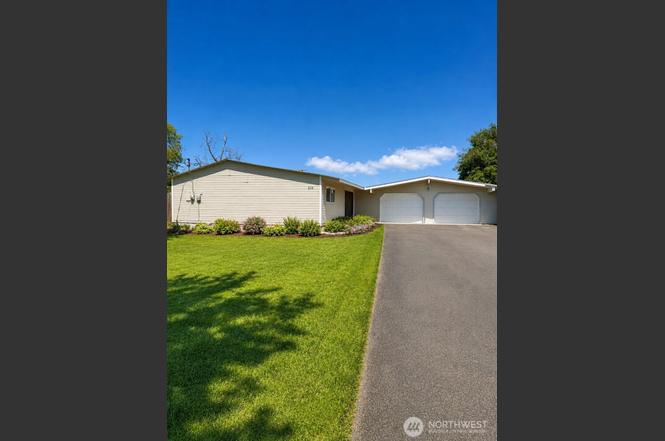
214 Carswell Dr · Moses Lake North, WA
Flood risk 1/10 · Minimal
- FEMA flood zone
- X (unshaded)
- Chance of flooding over 30 yrs
- 0.0%
- Est. flood insurance / yr
- $507 – $1,088
Fire risk 4/10 · Minor
- Est. fire insurance / yr
- $604 – $1,122
Heat risk 4/10 · Minor
- Hot days now (above 96°F)
- 7 days/yr
- Hot days in 30 yrs
- 14 days/yr
Wind risk 1/10 · Minimal
- Chance of severe wind over 30 yrs
- —
Air-quality risk 9/10 · Severe
- Unhealthy air days now
- 18 days/yr
- Unhealthy air days in 30 yrs
- 18 days/yr
Risk factors via First Street. Map © Google.
Why this score? — see what drove the C grade
The composite is a weighted blend of 9 inputs, each scored 0–100. Each bar is that input's sub-score; the figure is the points it added to the 100-point composite (weight × sub-score).
- Cash flow +20.9/30.0
- ARV discount +15.0/15.0
- DSCR +6.7/10.0
- 1% rule +5.3/10.0
- Schools +3.9/10.0
- Livability +3.2/5.0
- Condition / age +2.5/5.0
- Rent growth +2.1/5.0
- Appreciation +0.0/10.0
$159,900
🖨 Deal sheet 📄 Offer letter ✓ Due diligence
Listing remarks
Affordable opportunity in the heart of Moses Lake! This bank-owned 3-bedroom, 1-bath home offers a solid foundation and plenty of potential for buyers looking to build equity through cosmetic updates and personal improvements. With good bones, a functional floor plan, and desirable features already in place, this property is ready for its next chapter. The home features a spacious living area, three comfortable bedrooms, 1 full bathroom, 1 half bathroom and an attached garage for convenient parking and storage. Step outside to enjoy the covered rear patio, providing a great space for outdoor relaxation, entertaining, or future backyard enhancements. Whether you're a first-time buyer looking
Key facts
- Covered rear patio
- Solid foundation
- 7,289 sq ft lot
Tags
Property features AI
Finance
- Other: Lot approx. 0.1673 acres; Lot features indicate lot number 206
- Financial info: Listing terms: Cash, Conventional, Rehab Loan
Exterior
- Parking: Attached garage; Driveway; Off-street parking; Covered parking for 1 vehicle
- Security: Partially fenced; Security gate
- Utilities: Electric energy source; Public water (City of Moses Lake); Sewer connected (City of Moses Lake); Power provided by Grant County PUD; Electric water heater
- Home design: Single-family residence; One-story house; Main-level entry; Built on lot; Fixer condition; Facing direction not specified
- Construction: Built in 1970 (effective year); Wood construction; Composition roof; Poured concrete and slab foundation
- Exterior features: Wood products exterior; Partially fenced; Patio; Cable TV available; High-speed internet available; Curbs and paved streets; Level topography
Interior
- Kitchen: Stove/Range; Microwave; Refrigerator; See remarks (additional appliance/details)
- Bedrooms: 3 bedrooms (all on the main level)
- Flooring: Laminate
- Bathrooms: 1 full bathroom; 1 half bathroom; Main level has 1 full and 1 half bath; 1 bathtub; 1 shower
- Heating & cooling: Baseboard heating; No cooling
- Interior features: Ceiling fan(s); Water heater; Has view
- Laundry & utility: Washer; Dryer; Water heater located in laundry room
Neighborhood map
What this means for you Summary
Snapshot
- This is a 3-bed/2.0-bath single-family listed at $160k.
Deal economics
- At list price, monthly cash flow is $224 ($3k/yr) — positive.
- The deal already cash-flows at list — no discount required.
- Meets the 1% rule at list price ($2k rent vs $160k).
- Cap rate 8.0% vs local median 2.2% in Moses Lake North — top-decile yield for the area; either an underpriced asset or a hidden risk that comps aren't pricing in. Stress-test before assuming the spread holds.
Location & tenants
- Location reads 65/100 on livability (#351 in WA) — a middle-class / working-renter tenant base. Strengths: cost of living A+, housing A+, health & safety A+; Watch: crime C-, schools F, amenities F.
- Moses Lake School District (town): math 38% / reading 48% proficiency, ranked #198 of 291 in WA (top 68%) — families likely to look elsewhere, expect single-tenant / working-renter base with shorter leases.
- Market conditions: Rents soft (-1.7%/yr); 585 active listings in the ZIP; 12 comparable units currently listed for rent nearby; rentals lingering (median 44d on market — plan ~5-8 weeks vacancy on turnover, expect pricing pressure); 100% of comp listings sitting > 30 days — soft ceiling on asking rent; 559 units permitted in Grant County in 2024 (35 in 5+ unit buildings).
Forward outlook
- Local home prices are declining (-3.0%/yr); year-one equity from $1k of loan paydown is wiped out by about $5k of value loss. Plan a longer hold.
- Grant County population projected at +16% by 2050 — long-run rental-demand tailwind backs the buy-and-hold thesis.
Negotiation context
- Only 2 days on market — expect competitive offers; lowballing is unlikely to land.
- 3 sale attempts since 19y ago with the ask held roughly flat each time — persistent listings suggest the price (not the market) is what's stuck; bring a comps-based counter.
Questions for the listing agent
- Built in 1961 — when were the roof, HVAC, electrical panel, plumbing, and water heater last replaced?
- Is there a deadline driving the sale (1031 exchange, divorce, estate, relocation)? That informs how much negotiation room exists.
- Schools are F-rated, which usually means shorter tenancies and higher turnover. Who's the typical renter profile here, and what's been the actual vacancy rate?
- What's the average days-on-market for RENTAL listings here right now (not sales)? A rising rental-DOM trend means longer vacancies and softer asking-rent achievability than the comps imply.
- What's the recent tenant-quality profile in this submarket — average credit score on applications, eviction rate, late-payment / NSF rate, and stable-employment percentage? A property-management company in the area should have these aggregated.
- How much new for-sale + rental construction is in the pipeline within 1–3 miles? Heavy new supply typically softens prices + rents 12–24 months out; constrained supply supports both.
Investment metrics
- 1% rule
- 1.03% ✓
- Cap rate
- 7.97%
- Cash-on-cash
- 6.00%
- DSCR
- 1.27
- GRM
- 8.1
CMA / ARV
- ARV (on-the-fly)
- $233,361
- Comps found
- 8
Show comp detail 8 sales within ~0.75 mi
| Address | Dist | Beds/Ba | Sqft | Sold | Price | $/sf | Match |
|---|---|---|---|---|---|---|---|
| 167 Carswell Dr | 0.10mi | 3/1.5 | 1,161 (0%) | 9mo | $245,000 | $211 | 86 |
| 313 Offutt Dr NE | 0.21mi | 3/1.5 | 1,172 (+1%) | 13mo | $235,000 | $201 | 76 |
| 8910 Travis Dr Unit B | 0.49mi | 3/1.0 | 1,144 (-2%) | 4mo | $230,000 | $201 | 68 |
| 438 Biggs Dr | 0.34mi | 3/1.5 | 1,220 (+5%) | 8mo | $215,000 | $176 | 67 |
| 149 Carswell Dr | 0.21mi | 2/1.5 (-1) | 1,185 (+2%) | 23mo | $235,000 | $198 | 60 |
| 417 Loring Dr | 0.34mi | 3/1.5 | 1,194 (+3%) | 21mo | $129,000 | $108 | 60 |
| 7711 NE McDougal Ave | 0.32mi | 3/2.0 | 1,280 (+10%) | 15mo | $340,000 | $266 | 56 |
| 1216 Arlington Dr | 0.69mi | 3/1.0 | 1,064 (-8%) | 21mo | $232,700 | $219 | 32 |
Match score weights: distance 35% · size 25% · config 20% · recency 20%. Top-matched comps best support the ARV.
Projected returns pro-forma
-3.0% appreciation · 0.0% rent growth · sell at horizon
- IRR
- -10.4%
- Equity multiple
- 0.63×
- Total profit
- $-16,496
- Equity at exit
- $23,842
- IRR
- -5.9%
- Equity multiple
- 0.67×
- Total profit
- $-14,700
- Equity at exit
- $13,825
Cash invested: $44,772 (down + closing). Projections, not guarantees.
Landlord ↔ Tenant lean methodology
- Overall (STATE)
- 28 Tenant-Leaning
- State Washington
- 28 Tenant-Leaning · D+8
- County
- — inherits STATE
- City
- — inherits STATE
ZIP-level market 98837
- Rents YoY
- -1.7%
- Active inventory
- 585
- Price-to-rent
- 8.1×
Monthly cashflow live
- Estimated rent
- $1,654 high interval (Pro) →
- Mortgage (P&I)
- −$839
- Tax from tax record
- −$178 /mo · $2,131/yr
- Insurance
- −$67
- HOA
- −$0
- Vacancy / Maint / Mgmt
- −$347
- Net cashflow
- $224
Break-even live
UW: 25.0% down · 7.5% · 30yr · 1.5% tax · 5.0% vac · 8.0% maint · 8.0% mgmt
Financing live
Cash to close
- Down payment
- $39,975
- Closing costs
- $4,797
- Reserves months
- —
- Total cash needed
- —
Loan-product check · same deal, 3 products live
Conventional
25% down · 7.5% · 30yr
- Down + closing
- —
- Monthly P&I
- —
- Monthly cashflow
- —
- DSCR
- —
- Eligible?
- —
Personal DTI + credit; lowest rate.
DSCR
20% down · 8.5% · 30yr
- Down + closing
- —
- Monthly P&I
- —
- Monthly cashflow
- —
- DSCR
- —
- Eligible?
- —
No personal income docs; deal must DSCR.
Hard money
10% down · 12.0% · 12mo
- Down + closing
- —
- Monthly P&I
- —
- Monthly cashflow
- —
- DSCR
- —
- Eligible?
- —
Short-term bridge; refi at stabilization.
Rent comps 12 comps
| Address | Beds | Baths | Sqft | Rent | $/sqft | DOM | Units | Dist |
|---|---|---|---|---|---|---|---|---|
| 205 March Dr NE Unit Labs Moses Lake, WA | 3.0 | 1.5 | 1440 | $1,750 | $1.22 | 43d | 1 | 0.15mi |
| 207 March Dr NE Moses Lake, WA | 3.0 | 1.5 | 1220 | $1,850 | $1.52 | 43d | 1 | 0.16mi |
| 8915 Travis Dr Unit B Moses Lake, WA | 3.0 | 1.0 | 1144 | $1,100 | $0.96 | 43d | 1 | 0.39mi |
| 1232 Vandenburg Ave Moses Lake, WA | 2.0 | 1.0 | 960 | $1,250 | $1.30 | 43d | 1 | 0.41mi |
| 7560 McDougal Ave NE Unit C Moses Lake, WA | 2.0 | 2.0 | 1360 | $1,950 | $1.43 | 43d | 1 | 0.47mi |
| 4727 Owens Rd NE #24 Moses Lake, WA | 2.0 | 1.0 | 900 | $1,200 | $1.33 | 43d | 1 | 0.79mi |
| 1422 E Craig St Moses Lake, WA | 2.0–4.0 | 1.0–2.0 | 980 | $1,138 | $1.16 | 44d | 1 | 1.20mi |
| 1118 W Sequoia Rd Moses Lake, WA | 3.0 | 2.0 | 1235 | $2,000 | $1.62 | 43d | 1 | 1.34mi |
| 6379 Arnold Dr Apt 17 Moses Lake, WA | 2.0 | 1.0 | 760 | $808 | $1.06 | 43d | 1 | 1.35mi |
| 6379 Arnold Dr Unit 11 Moses Lake, WA | 2.0 | 1.0 | 760 | $1,040 | $1.37 | 43d | 1 | 1.35mi |
| 6379 Arnold Dr Unit 15 Moses Lake, WA | 2.0 | 1.0 | 760 | $988 | $1.30 | 43d | 1 | 1.35mi |
| 1013 W Maple Dr Moses Lake, WA | 3.0 | 2.0 | 1450 | $1,875 | $1.29 | 43d | 1 | 1.38mi |
Listing history 3 events
-
2026-06-19days on market $159,900 Active 2 DOM
-
2026-06-18remarks 699-char remark
-
2026-06-18$159,900 Active 1 DOM
ⓘ Source: listings_history table (triggers on properties + properties_extension) + one-shot
backfill from property_details.listing_events for pre-trigger history.
Tax reassessment forecast WA · Resets to sale price
- Current annual tax
- $2,131 · $178/mo
- Projected year-2 tax
- $2,131 · $178/mo
- Expected delta
- $0/yr ($0/mo · 0.0%)
ⓘ Screening estimate from a state-policy table — verify with the county assessor before closing.
Climate risk First Street
- Flood 1/10 Low FEMA zone X (unshaded) · 0% chance over 30 yrs
- Wildfire 4/10 Moderate
- Heat 4/10 Moderate 7 d/yr ≥96°F today · 14 d/yr by 30 yrs out
- Wind 1/10 Low
- Air quality 9/10 Extreme 18 unhealthy d/yr today · 18 by 30 yrs out
Nearby sold comps map
Loading sold comps map…
Walkable amenities ~0.75 mi
Loading nearby amenities…
Taxation est. · year 1
- Rental income
- $19,845
- − Mortgage interest
- −$8,957
- − Property taxes
- −$2,131
- − Insurance
- −$800
- − Repairs & maintenance
- −$1,588
- − Management
- −$1,588
- − Depreciation
- −$4,652
- Taxable income
- $131
- Est. tax owed @ 24.0%
- −$31
- After-tax cash flow
- $2,653/yr
For passive investors: Depreciation is non-cash, so a rental often shows a tax loss while cash-flowing — sheltering income. Rental losses are passive: they offset passive income freely, and up to $25,000/yr can offset ordinary (W-2) income if you actively participate and your MAGI is under $100k (phasing out to $0 by $150k); unused losses carry forward. On sale, claimed depreciation is recaptured at up to 25%, and gains may owe capital-gains tax (a 1031 exchange can defer both). Figures are a year-1 estimate at your 24.0% rate — not tax advice; consult a CPA.
Schools (NCES district)
- District
- Moses Lake School District
- NCES district ID
- 5305220
- Math proficiency
- 38% ▬ 0.00%
- Reading proficiency
- 48% ▼ -1.00%
- Median HH income
- $49,033
- Composite
- 39.17/100
- National rank
- #8232
- State rank
- #198 of 291 in WA
Livability — Moses Lake North
- Score
- 65/100
- State rank
- #351
- US rank
- #13402
Category grades
Schools grade is shown separately in the Schools card above.
Census & demographics
- Census place
- Moses Lake North, WA
- County
- Grant County · 61,643 people
- Metro
- Moses Lake, WA
- Population (ZIP)
- 49,455
- Household income
- $74,586
- Rent vs Own
- Severe rent burden
- 1064.0
Population outlook (Grant County) Hauer SSP2
- Today (2025)
- 99,356 people
- By 2030
- 102,107 · +2.8%
- By 2040
- 108,318 · +9.0%
- By 2050
- 114,712 · +15.5%
- By 2075
- 131,376 · +32.2%
- By 2100
- 146,163 · +47.1%
Race, ethnicity, and origin ACS 2023
- Neighborhood character
- Diverse neighborhood (Simpson 0.55)
- Race & ethnicity
- White 58% Hispanic / Latino 33% Two or more races 15% Black 2% Asian 1%
- Hispanic origin (detail)
- Mexican 30%
- Common ancestry
- Portuguese 3% Subsaharan African 2% Lithuanian 2%
- Foreign-born
- 10% · Canada
- Languages at home
- 76% English-only · Spanish 21% Russian/Polish/Slavic 2%
Political lean MEDSL · Grant
- 2024 margin
- Solid R (+37.5) · D 30.0% · R 67.4% · Other 2.6%
- 2008→2024 swing
- -9.9pp toward R · 2008: -27.5pp · 2024: -37.5pp
- All cycles
- 2024: R+37.5 2020: R+34.4 2016: R+37.9 2012: R+32.6 2008: R+27.5
Not yet ingested
- Civics
- —
Market trends
- HPI YoY
- ▼ -384.29%
- Current HPI
- 208.4574
- Rent YoY
- ▼ -1.72%
- Metro
- Moses Lake, WA
- State GDP YoY
- ▲ 4.65%
- F500 in state
- 22
Industry mix (Fortune 500 HQ in WA)
| Industry | F500 HQs | Revenue |
|---|---|---|
| Retail | 2 | $269B |
|
||
| Technology / Retail | 1 | $638B |
|
||
| Technology | 1 | $245B |
|
||
| Telecommunications | 1 | $38B |
|
||
| Food / Beverage | 1 | $36B |
|
||
| Automotive / Trucks | 1 | $34B |
|
||
Price history
+524.6% since first listed13 events — show timeline
- 2026-06-17 Listed $159,900 NWMLS as Distributed by MLS Grid
- 2021-04-11 Sold (MLS) $175,000 NWMLS as Distributed by MLS Grid
- 2021-01-14 Pending — NWMLS as Distributed by MLS Grid
- 2021-01-08 Pending — NWMLS as Distributed by MLS Grid
- 2021-01-03 Price Changed $175,000 NWMLS as Distributed by MLS Grid
- 2020-12-14 Listed $178,000 NWMLS as Distributed by MLS Grid
- 2007-11-07 Sold (Public Records) $76,000 Public Records
- 2007-11-07 Sold (MLS) $76,000 NWMLS as Distributed by MLS Grid
- 2007-10-18 Delisted — NWMLS as Distributed by MLS Grid
- 2007-07-09 Listed $84,500 NWMLS as Distributed by MLS Grid
- 1997-03-12 Sold (Public Records) $69,000 Public Records
- 1994-05-18 Sold (Public Records) $70,000 Public Records
- 1982-11-01 Sold (Public Records) $25,600 Public Records
Property tax history
+6.2%/yrLatest (2026): $2,131 · +0.0% YoY. Source: county tax records.
Cash-flow waterfall
monthlySold comps — $/sqft
last 12 mo · ≤1 miLoading sold comps…