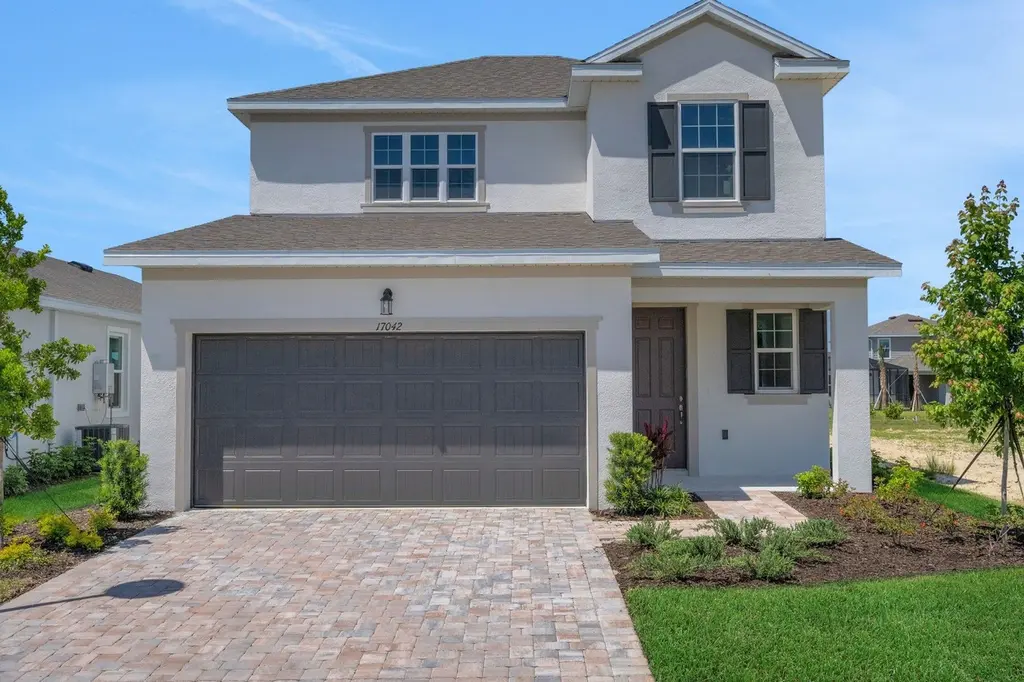
17042 Cottontail Cir · North Fort Myers, FL
Flood risk No data
- FEMA flood zone
- —
- Chance of flooding over 30 yrs
- —
- Est. flood insurance / yr
- —
Fire risk No data
- Est. fire insurance / yr
- —
Heat risk No data
- Hot days now (above threshold)
- —
- Hot days in 30 yrs
- —
Wind risk No data
- Chance of severe wind over 30 yrs
- —
Air-quality risk No data
- Unhealthy air days now
- —
- Unhealthy air days in 30 yrs
- —
Risk factors via First Street. Map © Google.
Why this score? — see what drove the C+ grade
The composite is a weighted blend of 9 inputs, each scored 0–100. Each bar is that input's sub-score; the figure is the points it added to the 100-point composite (weight × sub-score).
- Cash flow +22.0/30.0
- ARV discount +12.6/15.0
- DSCR +7.0/10.0
- 1% rule +5.8/10.0
- Schools +4.6/10.0
- Livability +3.7/5.0
- Rent growth +3.5/5.0
- Condition / age +2.5/5.0
- Appreciation +2.4/10.0
$352,990
🖨 Deal sheet (PDF) 📄 Offer letter ✓ Due diligence
Listing remarks
The Salerno floorplan by Dream Finders Homes offers 2,002 square feet of thoughtfully designed living space across two stories. This home features 4 bedrooms, 2.5 bathrooms, and a spacious 2-car garage. The first floor includes an open-concept layout with a large family room, dining area, and gourmet kitchen complete with a center island and walk-in pantry. The primary bedroom is conveniently located on the first floor and features a luxurious bath with dual vanities and a walk-in closet. Upstairs, you'll find three additional bedrooms and a full bath. A covered lanai extends the living space outdoors. Located in the gated enclave of Creekside Run, you're just minutes from future Babcock Ra
Key facts
- 2 garage spots
- Built 2026
- Listed 64 days
Property features AI
Finance
- Financial info: List price $352,990
Exterior
- Parking: 2 total parking spaces; 2-car garage
- Home design: Salerno plan; Spec new construction
Interior
- Bedrooms: 4 bedrooms
- Bathrooms: 2 full bathrooms and 1 half bathroom
- Interior features: Open living area (2,002 total living area)
Neighborhood map
What this means for you Summary
Snapshot
- This is a 4-bed/2.5-bath single-family listed at $353k.
Deal economics
- At list price, monthly cash flow is $563 ($7k/yr) — positive.
- The deal already cash-flows at list — no discount required.
- Meets the 1% rule at list price ($4k rent vs $353k).
- Recommended offer: $332k (6.0% below list) — sets the bar for market timing.
- Cap rate 8.2% vs local median 3.6% in North Fort Myers — top-decile yield for the area; either an underpriced asset or a hidden risk that comps aren't pricing in. Stress-test before assuming the spread holds.
Location & tenants
- Location reads 74/100 on livability (#269 in FL, #4,409 nationally) — a middle-class / working-renter tenant base. Strengths: cost of living A+, housing A+, health & safety A+; Watch: employment C-, amenities F, commute F.
- Charlotte (suburban): math 54% / reading 54% proficiency, ranked #22 of 73 in FL (top 30%) — acceptable for families but not a draw, mixed tenant base, ~2y average lease.
- Market conditions: Rents rising fast (+4.1%/yr); 1037 active listings in the ZIP; 16 comparable units currently listed for rent nearby; rentals at typical pace (median 22d on market — plan ~3-4 weeks tenant-placement turnaround); 4,585 units permitted in Charlotte County in 2024 (703 in 5+ unit buildings).
- At $3,800/mo this rent would consume 63% of the median local household income ($72k/yr) (locally 43% of renters already pay >50% of income on rent) — very limited rent-growth headroom before tenants either downsize or default.
Forward outlook
- Local home prices are declining (-3.0%/yr); year-one equity from $2k of loan paydown is wiped out by about $11k of value loss. Plan a longer hold.
- Charlotte County population projected at +24% by 2050 — long-run rental-demand tailwind backs the buy-and-hold thesis.
Negotiation context
- It's been on market 64 days — a 6% lower offer ($332k) is reasonable based on typical stale-listing flexibility.
Questions for the listing agent
- It's been on market 64 days. Have you received any prior offers? Is the seller open to a 6% concession, seller financing, or rate buy-down credit?
- Why hasn't it sold? Are there any deal-killer items the seller is aware of (foundation, flood, title, zoning, code violations)?
- Is there a deadline driving the sale (1031 exchange, divorce, estate, relocation)? That informs how much negotiation room exists.
- What's the average days-on-market for RENTAL listings here right now (not sales)? A rising rental-DOM trend means longer vacancies and softer asking-rent achievability than the comps imply.
- What's the recent tenant-quality profile in this submarket — average credit score on applications, eviction rate, late-payment / NSF rate, and stable-employment percentage? A property-management company in the area should have these aggregated.
- How much new for-sale + rental construction is in the pipeline within 1–3 miles? Heavy new supply typically softens prices + rents 12–24 months out; constrained supply supports both.
Investment metrics
- 1% rule
- 1.08% ✓
- Cap rate
- 8.21%
- Cash-on-cash
- 6.83%
- DSCR
- 1.30
- GRM
- 7.7
CMA / ARV
- ARV (on-the-fly)
- $398,398
- Comps found
- 12
Show comp detail 12 sales within ~0.75 mi
| Address | Dist | Beds/Ba | Sqft | Sold | Price | $/sf | Match |
|---|---|---|---|---|---|---|---|
| 44412 Kelly Dr | 0.13mi | 4/2.0 | 1,850 (-8%) | 6mo | $430,000 | $232 | 74 |
| 17845 Shade Tree Loop | 0.50mi | 4/2.0 | 2,034 (+2%) | 4mo | $405,000 | $199 | 69 |
| 17225 River Otter Rd | 0.44mi | 3/3.0 (-1) | 1,971 (-2%) | 2mo | $539,990 | $274 | 68 |
| 17219 River Otter Rd | 0.44mi | 3/2.5 (-1) | 2,088 (+4%) | 2mo | $559,298 | $268 | 66 |
| 44391 Frontier Dr | 0.49mi | 4/2.0 | 1,908 (-5%) | 3mo | $342,000 | $179 | 65 |
| 17734 Shade Tree Loop | 0.52mi | 4/2.0 | 1,828 (-9%) | 6mo | $335,000 | $183 | 54 |
| 16444 Seven Lakes Ave | 0.53mi | 4/3.0 | 2,190 (+9%) | 4mo | $372,000 | $170 | 54 |
| 17842 Shade Tree Loop | 0.45mi | 3/2.0 (-1) | 1,816 (-9%) | 6mo | $345,000 | $190 | 51 |
| 44373 Frontier Dr | 0.49mi | 4/2.5 | 2,190 (+9%) | 12mo | $379,000 | $173 | 51 |
| 16440 Marsh Ln | 0.54mi | 3/2.5 (-1) | 2,174 (+9%) | 12mo | $425,000 | $195 | 45 |
| 44234 Creekside Run Ln | 0.29mi | 3/2.0 (-1) | 1,720 (-14%) | 13mo | $535,000 | $311 | 45 |
| 44256 Panther Dr | 0.71mi | 3/2.0 (-1) | 1,805 (-10%) | 3mo | $375,000 | $208 | 41 |
Match score weights: distance 35% · size 25% · config 20% · recency 20%. Top-matched comps best support the ARV.
Projected returns pro-forma
-3.0% appreciation · 4.13% rent growth · sell at horizon
- IRR
- -4.5%
- Equity multiple
- 0.83×
- Total profit
- $-16,939
- Equity at exit
- $52,632
- IRR
- 6.4%
- Equity multiple
- 1.51×
- Total profit
- $49,970
- Equity at exit
- $30,520
Cash invested: $98,837 (down + closing). Projections, not guarantees.
Landlord ↔ Tenant lean methodology
- Overall (STATE)
- 87 Strongly Landlord-Friendly
- State Florida
- 87 Strongly Landlord-Friendly · R+3
- County
- — inherits STATE
- City
- — inherits STATE
ZIP-level market 33982
- Home prices YoY
- -1.2%
- Rents YoY
- 4.1%
- Active inventory
- 1037
- Price-to-rent
- 7.7×
Monthly cashflow live
- Estimated rent
- $3,800 high interval (Pro) →
- Mortgage (P&I)
- −$1,851
- Tax est. 1.5%
- −$441 /mo · $5,295/yr
- Insurance
- −$147
- HOA
- −$0
- Vacancy / Maint / Mgmt
- −$798
- Net cashflow
- $563
Break-even live
Sensitivity live
| Price | -10% $807 | -5% $685 | +0% $563 | +5% $441 | +10% $319 |
|---|---|---|---|---|---|
| Rent | -10% $262 | -5% $413 | +0% $563 | +5% $713 | +10% $863 |
| Rate | -1.0pp $740 | -0.5pp $652 | base $563 | +0.5pp $471 | +1.0pp $378 |
UW: 25.0% down · 7.5% · 30yr · 1.5% tax · 5.0% vac · 8.0% maint · 8.0% mgmt
Financing live
Cash to close
- Down payment
- $88,248
- Closing costs
- $10,590
- Reserves months
- —
- Total cash needed
- —
Loan-product check · same deal, 3 products live
Conventional
25% down · 7.5% · 30yr
- Down + closing
- —
- Monthly P&I
- —
- Monthly cashflow
- —
- DSCR
- —
- Eligible?
- —
Personal DTI + credit; lowest rate.
DSCR
20% down · 8.5% · 30yr
- Down + closing
- —
- Monthly P&I
- —
- Monthly cashflow
- —
- DSCR
- —
- Eligible?
- —
No personal income docs; deal must DSCR.
Hard money
10% down · 12.0% · 12mo
- Down + closing
- —
- Monthly P&I
- —
- Monthly cashflow
- —
- DSCR
- —
- Eligible?
- —
Short-term bridge; refi at stabilization.
Rent comps 16 comps
| Address | Beds | Baths | Sqft | Rent | $/sqft | DOM | Units | Dist |
|---|---|---|---|---|---|---|---|---|
| 16922 Sage Ter Punta Gorda, FL | 4.0 | 2.0 | 1580 | $3,500 | $2.22 | 22d | 1 | 0.26mi |
| 44458 Diamond Trl Punta Gorda, FL | 3.0 | 2.0 | 1484 | $2,500 | $1.68 | 22d | 1 | 0.32mi |
| 17710 Shade Tree Loop Punta Gorda, FL | 4.0 | 2.0 | 1764 | $3,000 | $1.70 | 22d | 1 | 0.58mi |
| 44229 Saddlewood Ct Punta Gorda, FL | 4.0 | 2.0 | 1675 | $2,350 | $1.40 | 14d | 1 | 0.65mi |
| 44229 Saddlewood Ct Punta Gorda, FL | 4.0 | 2.0 | 1675 | $2,395 | $1.43 | 22d | 1 | 0.65mi |
| 17339 Palmetto Pass Ln Punta Gorda, FL | 3.0 | 3.0 | 2464 | $5,000 | $2.03 | 22d | 1 | 0.80mi |
| 43693 Tree Top Trl Punta Gorda, FL | 3.0 | 3.0 | 1850 | $11,000 | $5.95 | 22d | 1 | 0.83mi |
| 17604 Fallen Branch Way Punta Gorda, FL | 4.0 | 3.0 | 2027 | $2,700 | $1.33 | 22d | 1 | 0.84mi |
| 15977 Cranes Marsh Ct Punta Gorda, FL | 3.0 | 3.0 | 2811 | $12,000 | $4.27 | 22d | 1 | 1.17mi |
| 43041 Greenway Blvd Punta Gorda, FL | 2.0–3.0 | 2.0 | 1569 | $7,500 | $4.78 | 22d | 3 | 1.31mi |
| 15907 Sugar Hill Dr Unit 15907 Punta Gorda, FL | 3.0 | 3.0 | 2247 | $9,500 | $4.23 | 22d | 1 | 1.32mi |
| 15943 Grassland Ln #3912 Punta Gorda, FL | 3.0 | 2.0 | 1741 | $8,800 | $5.05 | 22d | 1 | 1.36mi |
| 43038 Parkside Ct Punta Gorda, FL | 3.0 | 2.0 | 1677 | $2,500 | $1.49 | 22d | 1 | 1.37mi |
| 15919 Grassland Ln #4211 Punta Gorda, FL | 3.0 | 2.0 | 1741 | $8,800 | $5.05 | 22d | 1 | 1.42mi |
| 15903 Grassland Ln #4411 Punta Gorda, FL | 3.0 | 2.0 | 1741 | $7,500 | $4.31 | 22d | 1 | 1.47mi |
| 43153 Wild Indigo Rd Punta Gorda, FL | 3.0–5.0 | 2.0–2.5 | 1919 | $2,826 | $1.47 | 22d | 25 | 1.49mi |
Listing history 9 events
-
2026-06-18days on market $352,990 Active 64 DOM
-
2026-06-17days on market $352,990 Active 63 DOM
-
2026-06-16days on market $352,990 Active 62 DOM
-
2026-06-15days on market $352,990 Active 61 DOM
-
2026-06-14days on market $352,990 Active 59 DOM
-
2026-06-13days on market $352,990 Active 58 DOM
-
2026-06-10days on market $352,990 Active 56 DOM
-
2026-06-09remarks 699-char remark
-
2026-06-09$352,990 Active 55 DOM
ⓘ Source: listings_history table (triggers on properties + properties_extension) + one-shot
backfill from property_details.listing_events for pre-trigger history.
Nearby sold comps map
Loading sold comps map…
Walkable amenities ~0.75 mi
Loading nearby amenities…
Taxation est. · year 1
- Rental income
- $45,601
- − Mortgage interest
- −$19,773
- − Property taxes
- −$5,295
- − Insurance
- −$1,765
- − Repairs & maintenance
- −$3,648
- − Management
- −$3,648
- − Depreciation
- −$10,269
- Taxable income
- $1,203
- Est. tax owed @ 24.0%
- −$289
- After-tax cash flow
- $6,463/yr
For passive investors: Depreciation is non-cash, so a rental often shows a tax loss while cash-flowing — sheltering income. Rental losses are passive: they offset passive income freely, and up to $25,000/yr can offset ordinary (W-2) income if you actively participate and your MAGI is under $100k (phasing out to $0 by $150k); unused losses carry forward. On sale, claimed depreciation is recaptured at up to 25%, and gains may owe capital-gains tax (a 1031 exchange can defer both). Figures are a year-1 estimate at your 24.0% rate — not tax advice; consult a CPA.
Schools (NCES district)
- District
- Charlotte
- NCES district ID
- 1200240
- Math proficiency
- 54% ▼ -6.00%
- Reading proficiency
- 54% ▼ -1.00%
- Median HH income
- $44,864
- Composite
- 45.62/100
- National rank
- #2586
- State rank
- #22 of 73 in FL
Livability — North Fort Myers
- Score
- 74/100
- State rank
- #269
- US rank
- #4409
Category grades
Schools grade is shown separately in the Schools card above.
Census & demographics
- County
- Charlotte County · 196,994 people
- City population
- 57,035
- Metro
- Punta Gorda, FL
- Population (ZIP)
- 13,006
- Household income
- $72,443
- Rent vs Own
- Severe rent burden
- 43.0
Population outlook (Charlotte County) Hauer SSP2
- Today (2025)
- 198,646 people
- By 2030
- 210,507 · +6.0%
- By 2040
- 230,857 · +16.2%
- By 2050
- 247,148 · +24.4%
- By 2075
- 281,777 · +41.8%
- By 2100
- 293,609 · +47.8%
Race, ethnicity, and origin ACS 2023
- Neighborhood character
- Predominantly White (81%)
- Race & ethnicity
- White 81% Two or more races 8% Hispanic / Latino 7% Black 7%
- Hispanic origin (detail)
- Puerto Rican 2% Cuban 3%
- Common ancestry
- Lithuanian 3% Iranian 3% Slovak 3%
- Foreign-born
- 6% · Canada, Jamaica
- Languages at home
- 93% English-only · Spanish 5% German/W. Germanic 1% Arabic 1%
Political lean MEDSL · Charlotte
- 2024 margin
- Solid R (+34.0) · D 32.7% · R 66.7%
- 2008→2024 swing
- -26.7pp toward R · 2008: -7.2pp · 2024: -34.0pp
- All cycles
- 2024: R+34.0 2020: R+26.6 2016: R+27.8 2012: R+14.3 2008: R+7.2
Not yet ingested
- Civics
- —
Market trends
- HPI YoY
- ▼ -5.25%
- Current HPI
- 448.5895
- Rent YoY
- ▲ 4.13%
- Metro
- Punta Gorda, FL
- State GDP YoY
- ▲ 3.28%
- F500 in state
- 36
Industry mix (Fortune 500 HQ in FL)
| Industry | F500 HQs | Revenue |
|---|---|---|
| Industrial Technology | 2 | $29B |
|
||
| Insurance | 2 | $17B |
|
||
| Retail | 1 | $60B |
|
||
| Technology Distribution | 1 | $58B |
|
||
| Homebuilding | 1 | $35B |
|
||
| Technology Manufacturing | 1 | $35B |
|
||
Cash-flow waterfall
monthlySold comps — $/sqft
last 12 mo · ≤1 miLoading sold comps…