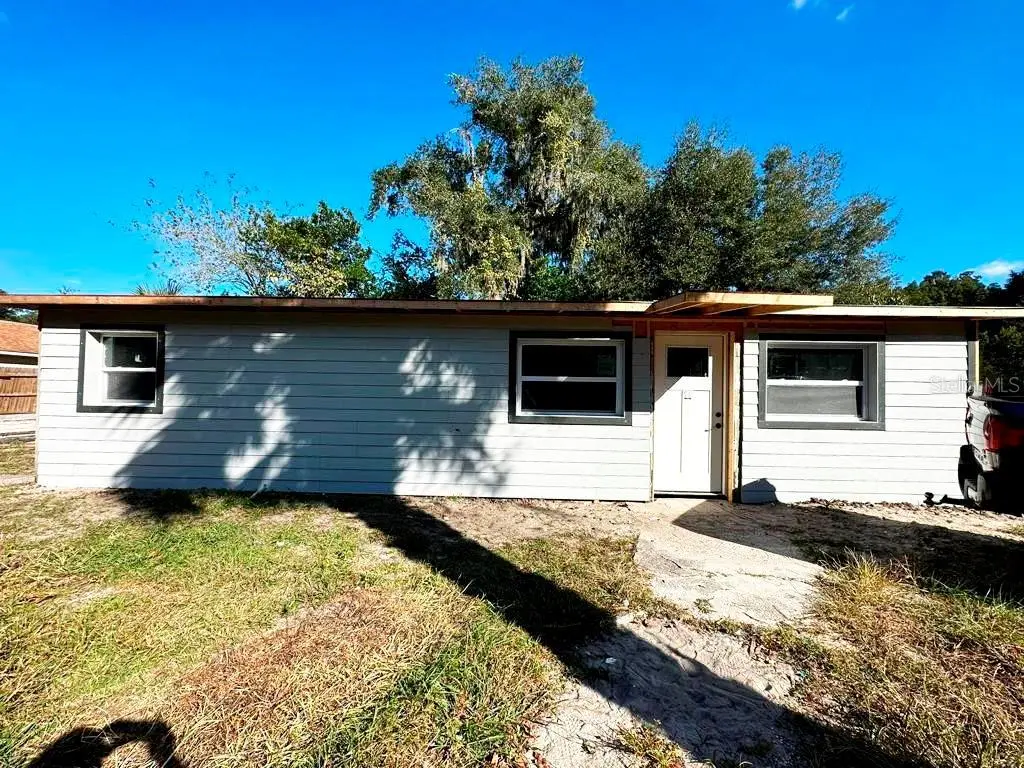
921 S Salisbury Ave · DeLand Southwest, FL
Flood risk 1/10 · Minimal
- FEMA flood zone
- X (unshaded)
- Chance of flooding over 30 yrs
- 0.0%
- Est. flood insurance / yr
- $507 – $1,088
Fire risk 2/10 · Minimal
- Est. fire insurance / yr
- $947 – $1,759
Heat risk 9/10 · Severe
- Hot days now (above 107°F)
- 7 days/yr
- Hot days in 30 yrs
- 20 days/yr
Wind risk 9/10 · Severe
- Chance of severe wind over 30 yrs
- 99.0%
Air-quality risk 2/10 · Minimal
- Unhealthy air days now
- 1 days/yr
- Unhealthy air days in 30 yrs
- 1 days/yr
Risk factors via First Street. Map © Google.
Why this score? — see what drove the C+ grade
The composite is a weighted blend of 9 inputs, each scored 0–100. Each bar is that input's sub-score; the figure is the points it added to the 100-point composite (weight × sub-score).
- Cash flow +26.4/30.0
- DSCR +9.0/10.0
- ARV discount +7.5/15.0
- 1% rule +7.4/10.0
- Schools +3.9/10.0
- Livability +3.6/5.0
- Rent growth +3.3/5.0
- Condition / age +2.5/5.0
- Appreciation +0.0/10.0
$135,000
🖨 Deal sheet (PDF) 📄 Offer letter ✓ Due diligence
Listing remarks MLS
Great opportunity for investors! This home, located in the charming historic downtown area of DeLand, is ready to be remodeled and put up for sale. With a minimal investment, you can transform this property into a source of passive income or resell it for a great profit. Enjoy its proximity to restaurants, shops, and public transportation, making it an even more attractive investment. Don’t miss this opportunity before it’s gone!
Key facts
- Proximity to shops
- 7,236 sq ft lot
- Built 1957
Tags
Neighborhood map
What this means for you Summary
Snapshot
- This is a 3-bed/1.0-bath single-family listed at $135k.
Deal economics
- At list price, monthly cash flow is $355 ($4k/yr) — positive.
- The deal already cash-flows at list — no discount required.
- Meets the 1% rule at list price ($2k rent vs $135k).
- Recommended offer: $119k (12.0% below list) — sets the bar for market timing.
Location & tenants
- Location reads 72/100 on livability (#331 in FL) — a middle-class / working-renter tenant base. Strengths: crime A+, cost of living A+, housing A+; Watch: schools F, amenities F, commute F.
- Volusia (suburban): math 44% / reading 49% proficiency, ranked #47 of 73 in FL (top 64%) — families likely to look elsewhere, expect single-tenant / working-renter base with shorter leases.
- Market conditions: Rents rising (+3.4%/yr); 437 active listings in the ZIP; 11 comparable units currently listed for rent nearby; rentals at typical pace (median 24d on market — plan ~3-4 weeks tenant-placement turnaround); 3,402 units permitted in Volusia County in 2024 (681 in 5+ unit buildings).
Forward outlook
- Local home prices are declining (-3.0%/yr); year-one equity from $933 of loan paydown is wiped out by about $4k of value loss. Plan a longer hold.
- Volusia County population projected at +19% by 2050 — long-run rental-demand tailwind backs the buy-and-hold thesis.
- At projected returns (-3.0% appreciation + 3.4% rent growth), your $38k cash investment doubles in ~10 years — after that, you're playing with house money.
Negotiation context
- It's been on market 337 days — a 12% lower offer ($119k) is reasonable based on typical stale-listing flexibility.
- 6 sale attempts since 12y ago; this cycle's ask has dropped $25k (16%) from the opening price — seller is motivated, your offer sets the floor, not the list.
Risks & watch-outs
- Watch-outs: built in 1957 — expect roof / HVAC / electrical / plumbing capex.
- Climate carrying-cost: severe wind risk, 99% chance of damaging wind over 30y; extreme-heat days projected 7→20/yr by 2055 (HVAC capex compounding) — expect insurance premiums to compound above CPI over the hold.
Questions for the listing agent
- It's been on market 337 days. Have you received any prior offers? Is the seller open to a 12% concession, seller financing, or rate buy-down credit?
- Built in 1957 — when were the roof, HVAC, electrical panel, plumbing, and water heater last replaced?
- Why hasn't it sold? Are there any deal-killer items the seller is aware of (foundation, flood, title, zoning, code violations)?
- Is there a deadline driving the sale (1031 exchange, divorce, estate, relocation)? That informs how much negotiation room exists.
- Schools are F-rated, which usually means shorter tenancies and higher turnover. Who's the typical renter profile here, and what's been the actual vacancy rate?
- What's the average days-on-market for RENTAL listings here right now (not sales)? A rising rental-DOM trend means longer vacancies and softer asking-rent achievability than the comps imply.
- What's the recent tenant-quality profile in this submarket — average credit score on applications, eviction rate, late-payment / NSF rate, and stable-employment percentage? A property-management company in the area should have these aggregated.
- How much new for-sale + rental construction is in the pipeline within 1–3 miles? Heavy new supply typically softens prices + rents 12–24 months out; constrained supply supports both.
Investment metrics
- 1% rule
- 1.24% ✓
- Cap rate
- 9.45%
- Cash-on-cash
- 11.26%
- DSCR
- 1.50
- GRM
- 6.7
CMA / ARV
No comps found within radius.
Projected returns pro-forma
-3.0% appreciation · 3.36% rent growth · sell at horizon
- IRR
- 0.9%
- Equity multiple
- 1.04×
- Total profit
- $1,368
- Equity at exit
- $20,129
- IRR
- 11.0%
- Equity multiple
- 1.87×
- Total profit
- $32,992
- Equity at exit
- $11,672
Cash invested: $37,800 (down + closing). Projections, not guarantees.
Landlord ↔ Tenant lean methodology
- Overall (STATE)
- 87 Strongly Landlord-Friendly
- State Florida
- 87 Strongly Landlord-Friendly · R+3
- County
- — inherits STATE
- City
- — inherits STATE
ZIP-level market 32720
- Rents YoY
- 3.4%
- Active inventory
- 437
- Price-to-rent
- 6.7×
Monthly cashflow live
- Estimated rent
- $1,677 high interval (Pro) →
- Mortgage (P&I)
- −$708
- Tax from tax record
- −$206 /mo · $2,475/yr
- Insurance
- −$56
- HOA
- −$0
- Vacancy / Maint / Mgmt
- −$352
- Net cashflow
- $355
Break-even live
Sensitivity live
| Price | -10% $431 | -5% $393 | +0% $355 | +5% $316 | +10% $278 |
|---|---|---|---|---|---|
| Rent | -10% $222 | -5% $288 | +0% $355 | +5% $421 | +10% $487 |
| Rate | -1.0pp $423 | -0.5pp $389 | base $355 | +0.5pp $320 | +1.0pp $284 |
UW: 25.0% down · 7.5% · 30yr · 1.5% tax · 5.0% vac · 8.0% maint · 8.0% mgmt
Financing live
Cash to close
- Down payment
- $33,750
- Closing costs
- $4,050
- Reserves months
- —
- Total cash needed
- —
Loan-product check · same deal, 3 products live
Conventional
25% down · 7.5% · 30yr
- Down + closing
- —
- Monthly P&I
- —
- Monthly cashflow
- —
- DSCR
- —
- Eligible?
- —
Personal DTI + credit; lowest rate.
DSCR
20% down · 8.5% · 30yr
- Down + closing
- —
- Monthly P&I
- —
- Monthly cashflow
- —
- DSCR
- —
- Eligible?
- —
No personal income docs; deal must DSCR.
Hard money
10% down · 12.0% · 12mo
- Down + closing
- —
- Monthly P&I
- —
- Monthly cashflow
- —
- DSCR
- —
- Eligible?
- —
Short-term bridge; refi at stabilization.
Rent comps 11 comps
| Address | Beds | Baths | Sqft | Rent | $/sqft | DOM | Units | Dist |
|---|---|---|---|---|---|---|---|---|
| 703 W Chelsea St Deland, FL | 3.0 | 2.0 | 1000 | $1,695 | $1.70 | 15d | 1 | 0.23mi |
| 737 S Stone St Deland, FL | 3.0 | 1.5 | 1050 | $1,695 | $1.61 | 24d | 1 | 0.32mi |
| 1312 Water Willow Dr DeLand, FL | 1.0–2.0 | 1.0–2.0 | 785 | $1,324 | $1.69 | 24d | 1 | 0.64mi |
| 821 Margaret St Apt A DeLand, FL | 2.0 | 2.0 | 810 | $1,450 | $1.79 | 24d | 1 | 0.66mi |
| 1516 S Boundary St Deland, FL | 2.0 | 1.0 | 1076 | $1,650 | $1.53 | 21d | 1 | 0.81mi |
| 125 S Salisbury Ave Deland, FL | 2.0 | 1.0 | 625 | $1,200 | $1.92 | 15d | 2 | 1.04mi |
| 125 S Salisbury Ave Unit B4 DeLand, FL | 2.0 | 1.0 | 800 | $1,200 | $1.50 | 24d | 1 | 1.04mi |
| 119 N Orange Ave Unit 2B DeLand, FL | 2.0 | 1.0 | 827 | $1,100 | $1.33 | 24d | 1 | 1.14mi |
| 916 W New York Ave Deland, FL | 1.0–2.0 | 1.0 | 700 | $1,245 | $1.78 | 15d | 2 | 1.15mi |
| 240 E Howry Ave DeLand, FL | 2.0 | 1.0 | 816 | $1,500 | $1.84 | 24d | 1 | 1.31mi |
| 400 E Howry Ave Deland, FL | 1.0–2.0 | 1.0–2.0 | 956 | $1,995 | $2.09 | 11d | 25 | 1.39mi |
Listing history 38 events
-
2026-06-18days on market $135,000 Active 337 DOM
-
2026-06-17days on market $135,000 Active 336 DOM
-
2026-06-16days on market $135,000 Active 335 DOM
-
2026-06-15days on market $135,000 Active 334 DOM
-
2026-06-14days on market $135,000 Active 332 DOM
-
2026-06-10days on market $135,000 Active 329 DOM
-
2026-06-09days on market $135,000 Active 328 DOM
-
2026-06-08days on market $135,000 Active 327 DOM
-
2026-06-07days on market $135,000 Active 326 DOM
-
2026-06-05days on market $135,000 Active 323 DOM
-
2026-06-03days on market $135,000 Active 322 DOM
-
2026-06-03days on market $135,000 Active 321 DOM
-
2026-06-01days on market $135,000 Active 320 DOM
-
2026-05-31days on market $135,000 Active 319 DOM
-
2026-05-31days on market $135,000 Active 318 DOM
-
2026-01-03price $135,000 445-char remark
Show marketing remark (445 chars)
Great opportunity for investors! This home, located in the charming historic downtown area of DeLand, is ready to be remodeled and put up for sale. With a minimal investment, you can transform this property into a source of passive income or resell it for a great profit. Enjoy its proximity to restaurants, shops, and public transportation, making it an even more attractive investment. Don’t miss this opportunity before it’s gone!
-
2025-10-09price $145,000 445-char remark
Show marketing remark (445 chars)
Great opportunity for investors! This home, located in the charming historic downtown area of DeLand, is ready to be remodeled and put up for sale. With a minimal investment, you can transform this property into a source of passive income or resell it for a great profit. Enjoy its proximity to restaurants, shops, and public transportation, making it an even more attractive investment. Don’t miss this opportunity before it’s gone!
-
2025-07-16$160,000 Active 445-char remark
Show marketing remark (445 chars)
Great opportunity for investors! This home, located in the charming historic downtown area of DeLand, is ready to be remodeled and put up for sale. With a minimal investment, you can transform this property into a source of passive income or resell it for a great profit. Enjoy its proximity to restaurants, shops, and public transportation, making it an even more attractive investment. Don’t miss this opportunity before it’s gone!
-
2024-12-07price $195,000
-
2024-10-31$200,000 Active
-
2024-05-24soldstatus $135,000
-
2024-05-15soldstatus $110,000 Closed
-
2024-04-15status Pending
-
2024-01-31price $150,000
-
2023-12-22$199,000 Active
-
2023-07-19soldstatus $145,900
-
2023-07-18soldstatus $132,000
-
2023-07-10soldstatus $132,000 Closed
-
2023-06-23status Pending
-
2023-06-16$149,000 Active
-
2015-02-09soldstatus $17,000 Sold
-
2015-01-12status Pending
-
2015-01-09$20,000 Active
-
2014-07-21soldstatus $17,000
-
2014-07-02historical
-
2014-05-23$17,900
-
1998-06-05soldstatus $30,000
-
1995-04-21soldstatus $11,000
ⓘ Source: listings_history table (triggers on properties + properties_extension) + one-shot
backfill from property_details.listing_events for pre-trigger history.
Tax reassessment forecast FL · Resets to sale price
- Current annual tax
- $2,475 · $206/mo
- Projected year-2 tax
- $2,475 · $206/mo
- Expected delta
- $0/yr ($0/mo · 0.0%)
ⓘ Screening estimate from a state-policy table — verify with the county assessor before closing.
Climate risk First Street
- Flood 1/10 Low FEMA zone X (unshaded) · 0% chance over 30 yrs
- Wildfire 2/10 Low
- Heat 9/10 Extreme 7 d/yr ≥107°F today · 20 d/yr by 30 yrs out
- Wind 9/10 Extreme 99% chance of damaging wind over 30 yrs
- Air quality 2/10 Low 1 unhealthy d/yr today · 1 by 30 yrs out
Nearby sold comps map
Loading sold comps map…
Walkable amenities ~0.75 mi
Loading nearby amenities…
Taxation est. · year 1
- Rental income
- $20,127
- − Mortgage interest
- −$7,562
- − Property taxes
- −$2,475
- − Insurance
- −$675
- − Repairs & maintenance
- −$1,610
- − Management
- −$1,610
- − Depreciation
- −$3,927
- Taxable income
- $2,268
- Est. tax owed @ 24.0%
- −$544
- After-tax cash flow
- $3,711/yr
For passive investors: Depreciation is non-cash, so a rental often shows a tax loss while cash-flowing — sheltering income. Rental losses are passive: they offset passive income freely, and up to $25,000/yr can offset ordinary (W-2) income if you actively participate and your MAGI is under $100k (phasing out to $0 by $150k); unused losses carry forward. On sale, claimed depreciation is recaptured at up to 25%, and gains may owe capital-gains tax (a 1031 exchange can defer both). Figures are a year-1 estimate at your 24.0% rate — not tax advice; consult a CPA.
Schools (NCES district)
- District
- Volusia
- NCES district ID
- 1201920
- Math proficiency
- 44% ▼ -9.00%
- Reading proficiency
- 49% ▼ -3.00%
- Median HH income
- $42,946
- Composite
- 39.2/100
- National rank
- #4019
- State rank
- #47 of 73 in FL
Livability — DeLand Southwest
- Score
- 72/100
- State rank
- #331
- US rank
- #5773
Category grades
Schools grade is shown separately in the Schools card above.
Census & demographics
- Census place
- DeLand Southwest, FL
- County
- Volusia County · 556,871 people
- Metro
- Deltona-Daytona Beach-Ormond Beach, FL
- Population (ZIP)
- 36,259
- Household income
- $68,830
- Rent vs Own
- Severe rent burden
- 1145.0
Population outlook (Volusia County) Hauer SSP2
- Today (2025)
- 572,749 people
- By 2030
- 598,695 · +4.5%
- By 2040
- 644,880 · +12.6%
- By 2050
- 681,451 · +19.0%
- By 2075
- 759,957 · +32.7%
- By 2100
- 778,902 · +36.0%
Race, ethnicity, and origin ACS 2023
- Neighborhood character
- Majority White (64%)
- Race & ethnicity
- White 64% Hispanic / Latino 21% Black 11% Two or more races 9%
- Hispanic origin (detail)
- Mexican 6% Puerto Rican 9% Cuban 3%
- Common ancestry
- Lithuanian 1% Slovak 1% Serbian 1%
- Foreign-born
- 7% · Canada, Jamaica, Vietnam
- Languages at home
- 85% English-only · Spanish 13%
Political lean MEDSL · Volusia
- 2024 margin
- Strong R (+21.8) · D 38.7% · R 60.5%
- 2008→2024 swing
- -27.4pp toward R · 2008: 5.7pp · 2024: -21.8pp
- All cycles
- 2024: R+21.8 2020: R+14.1 2016: R+13.1 2012: R+1.2 2008: D+5.7
Not yet ingested
- Civics
- —
Market trends
- HPI YoY
- ▼ -194.54%
- Current HPI
- 330.7324
- Rent YoY
- ▲ 3.36%
- Metro
- Deltona-Daytona Beach-Ormond Beach, FL
- State GDP YoY
- ▲ 3.28%
- F500 in state
- 36
Industry mix (Fortune 500 HQ in FL)
| Industry | F500 HQs | Revenue |
|---|---|---|
| Industrial Technology | 2 | $29B |
|
||
| Insurance | 2 | $17B |
|
||
| Retail | 1 | $60B |
|
||
| Technology Distribution | 1 | $58B |
|
||
| Homebuilding | 1 | $35B |
|
||
| Technology Manufacturing | 1 | $35B |
|
||
Price history
+1127.3% since first listed23 events — show timeline
- 2026-01-03 Price Changed $135,000 Stellar MLS as Distributed by MLS Grid
- 2025-10-09 Price Changed $145,000 Stellar MLS as Distributed by MLS Grid
- 2025-07-16 Listed $160,000 Stellar MLS as Distributed by MLS Grid
- 2024-12-07 Price Changed $195,000 Stellar MLS as Distributed by MLS Grid
- 2024-10-31 Listed $200,000 Stellar MLS as Distributed by MLS Grid
- 2024-05-24 Sold (Public Records) $135,000 Public Records
- 2024-05-15 Sold (MLS) $110,000 Stellar MLS as Distributed by MLS Grid
- 2024-04-15 Pending — Stellar MLS as Distributed by MLS Grid
- 2024-01-31 Price Changed $150,000 Stellar MLS as Distributed by MLS Grid
- 2023-12-22 Listed $199,000 Stellar MLS as Distributed by MLS Grid
- 2023-07-19 Sold (Public Records) $145,900 Public Records
- 2023-07-18 Sold (Public Records) $132,000 Public Records
- 2023-07-10 Sold (MLS) $132,000 Stellar MLS as Distributed by MLS Grid
- 2023-06-23 Pending — Stellar MLS as Distributed by MLS Grid
- 2023-06-16 Listed $149,000 Stellar MLS as Distributed by MLS Grid
- 2015-02-09 Sold (MLS) $17,000 Stellar MLS as Distributed by MLS Grid
- 2015-01-12 Pending — Stellar MLS as Distributed by MLS Grid
- 2015-01-09 Listed $20,000 Stellar MLS as Distributed by MLS Grid
- 2014-07-21 Sold (MLS) $17,000 Stellar MLS as Distributed by MLS Grid
- 2014-07-02 Listing Removed — Stellar MLS as Distributed by MLS Grid
- 2014-05-23 Listed $17,900 Stellar MLS as Distributed by MLS Grid
- 1998-06-05 Sold (Public Records) $30,000 Public Records
- 1995-04-21 Sold (Public Records) $11,000 Public Records
Property tax history
+11.4%/yrLatest (2025): $2,475 · -2.7% YoY. Source: county tax records.
Cash-flow waterfall
monthlySold comps — $/sqft
last 12 mo · ≤1 miLoading sold comps…