4777 Airport Rd · Pearcy, AR
Flood risk 1/10 · Minimal
- FEMA flood zone
- X (unshaded)
- Chance of flooding over 30 yrs
- 0.0%
- Est. flood insurance / yr
- $507 – $1,088
Fire risk 5/10 · Moderate
- Est. fire insurance / yr
- $1,499 – $2,785
Heat risk 5/10 · Moderate
- Hot days now (above 109°F)
- 7 days/yr
- Hot days in 30 yrs
- 18 days/yr
Wind risk 3/10 · Minor
- Chance of severe wind over 30 yrs
- 7.0%
Air-quality risk 1/10 · Minimal
- Unhealthy air days now
- 0 days/yr
- Unhealthy air days in 30 yrs
- 0 days/yr
Risk factors via First Street. Map © Google.
Why this score? — see what drove the D grade
The composite is a weighted blend of 9 inputs, each scored 0–100. Each bar is that input's sub-score; the figure is the points it added to the 100-point composite (weight × sub-score).
- ARV discount +15.0/15.0
- Appreciation +10.0/10.0
- Cash flow +4.4/30.0
- Schools +3.6/10.0
- Rent growth +2.5/5.0
- Livability +2.5/5.0
- Condition / age +2.5/5.0
- 1% rule +0.5/10.0
- DSCR +0.0/10.0
$200,000
🖨 Deal sheet (PDF) 📄 Offer letter ✓ Due diligence
Listing remarks MLS
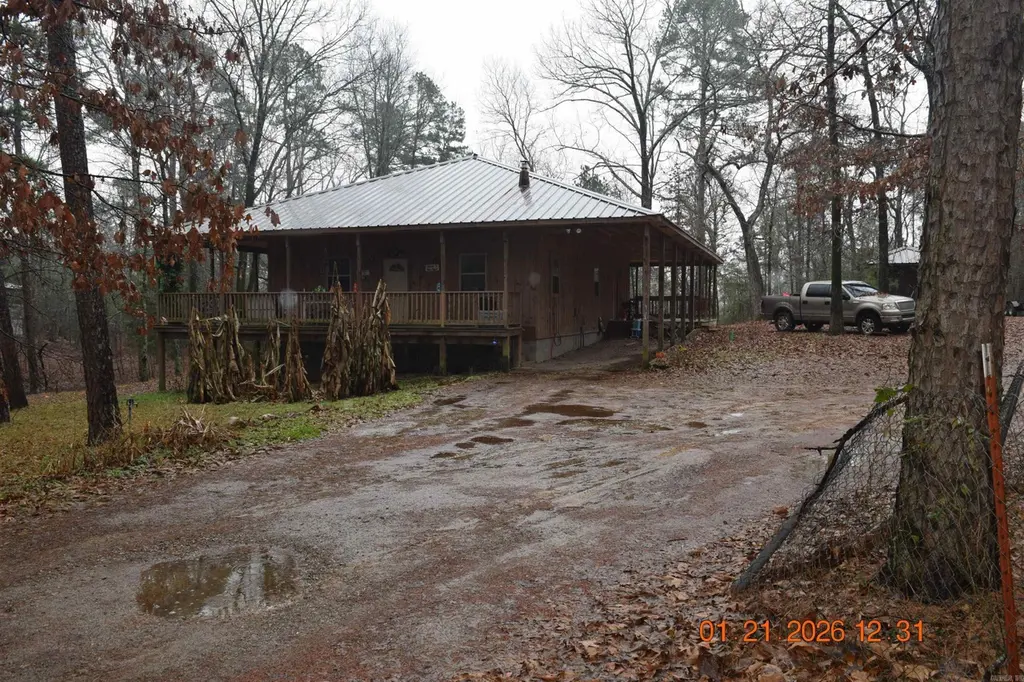
2-bedroom, 2-bath home situated on approximately 4 +/- acres, with final acreage to be determined by survey. The property also includes an unfinished tiny home, offering additional space and potential for future use. Multiple purchase options are available. Buyers may purchase this home with approximately 4 +/- acres, purchase the adjoining approximately 4 +/- acres that include a second 2-bedroom, 2-bath home, or purchase the entire parcel. For information regarding the purchase of the entire parcel, see MLS #153910. The current tax amount is based on a larger parcel that includes multiple properties. Taxes are expected to be adjusted following the survey and division of the property. Acreage amounts are approximate and subject to survey
Key facts
- Rural residential
- 4 acre lot
- Built 2006
Tags
Property features AI
Finance
- Other: Approximately 4 acres (4+/- acres); Road access includes dirt and paved surfaces
Exterior
- Parking: Other parking (see remarks)
- Utilities: Septic; Public water; Well; Municipal electric service (Entergy and other); Insulated windows
- Home design: Frame construction; Crawl space foundation
- Construction: Metal roof
- Exterior features: Deck; Porch; Partially fenced yard; Outside storage area; Sloped and level areas; Not in a subdivision
Interior
- Kitchen: Free‑standing stove; Electric range
- Flooring: Wood flooring; Tile flooring
- Bathrooms: 2 full bathrooms
- Heating & cooling: Central electric heating; Central electric cooling
- Interior features: Electric water heater; Ceiling fans; Sheetrock walls/ceilings
Neighborhood map
What this means for you Summary
Snapshot
- This is a 2-bed/2.0-bath single-family listed at $200k.
Deal economics
- At list price, monthly cash flow is $-525 ($-6k/yr) — negative.
- To cash-flow at today's rent, offer at most $107k (46.3% below list).
- To meet the 1% rule (rent ≥ 1% of price), the offer needs to be $110k (45.1% below list).
- Recommended offer: $107k (46.3% below list) — sets the bar for cash-flow.
- Cap rate 3.1% vs local median 2.3% in Pearcy — top-decile yield for the area; either an underpriced asset or a hidden risk that comps aren't pricing in. Stress-test before assuming the spread holds.
Location & tenants
- Location reads: area grade D — affects rentability + tenant quality, not the cash-flow math above.
- Lake Hamilton School District (rural): math 41% / reading 43% proficiency, ranked #54 of 238 in AR (top 23%) — families likely to look elsewhere, expect single-tenant / working-renter base with shorter leases.
- Zoned schools: Lake Hamilton Primary School (666 students, 69% FRL); Lake Hamilton Middle School (math 30% / reading 37%, grade F, #129 of 201 statewide, top 64%, 631 students, 66% FRL); Lake Hamilton High School (math 27% / reading 37%, grade F, #119 of 292 statewide, top 43%, 936 students, 59% FRL) — zoned schools average 64% FRL vs 45% district-wide (20 pts higher); higher-poverty schools than district average — tighter screening recommended.
- Market conditions: 18 active listings in the ZIP; 117 units permitted in Garland County in 2024 (24 in 5+ unit buildings).
Forward outlook
- In year one you build about $21k of equity ($1k loan paydown + $20k appreciation (10.0% local appreciation)).
- Garland County population projected at +7% by 2050 — modest demand growth; plan on rents tracking national, not racing it.
- By year 2, paydown + projected appreciation supports a ~$34k cash-out refi (75% LTV) — recoverable capital for the next deal without selling this one.
Negotiation context
- Only 11 days on market — expect competitive offers; lowballing is unlikely to land.
- 4 sale attempts with the ask held roughly flat each time — persistent listings suggest the price (not the market) is what's stuck; bring a comps-based counter.
Risks & watch-outs
- Climate carrying-cost: moderate wildfire risk; extreme-heat days projected 7→18/yr by 2055 (HVAC capex compounding) — expect insurance premiums to compound above CPI over the hold.
Questions for the listing agent
- What do current leases actually rent for vs. the listed asking? Can we see a recent rent roll and the last 12 months of T-12 income?
- Is there a deadline driving the sale (1031 exchange, divorce, estate, relocation)? That informs how much negotiation room exists.
- The area grade is low — what's the realistic commute time and amenity access for the typical tenant pool here? Any planned neighborhood developments (good or bad) we should know about?
- What's the average days-on-market for RENTAL listings here right now (not sales)? A rising rental-DOM trend means longer vacancies and softer asking-rent achievability than the comps imply.
- What's the recent tenant-quality profile in this submarket — average credit score on applications, eviction rate, late-payment / NSF rate, and stable-employment percentage? A property-management company in the area should have these aggregated.
- How much new for-sale + rental construction is in the pipeline within 1–3 miles? Heavy new supply typically softens prices + rents 12–24 months out; constrained supply supports both.
Investment metrics
- 1% rule
- 0.55% ✗
- Cap rate
- 3.14%
- Cash-on-cash
- -11.24%
- DSCR
- 0.50
- GRM
- 15.2
CMA / ARV
- ARV (median comp)
- $254,000
- List price
- $200,000
- Delta
- 67.72%
- Verdict
- OVERPRICED
- Comps
- 5 within 1.0 mi
Projected returns pro-forma
10.0% appreciation · 3.0% rent growth · sell at horizon
- IRR
- 16.4%
- Equity multiple
- 2.35×
- Total profit
- $75,532
- Equity at exit
- $180,176
- IRR
- 15.7%
- Equity multiple
- 5.44×
- Total profit
- $248,752
- Equity at exit
- $388,556
Cash invested: $56,000 (down + closing). Projections, not guarantees.
Landlord ↔ Tenant lean methodology
- Overall (STATE)
- 92 Strongly Landlord-Friendly
- State Arkansas
- 92 Strongly Landlord-Friendly · R+14
- County
- — inherits STATE
- City
- — inherits STATE
ZIP-level market 71964
- Home prices YoY
- 25.8%
- Active inventory
- 18
- Price-to-rent
- 15.2×
Monthly cashflow live
- Estimated rent
- $1,098 medium interval (Pro) →
- Mortgage (P&I)
- −$1,049
- Tax from tax record
- −$260 /mo · $3,115/yr
- Insurance
- −$83
- HOA
- −$0
- Vacancy / Maint / Mgmt
- −$230
- Net cashflow
- $-525
Break-even live
Sensitivity live
| Price | -10% $-411 | -5% $-468 | +0% $-525 | +5% $-581 | +10% $-638 |
|---|---|---|---|---|---|
| Rent | -10% $-611 | -5% $-568 | +0% $-525 | +5% $-481 | +10% $-438 |
| Rate | -1.0pp $-424 | -0.5pp $-474 | base $-525 | +0.5pp $-576 | +1.0pp $-629 |
UW: 25.0% down · 7.5% · 30yr · 1.5% tax · 5.0% vac · 8.0% maint · 8.0% mgmt
Financing live
Cash to close
- Down payment
- $50,000
- Closing costs
- $6,000
- Reserves months
- —
- Total cash needed
- —
Loan-product check · same deal, 3 products live
Conventional
25% down · 7.5% · 30yr
- Down + closing
- —
- Monthly P&I
- —
- Monthly cashflow
- —
- DSCR
- —
- Eligible?
- —
Personal DTI + credit; lowest rate.
DSCR
20% down · 8.5% · 30yr
- Down + closing
- —
- Monthly P&I
- —
- Monthly cashflow
- —
- DSCR
- —
- Eligible?
- —
No personal income docs; deal must DSCR.
Hard money
10% down · 12.0% · 12mo
- Down + closing
- —
- Monthly P&I
- —
- Monthly cashflow
- —
- DSCR
- —
- Eligible?
- —
Short-term bridge; refi at stabilization.
Listing history 21 events
-
2026-06-21days on market $200,000 Active 11 DOM
-
2026-06-19days on market $200,000 Active 9 DOM
-
2026-06-18days on market $200,000 Active 8 DOM
-
2026-06-17statusdays on market $200,000 Active 7 DOM
-
2026-06-16days on market $200,000 New Listing 6 DOM
-
2026-06-15days on market $200,000 New Listing 5 DOM
-
2026-06-14days on market $200,000 New Listing 3 DOM
-
2026-06-13remarks 699-char remark
-
2026-06-13pricestatusdays on market $200,000 New Listing 2 DOM
-
2026-06-10days on market $426,000 Active 140 DOM
Show marketing remark (749 chars)
2-bedroom, 2-bath home situated on approximately 4 +/- acres, with final acreage to be determined by survey. The property also includes an unfinished tiny home, offering additional space and potential for future use. Multiple purchase options are available. Buyers may purchase this home with approximately 4 +/- acres, purchase the adjoining approximately 4 +/- acres that include a second 2-bedroom, 2-bath home, or purchase the entire parcel. For information regarding the purchase of the entire parcel, see MLS #153910. The current tax amount is based on a larger parcel that includes multiple properties. Taxes are expected to be adjusted following the survey and division of the property. Acreage amounts are approximate and subject to survey
-
2026-06-09days on market $426,000 Active 139 DOM
-
2026-06-08days on market $426,000 Active 138 DOM
-
2026-06-07days on market $426,000 Active 137 DOM
-
2026-06-05days on market $426,000 Active 134 DOM
-
2026-06-03days on market $426,000 Active 133 DOM
-
2026-06-02days on market $426,000 Active 132 DOM
-
2026-06-01days on market $426,000 Active 131 DOM
-
2026-05-31days on market $426,000 Active 130 DOM
-
2026-05-30days on market $426,000 Active 129 DOM
-
2026-01-21$426,000 New Listing 685-char remark
Show marketing remark (685 chars)
Unique opportunity consisting of three separate properties being sold together. Two frame houses are included, both currently rented. An additional unfinished tiny home is on one of the properties and is dried-in, offering future potential. Improvements include metal roofs, Kimzey water service plus a private well, and all-electric utilities. An older mobile home remains on-site; the owner had intended for it to be removed, but it may provide additional rental or storage possibilities, subject to buyer verification. Multiple structures across the properties allow for flexible use and income potential. Buyers to verify property boundaries, utilities, zoning, and permitted uses.
-
2026-01-21$426,000 Active 685-char remark
Show marketing remark (685 chars)
Unique opportunity consisting of three separate properties being sold together. Two frame houses are included, both currently rented. An additional unfinished tiny home is on one of the properties and is dried-in, offering future potential. Improvements include metal roofs, Kimzey water service plus a private well, and all-electric utilities. An older mobile home remains on-site; the owner had intended for it to be removed, but it may provide additional rental or storage possibilities, subject to buyer verification. Multiple structures across the properties allow for flexible use and income potential. Buyers to verify property boundaries, utilities, zoning, and permitted uses.
ⓘ Source: listings_history table (triggers on properties + properties_extension) + one-shot
backfill from property_details.listing_events for pre-trigger history.
Tax reassessment forecast AR · Resets to sale price
- Current annual tax
- $3,115 · $260/mo
- Projected year-2 tax
- $3,115 · $260/mo
- Expected delta
- $0/yr ($0/mo · 0.0%)
ⓘ Screening estimate from a state-policy table — verify with the county assessor before closing.
Climate risk First Street
- Flood 1/10 Low FEMA zone X (unshaded) · 0% chance over 30 yrs
- Wildfire 5/10 Major
- Heat 5/10 Major 7 d/yr ≥109°F today · 18 d/yr by 30 yrs out
- Wind 3/10 Moderate 7% chance of damaging wind over 30 yrs
- Air quality 1/10 Low 0 unhealthy d/yr today · 0 by 30 yrs out
Nearby sold comps map
Loading sold comps map…
Walkable amenities ~0.75 mi
Loading nearby amenities…
Taxation est. · year 1
- Rental income
- $13,171
- − Mortgage interest
- −$11,203
- − Property taxes
- −$3,115
- − Insurance
- −$1,000
- − Repairs & maintenance
- −$1,054
- − Management
- −$1,054
- − Depreciation
- −$5,818
- Taxable loss
- −$10,073
- Est. tax savings @ 24.0%
- +$2,417
- After-tax cash flow
- $-3,878/yr
For passive investors: Depreciation is non-cash, so a rental often shows a tax loss while cash-flowing — sheltering income. Rental losses are passive: they offset passive income freely, and up to $25,000/yr can offset ordinary (W-2) income if you actively participate and your MAGI is under $100k (phasing out to $0 by $150k); unused losses carry forward. On sale, claimed depreciation is recaptured at up to 25%, and gains may owe capital-gains tax (a 1031 exchange can defer both). Figures are a year-1 estimate at your 24.0% rate — not tax advice; consult a CPA.
Schools (NCES district)
- District
- Lake Hamilton School District
- NCES district ID
- 0508610
- Math proficiency
- 41% ▼ -15.00%
- Reading proficiency
- 43% ▼ -7.00%
- Median HH income
- $46,223
- Composite
- 35.79/100
- National rank
- #4834
- State rank
- #54 of 238 in AR
Livability — Pearcy
No livability data for this city. (Only ~50 U.S. cities are tracked.)
Census & demographics
- Population (ZIP)
- 4,891
Population outlook (Garland County) Hauer SSP2
- Today (2025)
- 100,343 people
- By 2030
- 101,880 · +1.5%
- By 2040
- 104,804 · +4.4%
- By 2050
- 107,292 · +6.9%
- By 2075
- 113,182 · +12.8%
- By 2100
- 112,247 · +11.9%
Race, ethnicity, and origin ACS 2023
- Neighborhood character
- Predominantly White (94%)
- Race & ethnicity
- White 94% Two or more races 3% Black 1%
- Common ancestry
- Italian 11% Slovak 2% Lithuanian 1%
- Foreign-born
- 1%
- Languages at home
- 99% English-only · German/W. Germanic 1%
Political lean MEDSL · Garland
- 2024 margin
- Solid R (+36.2) · D 30.8% · R 67.0% · Other 2.2%
- 2008→2024 swing
- -11.3pp toward R · 2008: -25.0pp · 2024: -36.2pp
- All cycles
- 2024: R+36.2 2020: R+34.0 2016: R+34.1 2012: R+29.9 2008: R+25.0
Not yet ingested
- Civics
- —
Market trends
- HPI YoY
- ▲ 73.91%
- Current HPI
- 360.0646
- Rent YoY
- —
- Metro
- —
- State GDP YoY
- ▲ 3.80%
- F500 in state
- 10
Industry mix (Fortune 500 HQ in AR)
| Industry | F500 HQs | Revenue |
|---|---|---|
| Retail | 1 | $681B |
|
||
| Food / Agriculture | 1 | $53B |
|
||
| Retail / Energy | 1 | $22B |
|
||
| Transportation / Logistics | 1 | $12B |
|
||
| Energy | 1 | $4B |
|
||
Price history
-53.1% since first listed4 events — show timeline
- 2026-06-10 Listed $200,000 HSBOR
- 2026-06-08 Listed $200,000 CARMLS
- 2026-01-21 Listed $426,000 HSBOR
- 2026-01-21 Listed $426,000 CARMLS
Property tax history
+10.4%/yrLatest (2025): $3,115 · +6.4% YoY. Source: county tax records.
Cash-flow waterfall
monthlySold comps — $/sqft
last 12 mo · ≤1 miLoading sold comps…