425 N Palm Dr #102 · Beverly Hills, CA
Flood risk 5/10 · Moderate
- FEMA flood zone
- X (unshaded)
- Chance of flooding over 30 yrs
- 0.24%
- Est. flood insurance / yr
- $507 – $1,088
Fire risk 1/10 · Minimal
- Est. fire insurance / yr
- $659 – $1,223
Heat risk 6/10 · Moderate
- Hot days now (above 86°F)
- 7 days/yr
- Hot days in 30 yrs
- 21 days/yr
Wind risk 1/10 · Minimal
- Chance of severe wind over 30 yrs
- —
Air-quality risk 5/10 · Moderate
- Unhealthy air days now
- 7 days/yr
- Unhealthy air days in 30 yrs
- 7 days/yr
Risk factors via First Street. Map © Google.
Why this score? — see what drove the D- grade
The composite is a weighted blend of 9 inputs, each scored 0–100. Each bar is that input's sub-score; the figure is the points it added to the 100-point composite (weight × sub-score).
- ARV discount +15.0/15.0
- Appreciation +9.8/10.0
- Schools +5.9/10.0
- Livability +3.7/5.0
- Rent growth +2.9/5.0
- Condition / age +2.5/5.0
- Cash flow +0.0/30.0
- 1% rule +0.0/10.0
- DSCR +0.0/10.0
$3,099,000
🖨 Deal sheet 📄 Offer letter ✓ Due diligence
Listing remarks MLS
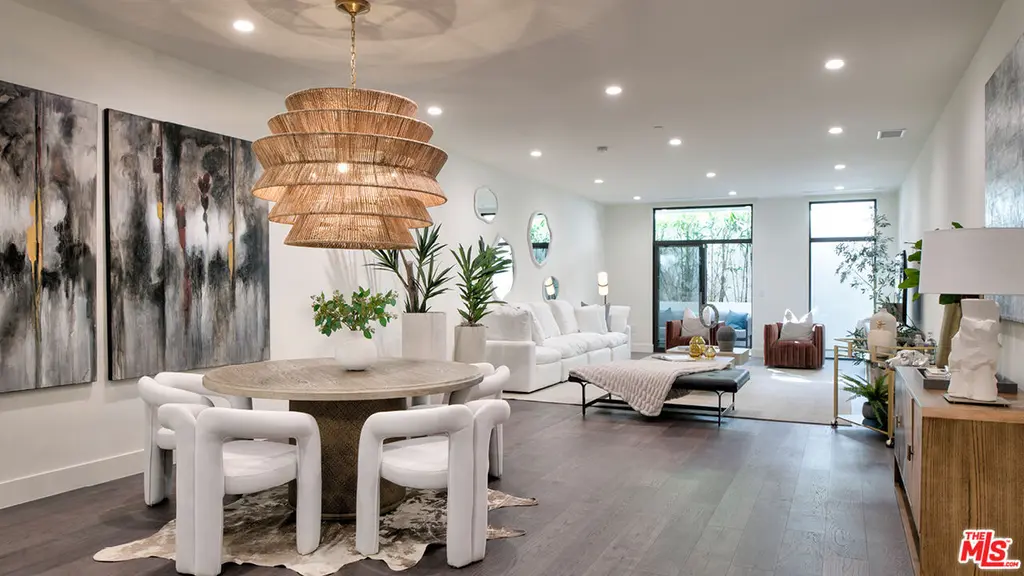
Welcome to 425 Palm in Beverly Hills. Residence 102 offers an expansive 2 bedroom, 2.5 bath floor plan spanning 2,820 interior SF and 330 exterior SF. The thoughtfully designed open-concept layout features a gourmet kitchen that flows effortlessly into the dedicated living and dining rooms, extending to an outdoor patio ideal for indoor-outdoor living. Impeccably designed interior finishes feature Wolf and Sub-Zero appliances, a Miele built-in coffee system, Caesarstone countertops in the kitchen and baths, Italian Gessi fixtures, and custom imported Linea Quattro European cabinetry. The spacious primary suite includes a walk-in closet and a well-appointed bathroom with water closet. Additional highlights include an expansive terrace for entertaining, a dedicated laundry room, and two side-by-side assigned parking spaces. 425 Palm offers an on-site fitness center with top-of-the-line equipment, an outdoor gourmet kitchen, wood decking with sunken spa, a dedicated lobby with 24-hour on-site staff, and controlled access.
Key facts
- Gourmet kitchen
- Outdoor patio
- Expansive terrace
Tags
Neighborhood map
What this means for you Summary
Snapshot
- This is a 2-bed/3.0-bath land listed at $3.10M.
Deal economics
- At list price, monthly cash flow is $-15k ($-184k/yr) — negative.
- To cash-flow at today's rent, offer at most $389k (87.4% below list).
- To meet the 1% rule (rent ≥ 1% of price), the offer needs to be $757k (75.6% below list).
- Recommended offer: $389k (87.4% below list) — sets the bar for cash-flow.
Location & tenants
- Location reads 74/100 on livability (#138 in CA, #4,810 nationally) — a middle-class / working-renter tenant base. Strengths: schools A+, amenities A+, commute A+; Watch: housing C-, health & safety C-, crime F.
- Beverly Hills Unified (suburban): math 57% / reading 73% proficiency, ranked #61 of 517 in CA (top 12%) — acceptable for families but not a draw, mixed tenant base, ~2y average lease; only 7% free/reduced lunch — higher-income household profile.
- Market conditions: Rents rising (+1.7%/yr); 308 active listings in the ZIP; 40 comparable units currently listed for rent nearby; rentals at typical pace (median 25d on market — plan ~3-4 weeks tenant-placement turnaround); 48% of comp listings sitting > 30 days — soft ceiling on asking rent; high-income renter base; 19,697 units permitted in Los Angeles County in 2024 (9,426 in 5+ unit buildings).
- At $7,572/mo this rent would consume 48% of the median local household income ($188k/yr) (locally 911% of renters already pay >50% of income on rent) — very limited rent-growth headroom before tenants either downsize or default.
Forward outlook
- In year one you build about $318k of equity ($21k loan paydown + $296k appreciation (9.6% local appreciation)).
- Los Angeles County population projected at +9% by 2050 — modest demand growth; plan on rents tracking national, not racing it.
- By year 2, paydown + projected appreciation supports a ~$510k cash-out refi (75% LTV) — recoverable capital for the next deal without selling this one.
Negotiation context
- It's been on market 160 days — a 12% lower offer ($2.73M) is reasonable based on typical stale-listing flexibility.
- 4 sale attempts since 2y ago with the ask held roughly flat each time — persistent listings suggest the price (not the market) is what's stuck; bring a comps-based counter.
Risks & watch-outs
- Watch-outs: HOA is 35% of rent.
- Climate carrying-cost: moderate flood risk; extreme-heat days projected 7→21/yr by 2055 (HVAC capex compounding) — expect insurance premiums to compound above CPI over the hold.
Questions for the listing agent
- What do current leases actually rent for vs. the listed asking? Can we see a recent rent roll and the last 12 months of T-12 income?
- It's been on market 160 days. Have you received any prior offers? Is the seller open to a 87% concession, seller financing, or rate buy-down credit?
- What does the HOA fee cover, when was the last increase, and are there any pending special assessments or reserve-fund shortfalls?
- Why hasn't it sold? Are there any deal-killer items the seller is aware of (foundation, flood, title, zoning, code violations)?
- Is there a deadline driving the sale (1031 exchange, divorce, estate, relocation)? That informs how much negotiation room exists.
- Schools are A-rated — typically a magnet for longer-tenancy family renters. What's the average tenant stay here, and is there a school-zone premium baked into asking?
- Crime grade is F in this area — have there been break-ins, vandalism, or insurance claims at this property in the last 3 years? What carrier currently insures it and at what premium?
- The area grade is low — what's the realistic commute time and amenity access for the typical tenant pool here? Any planned neighborhood developments (good or bad) we should know about?
- What's the average days-on-market for RENTAL listings here right now (not sales)? A rising rental-DOM trend means longer vacancies and softer asking-rent achievability than the comps imply.
- What's the recent tenant-quality profile in this submarket — average credit score on applications, eviction rate, late-payment / NSF rate, and stable-employment percentage? A property-management company in the area should have these aggregated.
- How much new for-sale + rental construction is in the pipeline within 1–3 miles? Heavy new supply typically softens prices + rents 12–24 months out; constrained supply supports both.
Investment metrics
- 1% rule
- 0.24% ✗
- Cap rate
- 0.35%
- Cash-on-cash
- -21.22%
- DSCR
- 0.06
- GRM
- 34.1
CMA / ARV
- ARV (median comp)
- $3,720,135
- List price
- $3,099,000
- Delta
- -16.70%
- Verdict
- UNDERPRICED
- Comps
- 20 within 1.0 mi
Projected returns pro-forma
9.56% appreciation · 1.73% rent growth · sell at horizon
- IRR
- 8.5%
- Equity multiple
- 1.70×
- Total profit
- $607,600
- Equity at exit
- $2,692,220
- IRR
- 10.1%
- Equity multiple
- 3.90×
- Total profit
- $2,516,505
- Equity at exit
- $5,703,049
Cash invested: $867,720 (down + closing). Projections, not guarantees.
Landlord ↔ Tenant lean methodology
- Overall (STATE)
- 18 Strongly Tenant-Friendly
- State California
- 18 Strongly Tenant-Friendly · D+13
- County
- — inherits STATE
- City
- — inherits STATE
ZIP-level market 90210
- Home prices YoY
- 2.0%
- Rents YoY
- 1.7%
- Active inventory
- 308
- Price-to-rent
- 34.1×
Monthly cashflow live
- Estimated rent
- $7,572 medium interval (Pro) →
- Mortgage (P&I)
- −$16,251
- Tax from tax record
- −$1,118 /mo · $13,419/yr
- Insurance
- −$1,291
- HOA
- −$2,662
- Vacancy / Maint / Mgmt
- −$1,590
- Net cashflow
- $-15,341
Break-even live
UW: 25.0% down · 7.5% · 30yr · 1.5% tax · 5.0% vac · 8.0% maint · 8.0% mgmt
Financing live
Cash to close
- Down payment
- $774,750
- Closing costs
- $92,970
- Reserves months
- —
- Total cash needed
- —
Loan-product check · same deal, 3 products live
Conventional
25% down · 7.5% · 30yr
- Down + closing
- —
- Monthly P&I
- —
- Monthly cashflow
- —
- DSCR
- —
- Eligible?
- —
Personal DTI + credit; lowest rate.
DSCR
20% down · 8.5% · 30yr
- Down + closing
- —
- Monthly P&I
- —
- Monthly cashflow
- —
- DSCR
- —
- Eligible?
- —
No personal income docs; deal must DSCR.
Hard money
10% down · 12.0% · 12mo
- Down + closing
- —
- Monthly P&I
- —
- Monthly cashflow
- —
- DSCR
- —
- Eligible?
- —
Short-term bridge; refi at stabilization.
Rent comps 40 comps
| Address | Beds | Baths | Sqft | Rent | $/sqft | DOM | Units | Dist |
|---|---|---|---|---|---|---|---|---|
| 450 N Palm Dr Unit 206 Beverly Hills, CA | 3.0 | 3.5 | 2810 | $16,300 | $5.80 | 6d | 1 | 0.12mi |
| 432 N Oakhurst Dr #402 Beverly Hills, CA | 3.0 | 4.0 | 2010 | $11,995 | $5.97 | 17d | 1 | 0.16mi |
| 440 N Oakhurst Dr #301 Beverly Hills, CA | 2.0 | 2.5 | 2040 | $10,900 | $5.34 | 44d | 1 | 0.17mi |
| 324 N Palm Dr #206 Beverly Hills, CA | 3.0 | 2.0 | 2014 | $7,750 | $3.85 | 19d | 1 | 0.27mi |
| 325 N Oakhurst Dr Unit 501 Beverly Hills, CA | 3.0 | 3.5 | 3467 | $10,799 | $3.11 | 44d | 1 | 0.28mi |
| 138 N Almont Dr West Hollywood, CA | 3.0 | 2.0 | 2000 | $7,800 | $3.90 | 44d | 1 | 0.32mi |
| 8932 Dorrington Ave West Hollywood, CA | 3.0 | 3.0 | 2050 | $13,995 | $6.83 | 24d | 1 | 0.36mi |
| 8932 Dorrington Ave West Hollywood, CA | 3.0 | 3.0 | 2050 | $13,995 | $6.83 | 44d | 1 | 0.36mi |
| 9303 Burton Way Unit A Beverly Hills, CA | 3.0 | 3.0 | 2154 | $9,950 | $4.62 | 3d | 1 | 0.36mi |
| 9000 W 3rd St #104 Los Angeles, CA | 2.0 | 3.0 | 2400 | $29,800 | $12.42 | 1d | 1 | 0.38mi |
| 9323 Burton Way Unit A Beverly Hills, CA | 3.0 | 3.0 | 2145 | $8,495 | $3.96 | 44d | 1 | 0.39mi |
| 245 N Wetherly Dr Beverly Hills, CA | 3.0 | 3.5 | 2015 | $13,500 | $6.70 | 44d | 1 | 0.51mi |
| 209 N Doheny Dr Beverly Hills, CA | 3.0 | 4.0 | 2454 | $14,995 | $6.11 | 44d | 1 | 0.51mi |
| 9001 Santa Monica Blvd West Hollywood, CA | 1.0–3.0 | 1.5–3.5 | 1631 | $12,866 | $7.89 | 1d | 3 | 0.53mi |
| 300 N Swall Dr #457 Beverly Hills, CA | 2.0 | 2.5 | 2947 | $10,800 | $3.66 | 44d | 1 | 0.61mi |
| 160 N La Peer Dr Beverly Hills, CA | 2.0 | 2.5 | 2270 | $13,725 | $6.05 | 44d | 4 | 0.68mi |
| 317 S Hamel Rd Los Angeles, CA | 2.0–4.0 | 2.0–4.0 | 1897 | $3,995 | $2.11 | 5d | 3 | 0.69mi |
| 428 Arnaz Dr Los Angeles, CA | 3.0 | 3.5 | 2035 | $11,000 | $5.41 | 3d | 1 | 0.73mi |
| 120 S Crescent Dr #305 Beverly Hills, CA | 3.0 | 3.0 | 2070 | $6,200 | $3.00 | 44d | 1 | 0.75mi |
| 132 S Maple Dr #201 Beverly Hills, CA | 3.0 | 4.0 | 2536 | $9,500 | $3.75 | 13d | 1 | 0.76mi |
| 420 S Hamel Rd Ph 1 Los Angeles, CA | 3.0 | 3.0 | 2220 | $9,500 | $4.28 | 44d | 1 | 0.77mi |
| 132 S Crescent Dr #103 Beverly Hills, CA | 3.0 | 3.0 | 2450 | $8,200 | $3.35 | 44d | 1 | 0.78mi |
| 157 S Elm Dr Beverly Hills, CA | 2.0 | 2.0 | 2280 | $5,995 | $2.63 | 44d | 1 | 0.83mi |
| 9385 Charleville Blvd Beverly Hills, CA | 3.0 | 2.0 | 2000 | $5,500 | $2.75 | 24d | 1 | 0.85mi |
| 216 Rexford Dr Unit 201 Beverly Hills, CA | 3.0 | 3.0 | 2200 | $5,900 | $2.68 | 44d | 1 | 0.88mi |
| 9014 Harratt St West Hollywood, CA | 3.0 | 2.0 | 2000 | $7,995 | $4.00 | 44d | 1 | 0.89mi |
| 207 S Reeves Dr Beverly Hills, CA | 3.0 | 3.0 | 2400 | $7,750 | $3.23 | 44d | 1 | 0.90mi |
| 207 S Reeves Dr Beverly Hills, CA | 3.0 | 3.0 | 2400 | $6,500 | $2.71 | 24d | 1 | 0.90mi |
| 145 N Willaman Dr Beverly Hills, CA | 3.0 | 2.5 | 2379 | $15,000 | $6.31 | 6d | 1 | 0.94mi |
| 138 N Hamel Dr Beverly Hills, CA | 3.0 | 2.5 | 2000 | $8,500 | $4.25 | 44d | 1 | 0.95mi |
| 252 S Canon Dr Beverly Hills, CA | 3.0 | 2.0 | 2017 | $9,000 | $4.46 | 24d | 1 | 0.98mi |
| 256 S La Peer Dr Beverly Hills, CA | 3.0 | 2.0 | 1980 | $7,800 | $3.94 | 15d | 1 | 1.05mi |
| 515 N Roxbury Dr Beverly Hills, CA | 3.0 | 2.5 | 3563 | $18,500 | $5.19 | 44d | 1 | 1.06mi |
| 211 S Arnaz Dr Beverly Hills, CA | 3.0 | 2.0 | 1946 | $5,600 | $2.88 | 13d | 1 | 1.06mi |
| 321 S Elm Dr Beverly Hills, CA | 2.0–3.0 | 2.5 | 2885 | $8,750 | $3.03 | 3d | 6 | 1.09mi |
| 755 N Alfred St Los Angeles, CA | 3.0 | 4.0 | 2335 | $12,500 | $5.35 | 4d | 1 | 1.15mi |
| 755 N Alfred St Unit B Los Angeles, CA | 3.0 | 3.5 | 2335 | $12,500 | $5.35 | 5d | 1 | 1.15mi |
| 8600 Wilshire Blvd Beverly Hills, CA | 2.0–3.0 | 3.5 | 2506 | $17,500 | $6.98 | 1d | 3 | 1.15mi |
| 155 N Hamilton Dr #102 Beverly Hills, CA | 3.0 | 4.0 | 2521 | $9,500 | $3.77 | 44d | 1 | 1.16mi |
| 141 S Linden Dr #206 Beverly Hills, CA | 3.0 | 2.0 | 2093 | $7,000 | $3.34 | 15d | 1 | 1.17mi |
HOA detail
- Monthly dues
- $2,662 · $31,944/yr
- Likely covers
- watergymparking
Listing history 20 events
-
2026-06-18days on market $3,099,000 Active 160 DOM
-
2026-06-17days on market $3,099,000 Active 159 DOM
-
2026-06-16days on market $3,099,000 Active 158 DOM
-
2026-06-15days on market $3,099,000 Active 157 DOM
-
2026-06-13days on market $3,099,000 Active 155 DOM
-
2026-06-13days on market $3,099,000 Active 154 DOM
-
2026-06-09days on market $3,099,000 Active 151 DOM
-
2026-06-08days on market $3,099,000 Active 150 DOM
-
2026-06-07days on market $3,099,000 Active 149 DOM
-
2026-06-04days on market $3,099,000 Active 146 DOM
-
2026-06-03days on market $3,099,000 Active 145 DOM
-
2026-06-02days on market $3,099,000 Active 144 DOM
-
2026-06-01days on market $3,099,000 Active 143 DOM
-
2026-05-31days on market $3,099,000 Active 142 DOM
-
2026-01-09$3,099,000 Active 1034-char remark
Show marketing remark (1034 chars)
Welcome to 425 Palm in Beverly Hills. Residence 102 offers an expansive 2 bedroom, 2.5 bath floor plan spanning 2,820 interior SF and 330 exterior SF. The thoughtfully designed open-concept layout features a gourmet kitchen that flows effortlessly into the dedicated living and dining rooms, extending to an outdoor patio ideal for indoor-outdoor living. Impeccably designed interior finishes feature Wolf and Sub-Zero appliances, a Miele built-in coffee system, Caesarstone countertops in the kitchen and baths, Italian Gessi fixtures, and custom imported Linea Quattro European cabinetry. The spacious primary suite includes a walk-in closet and a well-appointed bathroom with water closet. Additional highlights include an expansive terrace for entertaining, a dedicated laundry room, and two side-by-side assigned parking spaces. 425 Palm offers an on-site fitness center with top-of-the-line equipment, an outdoor gourmet kitchen, wood decking with sunken spa, a dedicated lobby with 24-hour on-site staff, and controlled access.
-
2025-07-28price
-
2025-05-01price
-
2025-01-17Active
-
2024-05-21status Active
-
2024-03-15Active
ⓘ Source: listings_history table (triggers on properties + properties_extension) + one-shot
backfill from property_details.listing_events for pre-trigger history.
Tax reassessment forecast CA · Resets to sale price
- Current annual tax
- $13,419 · $1,118/mo
- Projected year-2 tax
- $23,552 · $1,963/mo
- Expected delta
- +$10,134/yr (+$844/mo · 75.5%)
ⓘ Screening estimate from a state-policy table — verify with the county assessor before closing.
Climate risk First Street
- Flood 5/10 Major FEMA zone X (unshaded) · 24% chance over 30 yrs
- Wildfire 1/10 Low
- Heat 6/10 Major 7 d/yr ≥86°F today · 21 d/yr by 30 yrs out
- Wind 1/10 Low
- Air quality 5/10 Major 7 unhealthy d/yr today · 7 by 30 yrs out
Nearby sold comps map
Loading sold comps map…
Walkable amenities ~0.75 mi
Loading nearby amenities…
Taxation est. · year 1
- Rental income
- $90,867
- − Mortgage interest
- −$173,592
- − Property taxes
- −$13,419
- − Insurance
- −$15,495
- − Repairs & maintenance
- −$7,269
- − Management
- −$7,269
- − HOA
- −$31,944
- − Depreciation
- −$90,153
- Taxable loss
- −$248,274
- Est. tax savings @ 24.0%
- +$59,586
- After-tax cash flow
- $-124,505/yr
For passive investors: Depreciation is non-cash, so a rental often shows a tax loss while cash-flowing — sheltering income. Rental losses are passive: they offset passive income freely, and up to $25,000/yr can offset ordinary (W-2) income if you actively participate and your MAGI is under $100k (phasing out to $0 by $150k); unused losses carry forward. On sale, claimed depreciation is recaptured at up to 25%, and gains may owe capital-gains tax (a 1031 exchange can defer both). Figures are a year-1 estimate at your 24.0% rate — not tax advice; consult a CPA.
Schools (NCES district)
- District
- Beverly Hills Unified
- NCES district ID
- 0604830
- Math proficiency
- 57% ▼ -7.00%
- Reading proficiency
- 73% ▼ -2.00%
- Median HH income
- $89,439
- Composite
- 58.93/100
- National rank
- #969
- State rank
- #61 of 517 in CA
Livability — Beverly Hills
- Score
- 74/100
- State rank
- #138
- US rank
- #4810
Category grades
Schools grade is shown separately in the Schools card above.
Census & demographics
- Census place
- Beverly Hills, CA
- County
- Los Angeles County · 9,444,647 people
- City population
- 38,852
- Metro
- Los Angeles-Long Beach-Anaheim, CA
- Population (ZIP)
- 19,004
- Household income
- $187,801
- Rent vs Own
- Severe rent burden
- 911.0
Population outlook (Los Angeles County) Hauer SSP2
- Today (2025)
- 10,940,515 people
- By 2030
- 11,256,481 · +2.9%
- By 2040
- 11,729,929 · +7.2%
- By 2050
- 11,948,407 · +9.2%
- By 2075
- 11,818,114 · +8.0%
- By 2100
- 10,842,928 · -0.9%
Race, ethnicity, and origin ACS 2023
- Neighborhood character
- Predominantly White (81%)
- Race & ethnicity
- White 81% Two or more races 8% Asian 7% Hispanic / Latino 6% Black 2%
- Hispanic origin (detail)
- Mexican 3%
- Common ancestry
- Scotch-Irish 5% Italian 4% Romanian 3%
- Foreign-born
- 36% · Canada, China, South Korea
- Languages at home
- 59% English-only · Other Indo-European 21% Spanish 4% French/Haitian/Cajun 3%
Political lean MEDSL · Los Angeles
- 2024 margin
- Solid D (+32.9) · D 64.8% · R 31.9% · Other 3.3%
- 2008→2024 swing
- -7.4pp toward R · 2008: 40.4pp · 2024: 32.9pp
- All cycles
- 2024: D+32.9 2020: D+44.2 2016: D+48.0 2012: D+40.0 2008: D+40.4
Not yet ingested
- Civics
- —
Market trends
- HPI YoY
- ▲ 9.56%
- Current HPI
- 495.052
- Rent YoY
- ▲ 1.73%
- Metro
- Los Angeles-Long Beach-Anaheim, CA
- State GDP YoY
- ▲ 3.21%
- F500 in state
- 116
Industry mix (Fortune 500 HQ in CA)
| Industry | F500 HQs | Revenue |
|---|---|---|
| Technology | 27 | $1,492B |
|
||
| Financial Services | 3 | $174B |
|
||
| Retail | 3 | $44B |
|
||
| Insurance | 3 | $26B |
|
||
| Media / Entertainment | 2 | $115B |
|
||
| Pharmaceuticals / Biotech | 2 | $62B |
|
||
Price history
6 events — show timeline
- 2026-01-09 Listed $3,099,000 TheMLS
- 2025-07-28 Price Changed — TheMLS
- 2025-05-01 Price Changed — TheMLS
- 2025-01-17 Listed — TheMLS
- 2024-05-21 Relisted — TheMLS
- 2024-03-15 Listed — TheMLS
Property tax history
+2.0%/yrLatest (2025): $13,419 · +2.1% YoY. Source: county tax records.
Cash-flow waterfall
monthlySold comps — $/sqft
last 12 mo · ≤1 miLoading sold comps…