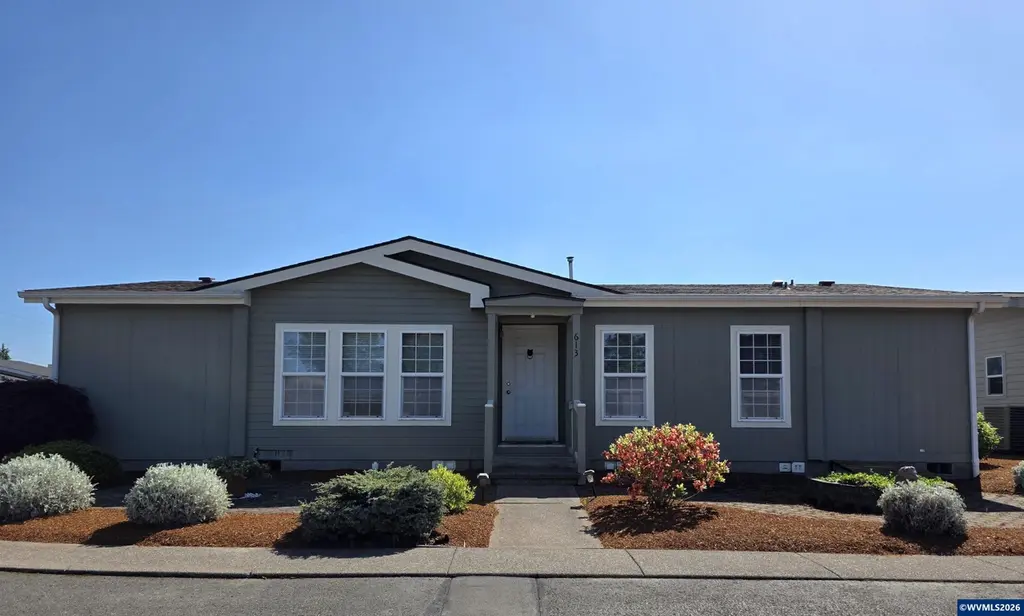
613 Royalty Cir NE · Salem, OR
Flood risk 1/10 · Minimal
- FEMA flood zone
- X (unshaded)
- Chance of flooding over 30 yrs
- 0.0%
- Est. flood insurance / yr
- $507 – $1,088
Fire risk 2/10 · Minimal
- Est. fire insurance / yr
- $498 – $926
Heat risk 4/10 · Minor
- Hot days now (above 91°F)
- 7 days/yr
- Hot days in 30 yrs
- 14 days/yr
Wind risk 1/10 · Minimal
- Chance of severe wind over 30 yrs
- —
Air-quality risk 9/10 · Severe
- Unhealthy air days now
- 12 days/yr
- Unhealthy air days in 30 yrs
- 13 days/yr
Risk factors via First Street. Map © Google.
Why this score? — see what drove the C+ grade
The composite is a weighted blend of 9 inputs, each scored 0–100. Each bar is that input's sub-score; the figure is the points it added to the 100-point composite (weight × sub-score).
- Cash flow +26.8/30.0
- DSCR +9.2/10.0
- ARV discount +7.5/15.0
- 1% rule +6.8/10.0
- Livability +4.0/5.0
- Schools +3.7/10.0
- Condition / age +2.5/5.0
- Rent growth +2.3/5.0
- Appreciation +0.0/10.0
$170,000
🖨 Deal sheet 📄 Offer letter ✓ Due diligence
Listing remarks MLS
Wonderfully appointed 3-bedroom, 2-bath Palm Harbor home with detached 2-car garage in Center View Estates, a 55+ community. Large corner lot with vaulted ceilings and loads of storage. So many important updates! - Newer roof, heat pump, high-tech water heater, range and fridge. Master bedrrom off living area with en suite bathroom, large kitchen, breakfast nook, as well as dining area. Fresh bark dust for easy care and fresh coat of exterior paint. W/D included. Catio is negotiable.
Key facts
- Heat pump
- Newer roof
- Water heater
Tags
Neighborhood map
What this means for you Summary
Snapshot
- This is a 3-bed/2.0-bath manufactured listed at $170k.
Deal economics
- At list price, monthly cash flow is $468 ($6k/yr) — positive.
- The deal already cash-flows at list — no discount required.
- Meets the 1% rule at list price ($2k rent vs $170k).
- Recommended offer: $160k (6.0% below list) — sets the bar for market timing.
- Cap rate 9.6% vs local median 2.9% in Salem — top-decile yield for the area; either an underpriced asset or a hidden risk that comps aren't pricing in. Stress-test before assuming the spread holds.
Location & tenants
- Location reads 79/100 on livability (#59 in OR, #2,084 nationally) — a middle-class / working-renter tenant base. Strengths: amenities A+, commute A+, housing A+; Watch: schools D, crime F.
- Salem-Keizer SD 24J (urban): math 34% / reading 47% proficiency, ranked #103 of 183 in OR (top 56%) — families likely to look elsewhere, expect single-tenant / working-renter base with shorter leases.
- Market conditions: Rents soft (-0.7%/yr); 276 active listings in the ZIP; 32 comparable units currently listed for rent nearby; rentals at typical pace (median 24d on market — plan ~3-4 weeks tenant-placement turnaround); 1,591 units permitted in Marion County in 2024 (716 in 5+ unit buildings).
- This rent runs 40% of the median local income ($60k/yr) — at the standard rent-burdened threshold; future hikes will face affordability resistance.
Forward outlook
- Local home prices are declining (-3.0%/yr); year-one equity from $1k of loan paydown is wiped out by about $5k of value loss. Plan a longer hold.
- Marion County population projected at +17% by 2050 — long-run rental-demand tailwind backs the buy-and-hold thesis.
Negotiation context
- It's been on market 77 days — a 6% lower offer ($160k) is reasonable based on typical stale-listing flexibility.
- 4 sale attempts since 9y ago with the ask held roughly flat each time — persistent listings suggest the price (not the market) is what's stuck; bring a comps-based counter.
- Current owner paid $75k; list at $170k implies a 127% gain — meaningful room to come down on a strong offer.
Questions for the listing agent
- It's been on market 77 days. Have you received any prior offers? Is the seller open to a 6% concession, seller financing, or rate buy-down credit?
- Why hasn't it sold? Are there any deal-killer items the seller is aware of (foundation, flood, title, zoning, code violations)?
- Is there a deadline driving the sale (1031 exchange, divorce, estate, relocation)? That informs how much negotiation room exists.
- Schools are D-rated, which usually means shorter tenancies and higher turnover. Who's the typical renter profile here, and what's been the actual vacancy rate?
- Crime grade is F in this area — have there been break-ins, vandalism, or insurance claims at this property in the last 3 years? What carrier currently insures it and at what premium?
- What's the average days-on-market for RENTAL listings here right now (not sales)? A rising rental-DOM trend means longer vacancies and softer asking-rent achievability than the comps imply.
- What's the recent tenant-quality profile in this submarket — average credit score on applications, eviction rate, late-payment / NSF rate, and stable-employment percentage? A property-management company in the area should have these aggregated.
- How much new for-sale + rental construction is in the pipeline within 1–3 miles? Heavy new supply typically softens prices + rents 12–24 months out; constrained supply supports both.
Investment metrics
- 1% rule
- 1.18% ✓
- Cap rate
- 9.59%
- Cash-on-cash
- 11.79%
- DSCR
- 1.52
- GRM
- 7.1
CMA / ARV
- ARV (median comp)
- $107,278
- List price
- $170,000
- Delta
- 58.47%
- Verdict
- OVERPRICED
- Comps
- 20 within 1.0 mi
Show comp detail 12 sales within ~0.75 mi
| Address | Dist | Beds/Ba | Sqft | Sold | Price | $/sf | Match |
|---|---|---|---|---|---|---|---|
| 663 Royalty Cir NE | 0.06mi | 2/2.0 (-1) | 1,404 (+4%) | 4mo | $164,900 | $117 | 83 |
| 4730 Auburn Rd NE #43 | 0.41mi | 3/2.0 | 1,336 (-1%) | 1mo | $134,900 | $101 | 79 |
| 857 Hoffman Rd | 0.32mi | 3/2.0 | 1,296 (-4%) | 6mo | $110,000 | $85 | 73 |
| 857 Hoffman Rd NE #11 | 0.32mi | 3/2.0 | 1,296 (-4%) | 6mo | $110,000 | $85 | 73 |
| 1500 NE Gabriela Ct #16 | 0.58mi | 3/2.0 | 1,350 (0%) | 1mo | $98,000 | $73 | 72 |
| 283 Broadmore Ave NE | 0.55mi | 3/2.0 | 1,342 (-1%) | 2mo | $60,000 | $45 | 72 |
| 4730 Auburn Rd #158 | 0.41mi | 3/2.0 | 1,288 (-5%) | 3mo | $61,500 | $48 | 71 |
| 1500 Gabriela Ct #20 | 0.58mi | 3/2.0 | 1,323 (-2%) | 5mo | $132,000 | $100 | 65 |
| 4730 Auburn Rd NE #20 | 0.41mi | 2/2.0 (-1) | 1,440 (+7%) | 4mo | $85,000 | $59 | 62 |
| 4998 Wind Stone Way NE #32 | 0.44mi | 3/2.0 | 1,512 (+12%) | 5mo | $134,100 | $89 | 55 |
| 997 Wind Meadows Way #64 | 0.39mi | 4/2.0 (+1) | 1,512 (+12%) | 2mo | $134,999 | $89 | 55 |
| 925 New Haven Dr NE | 0.73mi | 3/2.0 | 1,512 (+12%) | 3mo | $450,000 | $298 | 43 |
Match score weights: distance 35% · size 25% · config 20% · recency 20%. Top-matched comps best support the ARV.
Projected returns pro-forma
-3.0% appreciation · 0.0% rent growth · sell at horizon
- IRR
- -2.1%
- Equity multiple
- 0.92×
- Total profit
- $-3,634
- Equity at exit
- $25,348
- IRR
- 4.1%
- Equity multiple
- 1.26×
- Total profit
- $12,514
- Equity at exit
- $14,698
Cash invested: $47,600 (down + closing). Projections, not guarantees.
Landlord ↔ Tenant lean methodology
- Overall (STATE)
- 28 Tenant-Leaning
- State Oregon
- 28 Tenant-Leaning · D+6
- County
- — inherits STATE
- City
- — inherits STATE
ZIP-level market 97301
- Rents YoY
- -0.7%
- Active inventory
- 276
- Price-to-rent
- 7.1×
Monthly cashflow live
- Estimated rent
- $1,998 high interval (Pro) →
- Mortgage (P&I)
- −$891
- Tax from tax record
- −$148 /mo · $1,781/yr
- Insurance
- −$71
- HOA
- −$0
- Vacancy / Maint / Mgmt
- −$420
- Net cashflow
- $468
Break-even live
UW: 25.0% down · 7.5% · 30yr · 1.5% tax · 5.0% vac · 8.0% maint · 8.0% mgmt
Financing live
Cash to close
- Down payment
- $42,500
- Closing costs
- $5,100
- Reserves months
- —
- Total cash needed
- —
Loan-product check · same deal, 3 products live
Conventional
25% down · 7.5% · 30yr
- Down + closing
- —
- Monthly P&I
- —
- Monthly cashflow
- —
- DSCR
- —
- Eligible?
- —
Personal DTI + credit; lowest rate.
DSCR
20% down · 8.5% · 30yr
- Down + closing
- —
- Monthly P&I
- —
- Monthly cashflow
- —
- DSCR
- —
- Eligible?
- —
No personal income docs; deal must DSCR.
Hard money
10% down · 12.0% · 12mo
- Down + closing
- —
- Monthly P&I
- —
- Monthly cashflow
- —
- DSCR
- —
- Eligible?
- —
Short-term bridge; refi at stabilization.
Rent comps 32 comps
| Address | Beds | Baths | Sqft | Rent | $/sqft | DOM | Units | Dist |
|---|---|---|---|---|---|---|---|---|
| 434 Greencrest St NE Salem, OR | 3.0 | 2.0 | 1637 | $3,900 | $2.38 | 23d | 1 | 0.33mi |
| 412 Lost Lake St NE Salem, OR | 4.0 | 3.0 | 1662 | $2,495 | $1.50 | 23d | 1 | 0.37mi |
| 4485 Monroe Ave NE Salem, OR | 4.0 | 2.0 | 1200 | $2,195 | $1.83 | 44d | 1 | 0.51mi |
| 4833 Thyme Ave NE Salem, OR | 3.0 | 2.5 | 1681 | $2,545 | $1.51 | 14d | 1 | 0.59mi |
| 102 Greencrest St NE Salem, OR | 3.0 | 1.0–2.0 | 914 | $2,205 | $2.41 | 14d | 25 | 0.71mi |
| 435 Fountain Valley Way NE Salem, OR | 1.0–2.0 | 1.0–2.0 | 939 | $1,559 | $1.66 | 21d | 5 | 0.78mi |
| 143 Connecticut Ave SE Unit 145 Salem, OR | 3.0 | 1.0 | 1207 | $1,595 | $1.32 | 14d | 1 | 0.81mi |
| 124 Stafford Ln NE Unit 124-203 Salem, OR | 3.0 | 2.0 | 1052 | $1,595 | $1.52 | 44d | 1 | 0.85mi |
| 4433 Mahrt Ave SE Unit 4437-206 Salem, OR | 2.0 | 2.0 | 932 | $1,525 | $1.64 | 44d | 1 | 0.93mi |
| 4433 Mahrt Ave SE Unit 4435-201 Salem, OR | 2.0 | 2.0 | 888 | $1,525 | $1.72 | 23d | 1 | 0.93mi |
| 4836 Tanglewood Ct SE Salem, OR | 3.0 | 2.0 | 1316 | $2,150 | $1.63 | 23d | 1 | 0.97mi |
| 430 Brittany Way NE Unit 369-421 Salem, OR | 2.0 | 2.0 | 920 | $1,400 | $1.52 | 44d | 1 | 1.00mi |
| 4098 Market St NE Unit MT21 Salem, OR | 2.0 | 1.0 | 900 | $1,275 | $1.42 | 23d | 1 | 1.02mi |
| 1973 45th Ave NE Salem, OR | 2.0 | 1.0–2.0 | 1043 | $1,360 | $1.30 | 14d | 2 | 1.03mi |
| 295 Colt Ln NE Salem, OR | 3.0 | 2.0 | 1052 | $1,575 | $1.50 | 14d | 1 | 1.09mi |
| 4200 Sunnyview Rd NE Salem, OR | 2.0 | 1.0–2.0 | 880 | $1,445 | $1.64 | 23d | 1 | 1.11mi |
| 3695 D St NE Salem, OR | 1.0–2.0 | 1.0–2.0 | 1037 | $1,650 | $1.59 | 44d | 3 | 1.12mi |
| 3750-3762 Amber St NE Unit 3762-107 Salem, OR | 2.0 | 2.5 | 1150 | $1,595 | $1.39 | 44d | 1 | 1.12mi |
| 3750-3762 Amber St NE Unit 3758-107 Salem, OR | 2.0 | 2.5 | 1150 | $1,595 | $1.39 | 23d | 1 | 1.12mi |
| 178 Lancaster Dr SE Salem, OR | 2.0 | 2.0 | 952 | $1,495 | $1.57 | 14d | 1 | 1.16mi |
| 4154 Sunnyview Rd NE Salem, OR | 1.0–2.0 | 1.0 | 806 | $1,375 | $1.71 | 14d | 6 | 1.18mi |
| 4768 El Cedro Loop NE Salem, OR | 3.0 | 2.0 | 1344 | $1,895 | $1.41 | 44d | 1 | 1.32mi |
| 990 Charter Pl NE Salem, OR | 3.0 | 2.5 | 1248 | $1,895 | $1.52 | 44d | 1 | 1.32mi |
| 3910-3930 Sunnyview Rd NE Salem, OR | 3.0 | 2.5 | 1300 | $1,845 | $1.42 | 14d | 6 | 1.33mi |
| 4807 Chinook Ct SE Salem, OR | 3.0 | 1.5 | 1104 | $2,200 | $1.99 | 14d | 1 | 1.36mi |
| 3301 D St NE Salem, OR | 2.0 | 1.0 | 850 | $1,225 | $1.44 | 23d | 4 | 1.36mi |
| 3897 Meadowlawn Loop SE Salem, OR | 1.0–3.0 | 1.0–2.0 | 962 | $1,958 | $2.03 | 14d | 26 | 1.44mi |
| 3828 Bayonne Dr SE Salem, OR | 2.0 | 1.0 | 980 | $1,299 | $1.33 | 14d | 1 | 1.45mi |
| 3822 Bayonne Dr SE Salem, OR | 2.0 | 1.0 | 980 | $1,299 | $1.33 | 23d | 1 | 1.46mi |
| 4776 Buffalo Dr SE Salem, OR | 3.0 | 1.0 | 1369 | $2,150 | $1.57 | 44d | 1 | 1.47mi |
| 4359 Rodeo Dr NE Salem, OR | 3.0 | 2.0 | 1170 | $2,245 | $1.92 | 21d | 1 | 1.48mi |
| 1003-1085 Savage Rd NE Unit 1053 Salem, OR | 2.0 | 1.0 | 950 | $1,095 | $1.15 | 23d | 1 | 1.50mi |
Listing history 24 events
-
2026-06-18days on market $170,000 Active 77 DOM
-
2026-06-17days on market $170,000 Active 76 DOM
-
2026-06-16days on market $170,000 Active 75 DOM
-
2026-06-15days on market $170,000 Active 74 DOM
-
2026-06-14days on market $170,000 Active 72 DOM
-
2026-06-10days on market $170,000 Active 69 DOM
-
2026-06-09days on market $170,000 Active 68 DOM
-
2026-06-08days on market $170,000 Active 67 DOM
-
2026-06-07days on market $170,000 Active 66 DOM
-
2026-06-03days on market $170,000 Active 62 DOM
-
2026-06-02days on market $170,000 Active 61 DOM
-
2026-06-01days on market $170,000 Active 60 DOM
-
2026-05-31days on market $170,000 Active 59 DOM
-
2026-05-30days on market $170,000 Active 58 DOM
-
2026-04-01$170,000 Active 492-char remark
Show marketing remark (492 chars)
Wonderfully appointed 3-bedroom, 2-bath Palm Harbor home with detached 2-car garage in Center View Estates, a 55+ community. Large corner lot with vaulted ceilings and loads of storage. So many important updates! - Newer roof, heat pump, high-tech water heater, range and fridge. Master bedrrom off living area with en suite bathroom, large kitchen, breakfast nook, as well as dining area. Fresh bark dust for easy care and fresh coat of exterior paint. W/D included. Catio is negotiable.
-
2017-09-08soldstatus $75,000 Sold 217-char remark
Show marketing remark (217 chars)
Spacious corner lot home with open floor plan. Well maintained 1997 Palm Harbor manufacture home in quiet 55+ community. Rent space only $400/month. Many cupboards, built ins, in kitchen. Great price! Great community!
-
2017-08-30status Pending 217-char remark
Show marketing remark (217 chars)
Spacious corner lot home with open floor plan. Well maintained 1997 Palm Harbor manufacture home in quiet 55+ community. Rent space only $400/month. Many cupboards, built ins, in kitchen. Great price! Great community!
-
2017-08-17status Active 217-char remark
Show marketing remark (217 chars)
Spacious corner lot home with open floor plan. Well maintained 1997 Palm Harbor manufacture home in quiet 55+ community. Rent space only $400/month. Many cupboards, built ins, in kitchen. Great price! Great community!
-
2017-08-16status Pending 217-char remark
Show marketing remark (217 chars)
Spacious corner lot home with open floor plan. Well maintained 1997 Palm Harbor manufacture home in quiet 55+ community. Rent space only $400/month. Many cupboards, built ins, in kitchen. Great price! Great community!
-
2017-08-12price $79,900 217-char remark
Show marketing remark (217 chars)
Spacious corner lot home with open floor plan. Well maintained 1997 Palm Harbor manufacture home in quiet 55+ community. Rent space only $400/month. Many cupboards, built ins, in kitchen. Great price! Great community!
-
2017-08-04price $88,900 217-char remark
Show marketing remark (217 chars)
Spacious corner lot home with open floor plan. Well maintained 1997 Palm Harbor manufacture home in quiet 55+ community. Rent space only $400/month. Many cupboards, built ins, in kitchen. Great price! Great community!
-
2017-08-04status Active 217-char remark
Show marketing remark (217 chars)
Spacious corner lot home with open floor plan. Well maintained 1997 Palm Harbor manufacture home in quiet 55+ community. Rent space only $400/month. Many cupboards, built ins, in kitchen. Great price! Great community!
-
2017-07-10status Pending 217-char remark
Show marketing remark (217 chars)
Spacious corner lot home with open floor plan. Well maintained 1997 Palm Harbor manufacture home in quiet 55+ community. Rent space only $400/month. Many cupboards, built ins, in kitchen. Great price! Great community!
-
2017-07-05Active under Contract 217-char remark
Show marketing remark (217 chars)
Spacious corner lot home with open floor plan. Well maintained 1997 Palm Harbor manufacture home in quiet 55+ community. Rent space only $400/month. Many cupboards, built ins, in kitchen. Great price! Great community!
ⓘ Source: listings_history table (triggers on properties + properties_extension) + one-shot
backfill from property_details.listing_events for pre-trigger history.
Tax reassessment forecast OR · Resets to sale price
- Current annual tax
- $1,781 · $148/mo
- Projected year-2 tax
- $1,781 · $148/mo
- Expected delta
- $0/yr ($0/mo · 0.0%)
ⓘ Screening estimate from a state-policy table — verify with the county assessor before closing.
Climate risk First Street
- Flood 1/10 Low FEMA zone X (unshaded) · 0% chance over 30 yrs
- Wildfire 2/10 Low
- Heat 4/10 Moderate 7 d/yr ≥91°F today · 14 d/yr by 30 yrs out
- Wind 1/10 Low
- Air quality 9/10 Extreme 12 unhealthy d/yr today · 13 by 30 yrs out
Nearby sold comps map
Loading sold comps map…
Walkable amenities ~0.75 mi
Loading nearby amenities…
Taxation est. · year 1
- Rental income
- $23,974
- − Mortgage interest
- −$9,523
- − Property taxes
- −$1,781
- − Insurance
- −$850
- − Repairs & maintenance
- −$1,918
- − Management
- −$1,918
- − Depreciation
- −$4,945
- Taxable income
- $3,039
- Est. tax owed @ 24.0%
- −$729
- After-tax cash flow
- $4,881/yr
For passive investors: Depreciation is non-cash, so a rental often shows a tax loss while cash-flowing — sheltering income. Rental losses are passive: they offset passive income freely, and up to $25,000/yr can offset ordinary (W-2) income if you actively participate and your MAGI is under $100k (phasing out to $0 by $150k); unused losses carry forward. On sale, claimed depreciation is recaptured at up to 25%, and gains may owe capital-gains tax (a 1031 exchange can defer both). Figures are a year-1 estimate at your 24.0% rate — not tax advice; consult a CPA.
Schools (NCES district)
- District
- Salem-Keizer SD 24J
- NCES district ID
- 4110820
- Math proficiency
- 34% ▼ -1.00%
- Reading proficiency
- 47% ▼ -2.00%
- Median HH income
- $48,632
- Composite
- 37.16/100
- National rank
- #9017
- State rank
- #103 of 183 in OR
Livability — Salem
- Score
- 79/100
- State rank
- #59
- US rank
- #2084
Category grades
Schools grade is shown separately in the Schools card above.
Census & demographics
- Census place
- Salem, OR
- County
- Marion County · 258,219 people
- City population
- 193,601
- Metro
- Salem, OR
- Population (ZIP)
- 57,574
- Household income
- $60,422
- Rent vs Own
- Severe rent burden
- 3089.0
Population outlook (Marion County) Hauer SSP2
- Today (2025)
- 360,940 people
- By 2030
- 375,178 · +3.9%
- By 2040
- 400,914 · +11.1%
- By 2050
- 422,187 · +17.0%
- By 2075
- 460,305 · +27.5%
- By 2100
- 464,025 · +28.6%
Race, ethnicity, and origin ACS 2023
- Neighborhood character
- Diverse neighborhood (Simpson 0.58)
- Race & ethnicity
- White 55% Hispanic / Latino 35% Two or more races 19% Asian 2% Black 2% Native American 1% Pacific Islander 1%
- Hispanic origin (detail)
- Mexican 31%
- Common ancestry
- Italian 4% Portuguese 2% Lithuanian 2%
- Foreign-born
- 17% · Canada, China, Philippines
- Languages at home
- 68% English-only · Spanish 27% Other Asian/Pacific 1% Russian/Polish/Slavic 1%
Political lean MEDSL · Marion
- 2024 margin
- Toss-up / Even · D 47.5% · R 49.5% · Other 3.0%
- 2008→2024 swing
- -4.2pp toward R · 2008: 2.2pp · 2024: -2.0pp
- All cycles
- 2024: R+2.0 2020: D+1.1 2016: R+5.0 2012: R+3.5 2008: D+2.2
Not yet ingested
- Civics
- —
Market trends
- HPI YoY
- ▼ -548.17%
- Current HPI
- 335.8199
- Rent YoY
- ▼ -0.70%
- Metro
- Salem, OR
- State GDP YoY
- ▲ 2.05%
- F500 in state
- 2
Industry mix (Fortune 500 HQ in OR)
| Industry | F500 HQs | Revenue |
|---|---|---|
| Consumer Goods | 1 | $51B |
|
||
Price history
+91.2% since first listed10 events — show timeline
- 2026-04-01 Listed $170,000 WVMLS
- 2017-09-08 Sold (MLS) $75,000 WVMLS
- 2017-08-30 Pending — WVMLS
- 2017-08-17 Relisted — WVMLS
- 2017-08-16 Pending — WVMLS
- 2017-08-12 Price Changed $79,900 WVMLS
- 2017-08-04 Price Changed $88,900 WVMLS
- 2017-08-04 Relisted — WVMLS
- 2017-07-10 Pending — WVMLS
- 2017-07-05 Listed — WVMLS
Property tax history
+2.4%/yrLatest (2025): $1,781 · +7.7% YoY. Source: county tax records.
Cash-flow waterfall
monthlySold comps — $/sqft
last 12 mo · ≤1 miLoading sold comps…