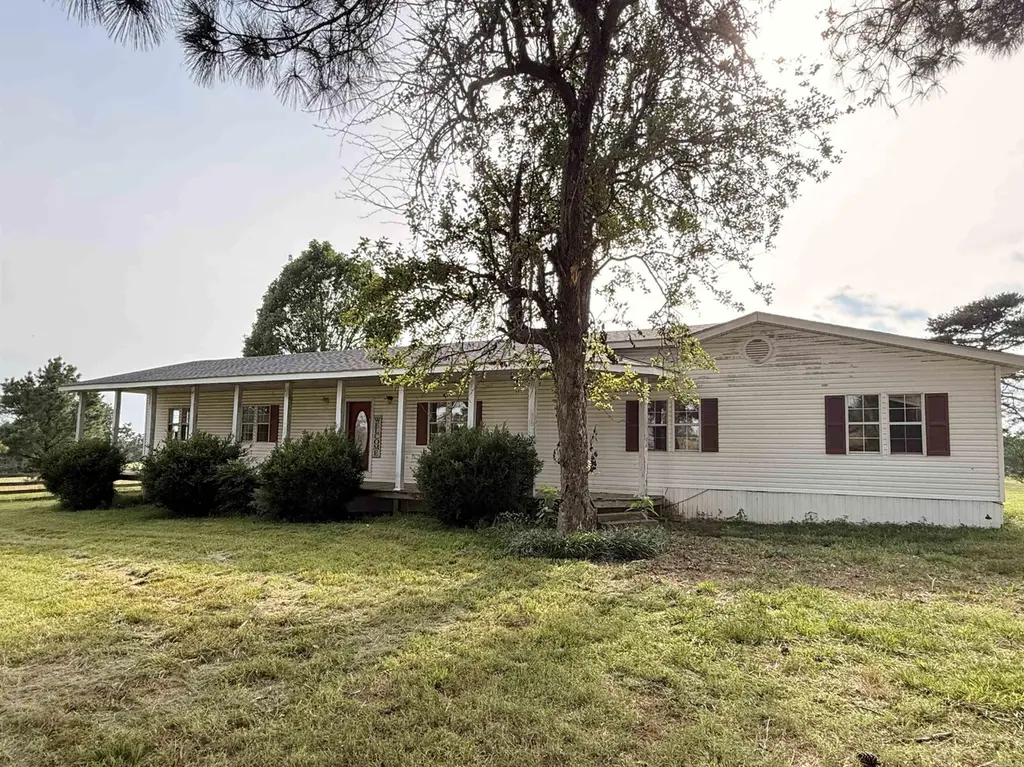
99 Candlestick Rd W · Heber Springs, AR
Flood risk No data
- FEMA flood zone
- —
- Chance of flooding over 30 yrs
- —
- Est. flood insurance / yr
- —
Fire risk No data
- Est. fire insurance / yr
- —
Heat risk No data
- Hot days now (above threshold)
- —
- Hot days in 30 yrs
- —
Wind risk No data
- Chance of severe wind over 30 yrs
- —
Air-quality risk No data
- Unhealthy air days now
- —
- Unhealthy air days in 30 yrs
- —
Risk factors via First Street. Map © Google.
Why this score? — see what drove the C- grade
The composite is a weighted blend of 9 inputs, each scored 0–100. Each bar is that input's sub-score; the figure is the points it added to the 100-point composite (weight × sub-score).
- Cash flow +20.1/30.0
- ARV discount +7.5/15.0
- DSCR +6.4/10.0
- 1% rule +4.9/10.0
- Schools +4.1/10.0
- Livability +2.9/5.0
- Rent growth +2.5/5.0
- Condition / age +2.5/5.0
- Appreciation +0.0/10.0
$139,500
🖨 Deal sheet 📄 Offer letter ✓ Due diligence
Listing remarks
Situated on 3.67 fenced acres near Heber Springs, this property is set up for horses, livestock, equipment storage, or workshop use. The 1,928 SqFt home includes 4 bedrooms, 2 bathrooms, an open kitchen and living area, a pine wood accent wall, wood stove with brick hearth, storm shelter, and a new roof. Positioned on top of a hill, the home overlooks rolling pasture and offers views across the property, with large pines, shade trees, and no close neighbors. The insulated 30x60 barn sits on a slab foundation and includes drive-through bay doors, water, electricity, a wash stall with drainage, 4 large horse stalls, a round pen, and a gated entrance. Fenced pastures, separate electric service
Key facts
- Large horse stalls
- Fenced acres
- Set up for horses
Tags
Property features AI
Finance
- Other: Approximately 3.67 acres (survey); Square footage per tax records: 1,928
- Financial info: Annual taxes reported
Exterior
- Parking: Parking pads
- Utilities: Public water; Septic
- Home design: Metal/vinyl siding
- Construction: Architectural shingle roof; Crawl space foundation
- Exterior features: Paved road access; Sloped and level cleared yard; Rural property setting; Cross-fenced; Barns/buildings; Livestock allowed (cattle, horses); Stables
Interior
- Kitchen: Free-standing stove; Dishwasher
- Flooring: Wood flooring; Tile flooring; Laminate flooring
- Bathrooms: 2 full bathrooms
- Heating & cooling: Central electric heating; Central electric cooling
- Interior features: Wood-burning stove; Wood, tile, and laminate floors
Neighborhood map
What this means for you Summary
Snapshot
- This is a 4-bed/2.0-bath single-family listed at $140k.
Deal economics
- At list price, monthly cash flow is $174 ($2k/yr) — positive.
- The deal already cash-flows at list — no discount required.
- To meet the 1% rule (rent ≥ 1% of price), the offer needs to be $138k (0.8% below list).
- Recommended offer: $138k (0.8% below list) — sets the bar for 1% rule.
- Cap rate 7.8% vs local median 2.1% in Heber Springs — top-decile yield for the area; either an underpriced asset or a hidden risk that comps aren't pricing in. Stress-test before assuming the spread holds.
Location & tenants
- Location reads 58/100 on livability (#329 in AR) — a working-class tenant base; expect higher turnover. Strengths: cost of living A+; Watch: crime C-, employment D+, amenities F.
- Heber Springs School District (town): math 50% / reading 49% proficiency, ranked #19 of 238 in AR (top 8%) — families likely to look elsewhere, expect single-tenant / working-renter base with shorter leases.
- Market conditions: 287 active listings in the ZIP; 13 units permitted in Cleburne County in 2024 (0 in 5+ unit buildings).
Forward outlook
- Local home prices are declining (-3.0%/yr); year-one equity from $964 of loan paydown is wiped out by about $4k of value loss. Plan a longer hold.
- Cleburne County population projected at -18% by 2050 — secular population decline; favor cash flow + early exit over multi-decade hold.
Negotiation context
- Only 8 days on market — expect competitive offers; lowballing is unlikely to land.
- 2 sale attempts since 2y ago with the ask held roughly flat each time — persistent listings suggest the price (not the market) is what's stuck; bring a comps-based counter.
- Current owner paid $54k; list at $140k implies a 158% gain — meaningful room to come down on a strong offer.
Questions for the listing agent
- Built in 1960 — when were the roof, HVAC, electrical panel, plumbing, and water heater last replaced?
- Is there a deadline driving the sale (1031 exchange, divorce, estate, relocation)? That informs how much negotiation room exists.
- What's the average days-on-market for RENTAL listings here right now (not sales)? A rising rental-DOM trend means longer vacancies and softer asking-rent achievability than the comps imply.
- What's the recent tenant-quality profile in this submarket — average credit score on applications, eviction rate, late-payment / NSF rate, and stable-employment percentage? A property-management company in the area should have these aggregated.
- How much new for-sale + rental construction is in the pipeline within 1–3 miles? Heavy new supply typically softens prices + rents 12–24 months out; constrained supply supports both.
Investment metrics
- 1% rule
- 0.99% ✗
- Cap rate
- 7.79%
- Cash-on-cash
- 5.35%
- DSCR
- 1.24
- GRM
- 8.4
CMA / ARV
No comps found within radius.
Projected returns pro-forma
-3.0% appreciation · 3.0% rent growth · sell at horizon
- IRR
- -8.0%
- Equity multiple
- 0.71×
- Total profit
- $-11,522
- Equity at exit
- $20,800
- IRR
- 1.5%
- Equity multiple
- 1.11×
- Total profit
- $4,219
- Equity at exit
- $12,061
Cash invested: $39,060 (down + closing). Projections, not guarantees.
Landlord ↔ Tenant lean methodology
- Overall (STATE)
- 92 Strongly Landlord-Friendly
- State Arkansas
- 92 Strongly Landlord-Friendly · R+14
- County
- — inherits STATE
- City
- — inherits STATE
ZIP-level market 72543
- Home prices YoY
- -26.7%
- Active inventory
- 287
- Price-to-rent
- 8.4×
Monthly cashflow live
- Estimated rent
- $1,384 medium interval (Pro) →
- Mortgage (P&I)
- −$732
- Tax from tax record
- −$130 /mo · $1,555/yr
- Insurance
- −$58
- HOA
- −$0
- Vacancy / Maint / Mgmt
- −$291
- Net cashflow
- $174
Break-even live
UW: 25.0% down · 7.5% · 30yr · 1.5% tax · 5.0% vac · 8.0% maint · 8.0% mgmt
Financing live
Cash to close
- Down payment
- $34,875
- Closing costs
- $4,185
- Reserves months
- —
- Total cash needed
- —
Loan-product check · same deal, 3 products live
Conventional
25% down · 7.5% · 30yr
- Down + closing
- —
- Monthly P&I
- —
- Monthly cashflow
- —
- DSCR
- —
- Eligible?
- —
Personal DTI + credit; lowest rate.
DSCR
20% down · 8.5% · 30yr
- Down + closing
- —
- Monthly P&I
- —
- Monthly cashflow
- —
- DSCR
- —
- Eligible?
- —
No personal income docs; deal must DSCR.
Hard money
10% down · 12.0% · 12mo
- Down + closing
- —
- Monthly P&I
- —
- Monthly cashflow
- —
- DSCR
- —
- Eligible?
- —
Short-term bridge; refi at stabilization.
Listing history 7 events
-
2026-06-12statusdays on market $139,500 Under Contract 8 DOM
-
2026-06-09days on market $139,500 New Listing 6 DOM
-
2026-06-08days on market $139,500 New Listing 5 DOM
-
2026-06-07days on market $139,500 New Listing 4 DOM
-
2026-06-07days on market $139,500 New Listing 3 DOM
-
2026-06-04remarks 699-char remark
-
2026-06-04$139,500 New Listing 1 DOM
ⓘ Source: listings_history table (triggers on properties + properties_extension) + one-shot
backfill from property_details.listing_events for pre-trigger history.
Tax reassessment forecast AR · Resets to sale price
- Current annual tax
- $1,555 · $130/mo
- Projected year-2 tax
- $1,555 · $130/mo
- Expected delta
- $0/yr ($0/mo · 0.0%)
ⓘ Screening estimate from a state-policy table — verify with the county assessor before closing.
Nearby sold comps map
Loading sold comps map…
Walkable amenities ~0.75 mi
Loading nearby amenities…
Taxation est. · year 1
- Rental income
- $16,608
- − Mortgage interest
- −$7,814
- − Property taxes
- −$1,555
- − Insurance
- −$698
- − Repairs & maintenance
- −$1,329
- − Management
- −$1,329
- − Depreciation
- −$4,058
- Taxable loss
- −$174
- Est. tax savings @ 24.0%
- +$42
- After-tax cash flow
- $2,131/yr
For passive investors: Depreciation is non-cash, so a rental often shows a tax loss while cash-flowing — sheltering income. Rental losses are passive: they offset passive income freely, and up to $25,000/yr can offset ordinary (W-2) income if you actively participate and your MAGI is under $100k (phasing out to $0 by $150k); unused losses carry forward. On sale, claimed depreciation is recaptured at up to 25%, and gains may owe capital-gains tax (a 1031 exchange can defer both). Figures are a year-1 estimate at your 24.0% rate — not tax advice; consult a CPA.
Schools (NCES district)
- District
- Heber Springs School District
- NCES district ID
- 0507560
- Math proficiency
- 50% ▼ -11.00%
- Reading proficiency
- 49% ▼ -11.00%
- Median HH income
- $39,577
- Composite
- 41.39/100
- National rank
- #3478
- State rank
- #19 of 238 in AR
Livability — Heber Springs
- Score
- 58/100
- State rank
- #329
- US rank
- #21491
Category grades
Schools grade is shown separately in the Schools card above.
Census & demographics
- Population (ZIP)
- 12,642
Population outlook (Cleburne County) Hauer SSP2
- Today (2025)
- 24,198 people
- By 2030
- 23,324 · -3.6%
- By 2040
- 21,566 · -10.9%
- By 2050
- 19,916 · -17.7%
- By 2075
- 16,744 · -30.8%
- By 2100
- 13,303 · -45.0%
Race, ethnicity, and origin ACS 2023
- Neighborhood character
- Predominantly White (93%)
- Race & ethnicity
- White 93% Two or more races 3% Hispanic / Latino 3%
- Common ancestry
- Italian 3% Slovak 2% Lithuanian 2%
- Foreign-born
- 1%
- Languages at home
- 99% English-only · Spanish 1%
Political lean MEDSL · Cleburne
- 2024 margin
- Solid R (+67.9) · D 15.2% · R 83.2% · Other 1.6%
- 2008→2024 swing
- -23.7pp toward R · 2008: -44.2pp · 2024: -67.9pp
- All cycles
- 2024: R+67.9 2020: R+65.8 2016: R+61.4 2012: R+52.2 2008: R+44.2
Not yet ingested
- Civics
- —
Market trends
- HPI YoY
- ▼ -78.45%
- Current HPI
- 215.4322
- Rent YoY
- —
- Metro
- —
- State GDP YoY
- ▲ 3.80%
- F500 in state
- 10
Industry mix (Fortune 500 HQ in AR)
| Industry | F500 HQs | Revenue |
|---|---|---|
| Retail | 1 | $681B |
|
||
| Food / Agriculture | 1 | $53B |
|
||
| Retail / Energy | 1 | $22B |
|
||
| Transportation / Logistics | 1 | $12B |
|
||
| Energy | 1 | $4B |
|
||
Price history
+158.3% since first listed4 events — show timeline
- 2026-06-03 Listed $139,500 CARMLS
- 2024-10-01 Listing Removed — CARMLS
- 2024-09-10 Listed $2,396,800 CARMLS
- 1992-05-05 Sold (Public Records) $54,000 Public Records
Property tax history
+2.1%/yrLatest (2025): $1,555 · +44.6% YoY. Source: county tax records.
Cash-flow waterfall
monthlySold comps — $/sqft
last 12 mo · ≤1 miLoading sold comps…