 🏗️ New Construction
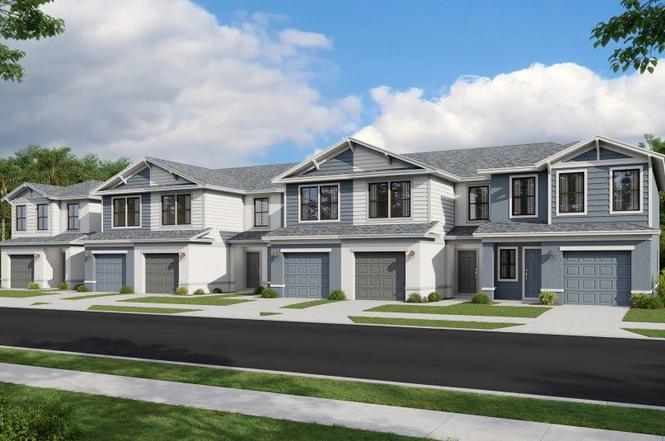
Avery Plan · Lakewood Ranch, FL
Flood risk 1/10 · Minimal
- FEMA flood zone
- X (unshaded)
- Chance of flooding over 30 yrs
- 0.0%
- Est. flood insurance / yr
- $507 – $1,088
Fire risk 4/10 · Minor
- Est. fire insurance / yr
- $947 – $1,759
Heat risk 10/10 · Severe
- Hot days now (above 108°F)
- 7 days/yr
- Hot days in 30 yrs
- 28 days/yr
Wind risk 10/10 · Severe
- Chance of severe wind over 30 yrs
- 99.0%
Air-quality risk 3/10 · Minor
- Unhealthy air days now
- 3 days/yr
- Unhealthy air days in 30 yrs
- 3 days/yr
Risk factors via First Street. Map © Google.
Why this score? — see what drove the D+ grade
The composite is a weighted blend of 9 inputs, each scored 0–100. Each bar is that input's sub-score; the figure is the points it added to the 100-point composite (weight × sub-score).
- Cash flow +17.2/30.0
- ARV discount +7.5/15.0
- DSCR +5.3/10.0
- 1% rule +4.6/10.0
- Schools +4.4/10.0
- Livability +2.5/5.0
- Condition / age +2.5/5.0
- Rent growth +1.2/5.0
- Appreciation +0.0/10.0
$294,999
🖨 Deal sheet (PDF) 📄 Offer letter ✓ Due diligence
Key facts
- Modern open design
- Sliding doors
- Comfortable bedrooms
Tags
Property features AI
Finance
- Financial info: List price $294,999
Exterior
- Parking: 1-car garage (1 total parking space)
- Home design: Single-family home — Avery plan; Active listing
- Construction: New construction (inventory type: Plan)
- Exterior features: New construction plan (Avery)
Interior
- Bedrooms: 3 bedrooms
- Bathrooms: 2 full bathrooms and 1 half bathroom (2.5 total)
- Interior features: Open living area totaling 1405 (living area shown separately)
Neighborhood map
What this means for you Summary
Snapshot
- This is a 3-bed/2.5-bath townhouse listed at $295k.
Deal economics
- At list price, monthly cash flow is $202 ($2k/yr) — positive.
- The deal already cash-flows at list — no discount required.
- To meet the 1% rule (rent ≥ 1% of price), the offer needs to be $276k (6.3% below list).
- Recommended offer: $260k (12.0% below list) — sets the bar for market timing.
- Cap rate 7.1% vs local median 3.3% in Lakewood Ranch — top-decile yield for the area; either an underpriced asset or a hidden risk that comps aren't pricing in. Stress-test before assuming the spread holds.
Location & tenants
- Location reads: area grade D — affects rentability + tenant quality, not the cash-flow math above.
- Manatee (suburban): math 54% / reading 50% proficiency, ranked #26 of 73 in FL (top 36%) — acceptable for families but not a draw, mixed tenant base, ~2y average lease.
- Zoned schools: B.D. Gullett Elementary School (math 78% / reading 73%, grade A, #211 of 2,144 statewide, top 10%, 1,121 students, 20% FRL); R. Dan Nolan Middle School (math 79% / reading 72%, grade A, #38 of 571 statewide, top 7%, 760 students, 28% FRL); Lakewood Ranch High School (math 47% / reading 63%, grade C, #135 of 667 statewide, top 20%, 2,435 students, 22% FRL) — zoned schools average 23% FRL vs 51% district-wide (27 pts lower); this property's tenant base skews higher-income than the district average.
- Zoned-school proficiency averages 69% at this address vs 52% district-wide (+17 pts) — the actual schools serving this property are materially stronger than the Manatee average implies; a family-tenant draw the district grade alone would hide.
- Market conditions: Rents falling (-5.2%/yr); 1164 active listings in the ZIP; 40 comparable units currently listed for rent nearby; rentals at typical pace (median 26d on market — plan ~3-4 weeks tenant-placement turnaround); high-income renter base; 7,472 units permitted in Manatee County in 2024 (1,782 in 5+ unit buildings).
Forward outlook
- Local home prices are declining (-3.0%/yr); year-one equity from $2k of loan paydown is wiped out by about $9k of value loss. Plan a longer hold.
- Manatee County population projected at +43% by 2050 — long-run rental-demand tailwind backs the buy-and-hold thesis.
Negotiation context
- It's been on market 670 days — a 12% lower offer ($260k) is reasonable based on typical stale-listing flexibility.
Risks & watch-outs
- Climate carrying-cost: severe wind risk, 99% chance of damaging wind over 30y; extreme-heat days projected 7→28/yr by 2055 (HVAC capex compounding) — expect insurance premiums to compound above CPI over the hold.
Questions for the listing agent
- It's been on market 670 days. Have you received any prior offers? Is the seller open to a 12% concession, seller financing, or rate buy-down credit?
- Why hasn't it sold? Are there any deal-killer items the seller is aware of (foundation, flood, title, zoning, code violations)?
- Is there a deadline driving the sale (1031 exchange, divorce, estate, relocation)? That informs how much negotiation room exists.
- The area grade is low — what's the realistic commute time and amenity access for the typical tenant pool here? Any planned neighborhood developments (good or bad) we should know about?
- What's the average days-on-market for RENTAL listings here right now (not sales)? A rising rental-DOM trend means longer vacancies and softer asking-rent achievability than the comps imply.
- What's the recent tenant-quality profile in this submarket — average credit score on applications, eviction rate, late-payment / NSF rate, and stable-employment percentage? A property-management company in the area should have these aggregated.
- How much new for-sale + rental construction is in the pipeline within 1–3 miles? Heavy new supply typically softens prices + rents 12–24 months out; constrained supply supports both.
Investment metrics
- 1% rule
- 0.96% ✗
- Cap rate
- 7.14%
- Cash-on-cash
- 3.02%
- DSCR
- 1.13
- GRM
- 8.6
CMA / ARV
- ARV (on-the-fly)
- $286,620
- Comps found
- 12
Show comp detail 12 sales within ~0.75 mi
| Address | Dist | Beds/Ba | Sqft | Sold | Price | $/sf | Match |
|---|---|---|---|---|---|---|---|
| 14165 Lilac Sky Ter | 0.00mi | 3/2.5 | 1,414 (+1%) | 1mo | $295,000 | $209 | 98 |
| 14161 Lilac Sky Ter | 0.00mi | 3/2.5 | 1,352 (-4%) | 0mo | $295,000 | $218 | 93 |
| 14144 Crimson Ave | 0.11mi | 3/2.5 | 1,431 (+2%) | 3mo | $282,500 | $197 | 89 |
| 14443 Lilac Sky Ter | 0.21mi | 3/2.5 | 1,405 (0%) | 3mo | $282,800 | $201 | 88 |
| 14374 Lilac Sky Ter | 0.17mi | 3/2.5 | 1,347 (-4%) | 4mo | $265,000 | $197 | 82 |
| 14431 Lilac Sky Ter | 0.20mi | 3/2.5 | 1,347 (-4%) | 3mo | $267,000 | $198 | 81 |
| 14427 Lilac Sky Ter | 0.20mi | 3/2.5 | 1,347 (-4%) | 3mo | $265,000 | $197 | 81 |
| 14435 Lilac Sky Ter | 0.20mi | 3/2.5 | 1,347 (-4%) | 3mo | $275,000 | $204 | 81 |
| 14416 Lilac Sky Ter | 0.19mi | 3/2.5 | 1,347 (-4%) | 4mo | $265,000 | $197 | 81 |
| 13816 Messina Loop #104 | 0.70mi | 2/2.0 (-1) | 1,528 (+9%) | 2mo | $325,000 | $213 | 44 |
| 13810 Messina Loop #204 | 0.72mi | 2/2.0 (-1) | 1,528 (+9%) | 4mo | $350,000 | $229 | 42 |
| 13725 Messina Loop #104 | 0.75mi | 2/2.0 (-1) | 1,528 (+9%) | 3mo | $350,000 | $229 | 41 |
Match score weights: distance 35% · size 25% · config 20% · recency 20%. Top-matched comps best support the ARV.
Projected returns pro-forma
-3.0% appreciation · 0.0% rent growth · sell at horizon
- IRR
- -15.0%
- Equity multiple
- 0.48×
- Total profit
- $-41,619
- Equity at exit
- $42,736
- IRR
- -12.4%
- Equity multiple
- 0.37×
- Total profit
- $-50,781
- Equity at exit
- $24,782
Cash invested: $80,254 (down + closing). Projections, not guarantees.
Landlord ↔ Tenant lean methodology
- Overall (STATE)
- 87 Strongly Landlord-Friendly
- State Florida
- 87 Strongly Landlord-Friendly · R+3
- County
- — inherits STATE
- City
- — inherits STATE
ZIP-level market 34211
- Home prices YoY
- -27.5%
- Rents YoY
- -5.2%
- Active inventory
- 1164
- Price-to-rent
- 8.9×
Monthly cashflow live
- Estimated rent
- $2,763 high interval (Pro) →
- Mortgage (P&I)
- −$1,503
- Tax est. 1.5%
- −$358 /mo · $4,299/yr
- Insurance
- −$119
- HOA
- −$0
- Vacancy / Maint / Mgmt
- −$580
- Net cashflow
- $202
Break-even live
Sensitivity live
| Price | -10% $400 | -5% $301 | +0% $202 | +5% $103 | +10% $4 |
|---|---|---|---|---|---|
| Rent | -10% $-16 | -5% $93 | +0% $202 | +5% $311 | +10% $421 |
| Rate | -1.0pp $347 | -0.5pp $275 | base $202 | +0.5pp $128 | +1.0pp $52 |
UW: 25.0% down · 7.5% · 30yr · 1.5% tax · 5.0% vac · 8.0% maint · 8.0% mgmt
Financing live
Cash to close
- Down payment
- $71,655
- Closing costs
- $8,599
- Reserves months
- —
- Total cash needed
- —
Loan-product check · same deal, 3 products live
Conventional
25% down · 7.5% · 30yr
- Down + closing
- —
- Monthly P&I
- —
- Monthly cashflow
- —
- DSCR
- —
- Eligible?
- —
Personal DTI + credit; lowest rate.
DSCR
20% down · 8.5% · 30yr
- Down + closing
- —
- Monthly P&I
- —
- Monthly cashflow
- —
- DSCR
- —
- Eligible?
- —
No personal income docs; deal must DSCR.
Hard money
10% down · 12.0% · 12mo
- Down + closing
- —
- Monthly P&I
- —
- Monthly cashflow
- —
- DSCR
- —
- Eligible?
- —
Short-term bridge; refi at stabilization.
Rent comps 40 comps
| Address | Beds | Baths | Sqft | Rent | $/sqft | DOM | Units | Dist |
|---|---|---|---|---|---|---|---|---|
| 14223 Lilac Sky Ter Bradenton, FL | 3.0 | 2.5 | 1352 | $2,300 | $1.70 | 18d | 1 | 0.03mi |
| 14072 Lilac Sky Ter Bradenton, FL | 3.0 | 2.5 | 1347 | $2,290 | $1.70 | 25d | 1 | 0.11mi |
| 4740 Old Blush St Bradenton, FL | 3.0 | 2.5 | 1431 | $2,300 | $1.61 | 25d | 1 | 0.12mi |
| 14052 Lilac Sky Ter Bradenton, FL | 3.0 | 2.5 | 1405 | $2,395 | $1.70 | 18d | 1 | 0.13mi |
| 14051 Crimson Ave Bradenton, FL | 3.0 | 2.5 | 1850 | $2,500 | $1.35 | 25d | 1 | 0.15mi |
| 14423 Lilac Sky Ter Bradenton, FL | 3.0 | 2.5 | 1347 | $2,200 | $1.63 | 25d | 1 | 0.18mi |
| 14424 Lilac Sky Ter Bradenton, FL | 3.0 | 2.5 | 1405 | $2,500 | $1.78 | 5d | 1 | 0.19mi |
| 14428 Lilac Sky Ter Bradenton, FL | 3.0 | 2.5 | 1347 | $2,300 | $1.71 | 23d | 1 | 0.19mi |
| 14440 Lilac Sky Ter Bradenton, FL | 3.0 | 2.5 | 1347 | $1,995 | $1.48 | 21d | 1 | 0.20mi |
| 14448 Lilac Sky Ter Bradenton, FL | 3.0 | 2.5 | 1352 | $2,300 | $1.70 | 25d | 1 | 0.21mi |
| 14452 Lilac Sky Ter Bradenton, FL | 3.0 | 2.5 | 1405 | $2,295 | $1.63 | 25d | 1 | 0.21mi |
| 4755 Motta Ct Bradenton, FL | 2.0 | 2.0 | 1678 | $4,200 | $2.50 | 18d | 1 | 0.69mi |
| 13725 Messina Loop #201 Bradenton, FL | 2.0 | 2.0 | 1528 | $2,900 | $1.90 | 25d | 1 | 0.75mi |
| 13737 Messina Loop Bradenton, FL | 2.0 | 2.0 | 1528 | $4,750 | $3.11 | 25d | 2 | 0.76mi |
| 13605 Messina Loop #104 Bradenton, FL | 2.0 | 2.0 | 1528 | $4,400 | $2.88 | 21d | 1 | 0.77mi |
| 13605 Messina Loop #104 Bradenton, FL | 2.0 | 2.0 | 1632 | $2,200 | $1.35 | 21d | 1 | 0.77mi |
| 13605 Messina Loop Bradenton, FL | 2.0 | 2.0 | 1528 | $3,450 | $2.26 | 25d | 2 | 0.77mi |
| 13732 Messina Loop #201 Bradenton, FL | 2.0 | 2.0 | 1528 | $2,775 | $1.82 | 18d | 1 | 0.77mi |
| 13711 Messina Loop #104 Bradenton, FL | 2.0 | 2.0 | 1528 | $2,495 | $1.63 | 25d | 1 | 0.77mi |
| 13711 Messina Loop #203 Bradenton, FL | 2.0 | 2.0 | 1528 | $3,200 | $2.09 | 18d | 1 | 0.78mi |
| 13703 Messina Loop #102 Bradenton, FL | 2.0 | 2.0 | 1528 | $2,750 | $1.80 | 25d | 1 | 0.78mi |
| 13823 Messina Loop Bradenton, FL | 2.0 | 2.0 | 1528 | $2,950 | $1.93 | 25d | 2 | 0.79mi |
| 13720 Messina Loop Bradenton, FL | 2.0 | 2.0 | 1528 | $4,750 | $3.11 | 25d | 2 | 0.79mi |
| 13710 Messina Loop #203 Bradenton, FL | 2.0 | 2.0 | 1528 | $3,200 | $2.09 | 25d | 1 | 0.81mi |
| 13604 Messina Loop #103 Bradenton, FL | 2.0 | 2.0 | 1528 | $6,000 | $3.93 | 5d | 1 | 0.82mi |
| 12740 Sorrento Way Bradenton, FL | 2.0 | 2.0 | 1572 | $4,850 | $3.09 | 16d | 2 | 0.92mi |
| 12730 Sorrento Way #103 Bradenton, FL | 2.0 | 2.0 | 1528 | $3,400 | $2.23 | 25d | 1 | 0.94mi |
| 12730 Sorrento Way Bradenton, FL | 2.0 | 2.0 | 1528 | $3,200 | $2.09 | 5d | 2 | 0.95mi |
| 12720 Sorrento Way Bradenton, FL | 2.0 | 2.0 | 1572 | $3,148 | $2.00 | 25d | 2 | 0.96mi |
| 14736 Lyla Ter Bradenton, FL | 3.0 | 2.5 | 1700 | $3,000 | $1.76 | 18d | 1 | 0.98mi |
| 4511 Terrazza Ct Bradenton, FL | 2.0 | 2.0 | 1868 | $5,000 | $2.68 | 25d | 1 | 0.98mi |
| 15161 Serene Shores Loop Bradenton, FL | 3.0 | 3.0 | 1840 | $3,800 | $2.07 | 25d | 1 | 1.01mi |
| 5225 Blue Crush St Bradenton, FL | 3.0 | 3.0 | 1849 | $5,000 | $2.70 | 25d | 1 | 1.13mi |
| 12749 Coastal Breeze Way Bradenton, FL | 3.0 | 2.0 | 1766 | $3,595 | $2.04 | 23d | 1 | 1.16mi |
| 12463 Trailhead Dr Bradenton, FL | 3.0 | 2.5 | 1661 | $3,200 | $1.93 | 25d | 1 | 1.16mi |
| 5037 Skyview Ln Bradenton, FL | 3.0 | 2.5 | 1673 | $2,900 | $1.73 | 25d | 1 | 1.18mi |
| 12447 Trailhead Dr Bradenton, FL | 3.0 | 2.0 | 1749 | $2,649 | $1.51 | 5d | 1 | 1.18mi |
| 12335 Amber Creek Cir Bradenton, FL | 3.0 | 2.0 | 1674 | $2,350 | $1.40 | 25d | 1 | 1.20mi |
| 12314 Amber Creek Cir Bradenton, FL | 3.0 | 2.5 | 1674 | $2,350 | $1.40 | 18d | 1 | 1.20mi |
| 12326 Amber Creek Cir Bradenton, FL | 3.0 | 2.5 | 1674 | $2,300 | $1.37 | 18d | 1 | 1.20mi |
Listing history 15 events
-
2026-06-22days on market $294,999 Active 670 DOM
-
2026-06-18days on market $294,999 Active 667 DOM
-
2026-06-17days on market $294,999 Active 666 DOM
-
2026-06-16days on market $294,999 Active 665 DOM
-
2026-06-15days on market $294,999 Active 664 DOM
-
2026-06-13days on market $294,999 Active 662 DOM
-
2026-06-13days on market $294,999 Active 661 DOM
-
2026-06-10days on market $294,999 Active 659 DOM
-
2026-06-09days on market $294,999 Active 658 DOM
-
2026-06-08days on market $294,999 Active 657 DOM
-
2026-06-08days on market $294,999 Active 656 DOM
-
2026-06-03days on market $294,999 Active 652 DOM
-
2026-06-02days on market $294,999 Active 651 DOM
-
2026-06-01days on market $294,999 Active 650 DOM
-
2026-05-31days on market $294,999 Active 649 DOM
ⓘ Source: listings_history table (triggers on properties + properties_extension) + one-shot
backfill from property_details.listing_events for pre-trigger history.
Climate risk First Street
- Flood 1/10 Low FEMA zone X (unshaded) · 0% chance over 30 yrs
- Wildfire 4/10 Moderate
- Heat 10/10 Extreme 7 d/yr ≥108°F today · 28 d/yr by 30 yrs out
- Wind 10/10 Extreme 99% chance of damaging wind over 30 yrs
- Air quality 3/10 Moderate 3 unhealthy d/yr today · 3 by 30 yrs out
Nearby sold comps map
Loading sold comps map…
Walkable amenities ~0.75 mi
Loading nearby amenities…
Taxation est. · year 1
- Rental income
- $33,160
- − Mortgage interest
- −$16,055
- − Property taxes
- −$4,299
- − Insurance
- −$1,433
- − Repairs & maintenance
- −$2,653
- − Management
- −$2,653
- − Depreciation
- −$8,338
- Taxable loss
- −$2,271
- Est. tax savings @ 24.0%
- +$545
- After-tax cash flow
- $2,972/yr
For passive investors: Depreciation is non-cash, so a rental often shows a tax loss while cash-flowing — sheltering income. Rental losses are passive: they offset passive income freely, and up to $25,000/yr can offset ordinary (W-2) income if you actively participate and your MAGI is under $100k (phasing out to $0 by $150k); unused losses carry forward. On sale, claimed depreciation is recaptured at up to 25%, and gains may owe capital-gains tax (a 1031 exchange can defer both). Figures are a year-1 estimate at your 24.0% rate — not tax advice; consult a CPA.
Schools (NCES district)
- District
- Manatee
- NCES district ID
- 1201230
- Math proficiency
- 54% ▼ -6.00%
- Reading proficiency
- 50% ▼ -2.00%
- Median HH income
- $49,607
- Composite
- 44.43/100
- National rank
- #2806
- State rank
- #26 of 73 in FL
Livability — Lakewood Ranch
No livability data for this city. (Only ~50 U.S. cities are tracked.)
Census & demographics
- Census place
- Lakewood Ranch, FL
- County
- Manatee County · 416,364 people
- City population
- 52,177
- Metro
- North Port-Sarasota-Bradenton, FL
- Population (ZIP)
- 24,980
- Household income
- $119,911
- Rent vs Own
- Severe rent burden
- 815.0
Population outlook (Manatee County) Hauer SSP2
- Today (2025)
- 447,342 people
- By 2030
- 488,911 · +9.3%
- By 2040
- 567,934 · +27.0%
- By 2050
- 637,995 · +42.6%
- By 2075
- 781,970 · +74.8%
- By 2100
- 848,272 · +89.6%
Race, ethnicity, and origin ACS 2023
- Neighborhood character
- Predominantly White (81%)
- Race & ethnicity
- White 81% Hispanic / Latino 11% Two or more races 10% Asian 3% Black 2% Native American 2%
- Hispanic origin (detail)
- Mexican 2% Puerto Rican 3% Cuban 3%
- Common ancestry
- Lithuanian 5% Romanian 3% Scotch-Irish 2%
- Foreign-born
- 16% · Canada, Jamaica, China
- Languages at home
- 81% English-only · Spanish 10% Other Indo-European 3% Russian/Polish/Slavic 2%
Political lean MEDSL · Manatee
- 2024 margin
- Strong R (+23.5) · D 37.9% · R 61.4%
- 2008→2024 swing
- -16.5pp toward R · 2008: -7.0pp · 2024: -23.5pp
- All cycles
- 2024: R+23.5 2020: R+16.1 2016: R+17.1 2012: R+12.5 2008: R+7.0
Not yet ingested
- Civics
- —
Market trends
- HPI YoY
- ▼ -100.84%
- Current HPI
- 265.946
- Rent YoY
- ▼ -5.17%
- Metro
- North Port-Sarasota-Bradenton, FL
- State GDP YoY
- ▲ 3.28%
- F500 in state
- 36
Industry mix (Fortune 500 HQ in FL)
| Industry | F500 HQs | Revenue |
|---|---|---|
| Industrial Technology | 2 | $29B |
|
||
| Insurance | 2 | $17B |
|
||
| Retail | 1 | $60B |
|
||
| Technology Distribution | 1 | $58B |
|
||
| Homebuilding | 1 | $35B |
|
||
| Technology Manufacturing | 1 | $35B |
|
||
Cash-flow waterfall
monthlySold comps — $/sqft
last 12 mo · ≤1 miLoading sold comps…