 Duplex
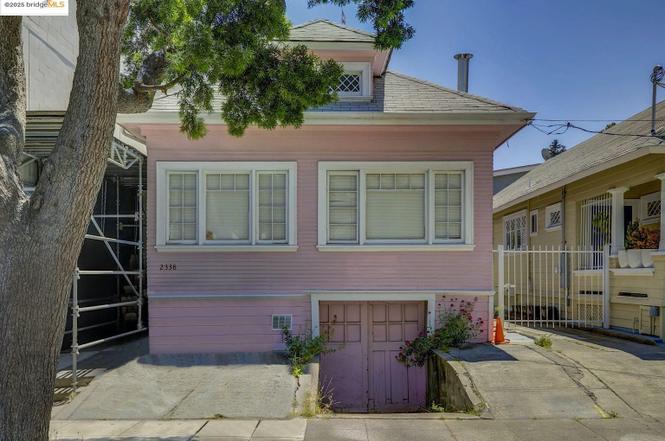
2338 Waverly St · Oakland, CA
Flood risk 4/10 · Minor
- FEMA flood zone
- X (unshaded)
- Chance of flooding over 30 yrs
- 0.22%
- Est. flood insurance / yr
- $507 – $1,088
Fire risk 1/10 · Minimal
- Est. fire insurance / yr
- $659 – $1,223
Heat risk 3/10 · Minor
- Hot days now (above 84°F)
- 7 days/yr
- Hot days in 30 yrs
- 15 days/yr
Wind risk 1/10 · Minimal
- Chance of severe wind over 30 yrs
- —
Air-quality risk 9/10 · Severe
- Unhealthy air days now
- 16 days/yr
- Unhealthy air days in 30 yrs
- 16 days/yr
Risk factors via First Street. Map © Google.
Why this score? — see what drove the B+ grade
The composite is a weighted blend of 9 inputs, each scored 0–100. Each bar is that input's sub-score; the figure is the points it added to the 100-point composite (weight × sub-score).
- Cash flow +30.0/30.0
- ARV discount +11.1/15.0
- DSCR +10.0/10.0
- 1% rule +9.4/10.0
- Rent growth +4.3/5.0
- Livability +3.6/5.0
- Schools +3.0/10.0
- Condition / age +2.5/5.0
- Appreciation +2.3/10.0
$499,000
🖨 Deal sheet (PDF) 📄 Offer letter ✓ Due diligence
Multi-family units
County records classify this as Multi-Family (2-4 Unit). Listing-text estimate: 2 units. confirmed
Listing remarks
Stop the Scroll and Unlock Maximum ROI in Prime Lake Merritt! Attention Investors: 2338 Waverly is your golden ticket to a lucrative Oakland investment! This charming 1910 duplex, n the heart of the highly desirable Lake Merritt neighborhood, offers a 2 bed/1 bath front unit and a e 1 bed/1 bath back unit on a 3,250 sq ft lot. With a jaw-dropping location score of 97, this is an absolute magnet for renters. They'll love the effortless access to 19th St BART, the vibrant nightlife and dining of Uptown. The proximity to entertainment hotspots like the Fox and Paramount Theaters, Fairyland, and the Grand Lake Theater, plus everyday conveniences like Whole Foods and the Saturday farmers market,
Key facts
- Whole foods
- 19th st bart
- 3,250 sq ft lot
Tags
Neighborhood map
What this means for you Summary
Snapshot
- This is a 2 × 3-bed/1.5-bath units multifamily listed at $499k.
Deal economics
- At list price, monthly cash flow is $2k ($26k/yr) — positive. Per door: $1k/mo.
- The deal already cash-flows at list — no discount required.
- Meets the 1% rule at list price ($7k rent vs $499k).
- Recommended offer: $484k (3.0% below list) — sets the bar for market timing.
- Cap rate 11.5% vs local median 2.5% in Oakland — top-decile yield for the area; either an underpriced asset or a hidden risk that comps aren't pricing in. Stress-test before assuming the spread holds.
Location & tenants
- Location reads 71/100 on livability (#224 in CA) — a middle-class / working-renter tenant base. Strengths: amenities A+, commute A+, employment A+; Watch: crime F, cost of living F.
- Oakland Unified (urban): math 27% / reading 33% proficiency, ranked #1,007 of 1,400 in CA (top 72%) — families likely to look elsewhere, expect single-tenant / working-renter base with shorter leases; 68% free/reduced lunch — lower-income household profile, screen leases tightly.
- Zoned schools: Lincoln Elementary (705 students, 77% FRL); Westlake Middle (314 students, 87% FRL); Oakland Technical High (1,796 students, 57% FRL).
- Market conditions: Rents rising fast (+7.2%/yr); 37 active listings in the ZIP; 40 comparable units currently listed for rent nearby; rentals leasing fast (median 4d on market — plan ~1-2 weeks tenant-placement turnaround); 1,742 units permitted in Alameda County in 2024 (856 in 5+ unit buildings).
- At $7,188/mo this rent would consume 117% of the median local household income ($74k/yr) (locally 2526% of renters already pay >50% of income on rent) — very limited rent-growth headroom before tenants either downsize or default.
Forward outlook
- Local home prices are declining (-3.0%/yr); year-one equity from $3k of loan paydown is wiped out by about $15k of value loss. Plan a longer hold.
- Alameda County population projected at +34% by 2050 — long-run rental-demand tailwind backs the buy-and-hold thesis.
- At projected returns (-3.0% appreciation + 7.2% rent growth), your $140k cash investment doubles in ~6 years — after that, you're playing with house money.
Negotiation context
- It's been on market 38 days — a 3% lower offer ($484k) is reasonable based on typical stale-listing flexibility.
- Current owner paid $92k; list at $499k implies a 442% gain — meaningful room to come down on a strong offer.
Risks & watch-outs
- Watch-outs: built in 1910 — expect roof / HVAC / electrical / plumbing capex.
Questions for the listing agent
- It's been on market 38 days. Have you received any prior offers? Is the seller open to a 3% concession, seller financing, or rate buy-down credit?
- Can we see the unit-by-unit rent roll, current vacancy, and any below-market leases? What's the average tenancy length?
- What capital expenditures (roof, boiler, parking lot, exteriors) have been made in the last 5 years, and what's planned in the next 2?
- Built in 1910 — when were the roof, HVAC, electrical panel, plumbing, and water heater last replaced?
- Is there a deadline driving the sale (1031 exchange, divorce, estate, relocation)? That informs how much negotiation room exists.
- Crime grade is F in this area — have there been break-ins, vandalism, or insurance claims at this property in the last 3 years? What carrier currently insures it and at what premium?
- What's the average days-on-market for RENTAL listings here right now (not sales)? A rising rental-DOM trend means longer vacancies and softer asking-rent achievability than the comps imply.
- What's the recent tenant-quality profile in this submarket — average credit score on applications, eviction rate, late-payment / NSF rate, and stable-employment percentage? A property-management company in the area should have these aggregated.
- How much new apartment / multifamily construction is in the pipeline within 1–3 miles? Heavy new supply (>2% of stock underway) typically softens rents 12–24 months out; light construction supports rent growth.
Investment metrics
- 1% rule
- 1.44% ✓
- Cap rate
- 11.53%
- Cash-on-cash
- 18.70%
- DSCR
- 1.83
- GRM
- 5.8
CMA / ARV
- ARV (on-the-fly)
- $542,512
- Comps found
- 2
Show comp detail 2 sales within ~0.75 mi
| Address | Dist | Beds/Ba | Sqft | Sold | Price | $/sf | Match |
|---|---|---|---|---|---|---|---|
| 2338 Waverly St | 0.00mi | 3/2.0 | 1,654 (0%) | 1mo | $485,000 | $293 | 99 |
| 601 32nd St | 0.74mi | 4/2.0 (+1) | 1,784 (+8%) | 9mo | $585,000 | $328 | 40 |
Match score weights: distance 35% · size 25% · config 20% · recency 20%. Top-matched comps best support the ARV.
Projected returns pro-forma
-3.0% appreciation · 7.23% rent growth · sell at horizon
- IRR
- 15.2%
- Equity multiple
- 1.64×
- Total profit
- $89,843
- Equity at exit
- $74,403
- IRR
- 26.9%
- Equity multiple
- 3.86×
- Total profit
- $400,190
- Equity at exit
- $43,144
Cash invested: $139,720 (down + closing). Projections, not guarantees.
Landlord ↔ Tenant lean methodology
- Overall (CITY)
- 0 Strongly Tenant-Friendly
- State California
- 18 Strongly Tenant-Friendly · D+13
- County
- — inherits STATE
- City Oakland
- 0 Strongly Tenant-Friendly · D+62
ZIP-level market 94612
- Home prices YoY
- -2.5%
- Rents YoY
- 7.2%
- Active inventory
- 37
- Price-to-rent
- 11.6×
Monthly cashflow live
- Estimated rent
- $7,188 high interval (Pro) →
- Mortgage (P&I)
- −$2,617
- Tax from tax record
- −$677 /mo · $8,119/yr
- Insurance
- −$208
- HOA
- −$0
- Vacancy / Maint / Mgmt
- −$1,509
- Net cashflow
- $2,177
Break-even live
Sensitivity live
| Price | -10% $2,460 | -5% $2,318 | +0% $2,177 | +5% $2,036 | +10% $1,895 |
|---|---|---|---|---|---|
| Rent | -10% $1,609 | -5% $1,893 | +0% $2,177 | +5% $2,461 | +10% $2,745 |
| Rate | -1.0pp $2,429 | -0.5pp $2,304 | base $2,177 | +0.5pp $2,048 | +1.0pp $1,916 |
2-unit breakdown (identical units grouped — click to expand)
| Units | Beds | Baths | Est. rent |
|---|---|---|---|
| 2× units | 3 | 1.5 | $7,188 |
| #1 | 3 | 1.5 | $3,594 |
| #2 | 3 | 1.5 | $3,594 |
| Total (2 units) | $7,188 | ||
UW: 25.0% down · 7.5% · 30yr · 1.5% tax · 5.0% vac · 8.0% maint · 8.0% mgmt
Financing live
Cash to close
- Down payment
- $124,750
- Closing costs
- $14,970
- Reserves months
- —
- Total cash needed
- —
Loan-product check · same deal, 3 products live
Conventional
25% down · 7.5% · 30yr
- Down + closing
- —
- Monthly P&I
- —
- Monthly cashflow
- —
- DSCR
- —
- Eligible?
- —
Personal DTI + credit; lowest rate.
DSCR
20% down · 8.5% · 30yr
- Down + closing
- —
- Monthly P&I
- —
- Monthly cashflow
- —
- DSCR
- —
- Eligible?
- —
No personal income docs; deal must DSCR.
Hard money
10% down · 12.0% · 12mo
- Down + closing
- —
- Monthly P&I
- —
- Monthly cashflow
- —
- DSCR
- —
- Eligible?
- —
Short-term bridge; refi at stabilization.
Rent comps 40 comps
| Address | Beds | Baths | Sqft | Rent | $/sqft | DOM | Units | Dist |
|---|---|---|---|---|---|---|---|---|
| 2330 Webster St Oakland, CA | 2.0 | 1.0–2.0 | 849 | $4,244 | $5.00 | 1d | 11 | 0.09mi |
| 100 Grand Ave Oakland, CA | 3.0 | 1.0–2.0 | 812 | $8,644 | $10.64 | 0d | 4 | 0.09mi |
| 312 24th St Oakland, CA | 2.0 | 1.0–2.0 | 799 | $5,587 | $6.99 | 0d | 6 | 0.11mi |
| 421 25th St Oakland, CA | 2.0 | 2.0 | 1050 | $2,919 | $2.78 | 5d | 1 | 0.21mi |
| 325 27th St Oakland, CA | 2.0 | 1.0–2.0 | 879 | $4,561 | $5.19 | 0d | 22 | 0.23mi |
| 2820 Broadway Oakland, CA | 1.0–2.0 | 1.0–2.0 | 825 | $3,985 | $4.83 | 1d | 12 | 0.32mi |
| 471 26th St Oakland, CA | 1.0–3.0 | 1.0–3.0 | 967 | $3,870 | $4.00 | 1d | 9 | 0.36mi |
| 295 29th St Oakland, CA | 1.0–2.0 | 1.0–2.0 | 865 | $3,957 | $4.57 | 0d | 5 | 0.36mi |
| 2016 Telegraph Ave Oakland, CA | 3.0 | 1.0–3.0 | 1026 | $6,749 | $6.58 | 0d | 7 | 0.37mi |
| 1950 Broadway Oakland, CA | 4.0 | 1.0–2.0 | 737 | $5,631 | $7.64 | 0d | 53 | 0.38mi |
| 303 Adams St #208 Oakland, CA | 2.0 | 2.0 | 1110 | $2,950 | $2.66 | 45d | 1 | 0.38mi |
| 254 29th St Unit 1310765P Oakland, CA | 2.0 | 1.0 | 1097 | $4,264 | $3.89 | 4d | 1 | 0.39mi |
| 1717 Webster St Oakland, CA | 2.0 | 1.0–2.0 | 890 | $5,626 | $6.32 | 0d | 3 | 0.46mi |
| 260 30th St Oakland, CA | 3.0 | 1.0–2.0 | 877 | $4,439 | $5.06 | 0d | 6 | 0.46mi |
| 2817 Telegraph Ave Unit 3 Oakland, CA | 2.0 | 1.0 | 1150 | $1,990 | $1.73 | 45d | 1 | 0.48mi |
| 500 William St Oakland, CA | 3.0 | 1.0–2.0 | 1108 | $4,654 | $4.20 | 0d | 16 | 0.49mi |
| 2933 McClure St Oakland, CA | 3.0 | 2.0 | 1440 | $4,850 | $3.37 | 4d | 1 | 0.50mi |
| 668 21st St Oakland, CA | 2.0–3.0 | 1.0–2.0 | 1112 | $2,233 | $2.01 | 45d | 1 | 0.51mi |
| 3123 Harrison St Oakland, CA | 3.0 | 2.0 | 1450 | $3,800 | $2.62 | 7d | 1 | 0.53mi |
| 447 17th St Oakland, CA | 1.0–2.0 | 1.0–2.0 | 957 | $5,186 | $5.42 | 0d | 14 | 0.53mi |
| 405 Bellevue Ave Unit 201 Oakland, CA | 2.0 | 1.0 | 1190 | $3,662 | $3.08 | 7d | 1 | 0.57mi |
| 3093 Broadway Oakland, CA | 3.0 | 1.0–2.0 | 972 | $4,210 | $4.33 | 0d | 30 | 0.59mi |
| 3093 Broadway Oakland, CA | 2.0 | 1.0–2.0 | 859 | $4,198 | $4.89 | 45d | 18 | 0.59mi |
| 255 MacArthur Blvd Oakland, CA | 1.0–3.0 | 1.0–2.0 | 837 | $3,295 | $3.93 | 45d | 4 | 0.62mi |
| 411 Euclid Ave Unit 11 Oakland, CA | 2.0 | 2.0 | 1050 | $2,795 | $2.66 | 5d | 1 | 0.62mi |
| 1450 Alice St Oakland, CA | 2.0 | 1.0 | 1200 | $2,700 | $2.25 | 5d | 1 | 0.63mi |
| 520 Van Buren Ave Oakland, CA | 1.0–3.0 | 1.0–2.0 | 974 | $3,795 | $3.89 | 45d | 9 | 0.67mi |
| 3010 Martin Luther King Junior Way Oakland, CA | 3.0 | 1.0 | 1700 | $2,990 | $1.76 | 45d | 1 | 0.69mi |
| 3400 Piedmont Ave Unit 302 Oakland, CA | 3.0 | 3.0 | 1074 | $3,485 | $3.24 | 26d | 1 | 0.69mi |
| 385 14th St Oakland, CA | 2.0 | 1.0–2.0 | 827 | $6,062 | $7.33 | 0d | 31 | 0.70mi |
| 238 13th St Oakland, CA | 3.0 | 1.0–2.0 | 1039 | $4,380 | $4.22 | 0d | 13 | 0.71mi |
| 482 Jean St Oakland, CA | 3.0 | 2.0 | 1595 | $4,800 | $3.01 | 26d | 1 | 0.75mi |
| 1100 Webster St Oakland, CA | 3.0 | 1.0–2.0 | 958 | $5,000 | $5.22 | 0d | 9 | 0.79mi |
| 22 Moss Ave Oakland, CA | 2.0 | 2.0 | 1200 | $3,200 | $2.67 | 45d | 1 | 0.81mi |
| 1389 Jefferson St Oakland, CA | 2.0 | 1.0–2.0 | 885 | $3,373 | $3.81 | 0d | 15 | 0.82mi |
| 459 36th St Oakland, CA | 3.0 | 1.0 | 1053 | $2,495 | $2.37 | 45d | 1 | 0.83mi |
| 814 30th St Emeryville, CA | 4.0 | 2.0 | 2015 | $7,000 | $3.47 | 5d | 1 | 0.84mi |
| 1150 Clay St Oakland, CA | 1.0–2.0 | 1.0–2.0 | 798 | $3,177 | $3.98 | 1d | 5 | 0.87mi |
| 555 El Dorado Ave Oakland, CA | 2.0 | 1.0 | 1100 | $3,400 | $3.09 | 1d | 1 | 0.87mi |
| 2006 Market St Oakland, CA | 2.0 | 2.5 | 1250 | $2,995 | $2.40 | 14d | 1 | 0.88mi |
Listing history 5 events
-
2025-08-08status Pending
-
2025-07-01$499,000 Active
-
2006-06-09soldstatus $92,000
-
1991-06-11soldstatus $315,000
-
1985-10-25soldstatus $170,000
ⓘ Source: listings_history table (triggers on properties + properties_extension) + one-shot
backfill from property_details.listing_events for pre-trigger history.
Tax reassessment forecast CA · Resets to sale price
- Current annual tax
- $8,119 · $677/mo
- Projected year-2 tax
- $8,119 · $677/mo
- Expected delta
- $0/yr ($0/mo · 0.0%)
ⓘ Screening estimate from a state-policy table — verify with the county assessor before closing.
Climate risk First Street
- Flood 4/10 Moderate FEMA zone X (unshaded) · 22% chance over 30 yrs
- Wildfire 1/10 Low
- Heat 3/10 Moderate 7 d/yr ≥84°F today · 15 d/yr by 30 yrs out
- Wind 1/10 Low
- Air quality 9/10 Extreme 16 unhealthy d/yr today · 16 by 30 yrs out
Nearby sold comps map
Loading sold comps map…
Walkable amenities ~0.75 mi
Loading nearby amenities…
Taxation est. · year 1
- Rental income
- $86,256
- − Mortgage interest
- −$27,952
- − Property taxes
- −$8,119
- − Insurance
- −$2,495
- − Repairs & maintenance
- −$6,900
- − Management
- −$6,900
- − Depreciation
- −$14,516
- Taxable income
- $19,373
- Est. tax owed @ 24.0%
- −$4,649
- After-tax cash flow
- $21,477/yr
For passive investors: Depreciation is non-cash, so a rental often shows a tax loss while cash-flowing — sheltering income. Rental losses are passive: they offset passive income freely, and up to $25,000/yr can offset ordinary (W-2) income if you actively participate and your MAGI is under $100k (phasing out to $0 by $150k); unused losses carry forward. On sale, claimed depreciation is recaptured at up to 25%, and gains may owe capital-gains tax (a 1031 exchange can defer both). Figures are a year-1 estimate at your 24.0% rate — not tax advice; consult a CPA.
Schools (NCES district)
- District
- Oakland Unified
- NCES district ID
- 0628050
- Math proficiency
- 27% ▬ 0.00%
- Reading proficiency
- 33% ▬ 0.00%
- Median HH income
- $55,194
- Composite
- 29.52/100
- National rank
- #11769
- State rank
- #1007 of 1400 in CA
Livability — Oakland
- Score
- 71/100
- State rank
- #224
- US rank
- #7245
Category grades
Schools grade is shown separately in the Schools card above.
Census & demographics
- Census place
- Oakland, CA
- County
- Alameda County · 1,614,355 people
- City population
- 385,993
- Metro
- San Francisco-Oakland-Berkeley, CA
- Population (ZIP)
- 18,175
- Household income
- $74,037
- Rent vs Own
- Severe rent burden
- 2526.0
Population outlook (Alameda County) Hauer SSP2
- Today (2025)
- 1,928,884 people
- By 2030
- 2,069,146 · +7.3%
- By 2040
- 2,338,405 · +21.2%
- By 2050
- 2,586,608 · +34.1%
- By 2075
- 3,061,911 · +58.7%
- By 2100
- 3,234,133 · +67.7%
Race, ethnicity, and origin ACS 2023
- Neighborhood character
- Highly diverse neighborhood (Simpson 0.76)
- Race & ethnicity
- White 30% Asian 27% Black 26% Hispanic / Latino 10% Two or more races 8%
- Hispanic origin (detail)
- Mexican 7%
- Common ancestry
- Romanian 2% Slovak 2% Italian 2%
- Foreign-born
- 32% · China, Canada, South Korea
- Languages at home
- 65% English-only · Chinese 14% Spanish 5% Other Indo-European 3%
Political lean MEDSL · Alameda
- 2024 margin
- Solid D (+53.6) · D 74.6% · R 21.0% · Other 4.4%
- 2008→2024 swing
- -5.9pp toward R · 2008: 59.5pp · 2024: 53.6pp
- All cycles
- 2024: D+53.6 2020: D+62.5 2016: D+64.4 2012: D+59.8 2008: D+59.5
Not yet ingested
- Civics
- —
Market trends
- HPI YoY
- ▼ -5.34%
- Current HPI
- 212.2879
- Rent YoY
- ▲ 7.23%
- Metro
- San Francisco-Oakland-Berkeley, CA
- State GDP YoY
- ▲ 3.21%
- F500 in state
- 116
Industry mix (Fortune 500 HQ in CA)
| Industry | F500 HQs | Revenue |
|---|---|---|
| Technology | 27 | $1,492B |
|
||
| Financial Services | 3 | $174B |
|
||
| Retail | 3 | $44B |
|
||
| Insurance | 3 | $26B |
|
||
| Media / Entertainment | 2 | $115B |
|
||
| Pharmaceuticals / Biotech | 2 | $62B |
|
||
Price history
+193.5% since first listed5 events — show timeline
- 2025-08-08 Pending — bridgeMLS, Bay East AOR, or Contra Costa AOR
- 2025-07-01 Listed $499,000 bridgeMLS, Bay East AOR, or Contra Costa AOR
- 2006-06-09 Sold (Public Records) $92,000 Public Records
- 1991-06-11 Sold (Public Records) $315,000 Public Records
- 1985-10-25 Sold (Public Records) $170,000 Public Records
Property tax history
+2.5%/yrLatest (2025): $8,119 · +4.2% YoY. Source: county tax records.
Cash-flow waterfall
monthlySold comps — $/sqft
last 12 mo · ≤1 miLoading sold comps…