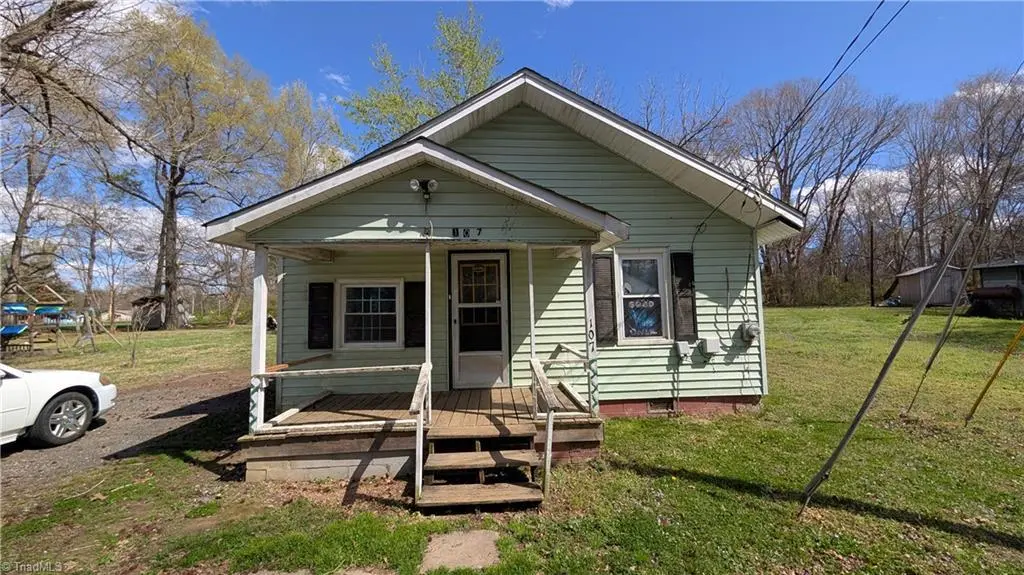
107 Murphy St · Liberty, NC
Flood risk 1/10 · Minimal
- FEMA flood zone
- X (unshaded)
- Chance of flooding over 30 yrs
- 0.0%
- Est. flood insurance / yr
- $507 – $1,088
Fire risk 4/10 · Minor
- Est. fire insurance / yr
- $906 – $1,684
Heat risk 5/10 · Moderate
- Hot days now (above 102°F)
- 7 days/yr
- Hot days in 30 yrs
- 17 days/yr
Wind risk 5/10 · Moderate
- Chance of severe wind over 30 yrs
- 25.0%
Air-quality risk 2/10 · Minimal
- Unhealthy air days now
- 1 days/yr
- Unhealthy air days in 30 yrs
- 1 days/yr
Risk factors via First Street. Map © Google.
Why this score? — see what drove the B- grade
The composite is a weighted blend of 9 inputs, each scored 0–100. Each bar is that input's sub-score; the figure is the points it added to the 100-point composite (weight × sub-score).
- Cash flow +30.0/30.0
- 1% rule +10.0/10.0
- DSCR +10.0/10.0
- ARV discount +7.5/15.0
- Livability +3.7/5.0
- Schools +3.6/10.0
- Rent growth +2.5/5.0
- Condition / age +2.5/5.0
- Appreciation +0.0/10.0
$105,900
🖨 Deal sheet (PDF) 📄 Offer letter ✓ Due diligence
Listing remarks
Located just minutes from the Greensboro-Randolph Megasite, home to the massive Toyota Battery Manufacturing North Carolina plant. This 2 bedroom 1 bath home makes it an excellent choice for those working at the facility or looking to invest in a rapidly growing area. Enjoy quick access to U. S. Highway 421, providing a straightforward route to Greensboro, Burlington, and the wider Piedmont Triad. You are within a short distance of the Liberty Plaza Shopping Center, which features a Food Lion grocery store, CVS Pharmacy, and other essential retail options. Experience the "suburban rural mix" that Liberty is known for, with a friendly community atmosphere. Whether you are looking f
Key facts
- 7,405 sq ft lot
- Built 1940
- Listed 94 days
Property features AI
Finance
- HOA & community: No homeowners association; Subdivision: Rosenwald Park
Exterior
- Parking: Driveway
- Utilities: Public sewer; Electric water heater
- Home design: Single-story house; Stick/site-built residential property; Built in 1940; Existing structure
- Construction: Wood siding exterior
- Exterior features: Public water service; Publicly maintained road access; Lot spans lots 121-122
Interior
- Bathrooms: 1 full bathroom
- Heating & cooling: Heat pump for heating and cooling; Electric heating fuel
- Interior features: Primary bedroom on the main level
Neighborhood map
What this means for you Summary
Snapshot
- This is a 2-bed/1.0-bath single-family listed at $106k.
Deal economics
- At list price, monthly cash flow is $620 ($7k/yr) — positive.
- The deal already cash-flows at list — no discount required.
- Meets the 1% rule at list price ($2k rent vs $106k).
- Recommended offer: $96k (9.0% below list) — sets the bar for market timing.
- Cap rate 13.3% vs local median 4.1% in Liberty — top-decile yield for the area; either an underpriced asset or a hidden risk that comps aren't pricing in. Stress-test before assuming the spread holds.
Location & tenants
- Location reads 74/100 on livability (#56 in NC, #4,472 nationally) — a middle-class / working-renter tenant base. Strengths: cost of living A+, housing A+, health & safety A+; Watch: amenities F, commute F, employment F.
- Randolph County School System (rural): math 43% / reading 43% proficiency, ranked #94 of 178 in NC (top 53%) — families likely to look elsewhere, expect single-tenant / working-renter base with shorter leases.
- Zoned schools: Liberty Elementary School (math 42% / reading 37%, grade F, #694 of 1,410 statewide, top 53%, 415 students, 77% FRL); Northeastern Randolph Middle School (math 36% / reading 39%, grade F, #256 of 475 statewide, top 55%, 481 students, 61% FRL); Providence Grove High School (math 47% / reading 52%, grade D, #311 of 535 statewide, top 60%, 653 students, 51% FRL).
- Market conditions: 80 active listings in the ZIP; 1 comparable units currently listed for rent nearby; 789 units permitted in Randolph County in 2024 (168 in 5+ unit buildings).
Forward outlook
- Local home prices are declining (-3.0%/yr); year-one equity from $732 of loan paydown is wiped out by about $3k of value loss. Plan a longer hold.
- Randolph County population projected to shrink 10% by 2050 — rents likely to lag national; underwrite the cash flow, not the appreciation.
- At projected returns (-3.0% appreciation + 3.0% rent growth), your $30k cash investment doubles in ~5 years — after that, you're playing with house money.
Negotiation context
- It's been on market 94 days — a 9% lower offer ($96k) is reasonable based on typical stale-listing flexibility.
Risks & watch-outs
- Watch-outs: built in 1940 — expect roof / HVAC / electrical / plumbing capex.
- Climate carrying-cost: moderate wind risk, 25% chance of damaging wind over 30y; extreme-heat days projected 7→17/yr by 2055 (HVAC capex compounding) — expect insurance premiums to compound above CPI over the hold.
Questions for the listing agent
- It's been on market 94 days. Have you received any prior offers? Is the seller open to a 9% concession, seller financing, or rate buy-down credit?
- Built in 1940 — when were the roof, HVAC, electrical panel, plumbing, and water heater last replaced?
- Why hasn't it sold? Are there any deal-killer items the seller is aware of (foundation, flood, title, zoning, code violations)?
- Is there a deadline driving the sale (1031 exchange, divorce, estate, relocation)? That informs how much negotiation room exists.
- Schools are F-rated, which usually means shorter tenancies and higher turnover. Who's the typical renter profile here, and what's been the actual vacancy rate?
- What's the average days-on-market for RENTAL listings here right now (not sales)? A rising rental-DOM trend means longer vacancies and softer asking-rent achievability than the comps imply.
- What's the recent tenant-quality profile in this submarket — average credit score on applications, eviction rate, late-payment / NSF rate, and stable-employment percentage? A property-management company in the area should have these aggregated.
- How much new for-sale + rental construction is in the pipeline within 1–3 miles? Heavy new supply typically softens prices + rents 12–24 months out; constrained supply supports both.
Investment metrics
- 1% rule
- 1.53% ✓
- Cap rate
- 13.32%
- Cash-on-cash
- 25.10%
- DSCR
- 2.12
- GRM
- 5.4
CMA / ARV
No comps found within radius.
Projected returns pro-forma
-3.0% appreciation · 3.0% rent growth · sell at horizon
- IRR
- 18.6%
- Equity multiple
- 1.75×
- Total profit
- $22,328
- Equity at exit
- $15,790
- IRR
- 26.9%
- Equity multiple
- 3.37×
- Total profit
- $70,241
- Equity at exit
- $9,156
Cash invested: $29,652 (down + closing). Projections, not guarantees.
Landlord ↔ Tenant lean methodology
- Overall (STATE)
- 85 Strongly Landlord-Friendly
- State North Carolina
- 85 Strongly Landlord-Friendly · R+3
- County
- — inherits STATE
- City
- — inherits STATE
ZIP-level market 27298
- Home prices YoY
- -12.8%
- Active inventory
- 80
- Price-to-rent
- 5.4×
Monthly cashflow live
- Estimated rent
- $1,625 medium interval (Pro) →
- Mortgage (P&I)
- −$555
- Tax from tax record
- −$64 /mo · $768/yr
- Insurance
- −$44
- HOA
- −$0
- Lot rent
- −$0
- Vacancy / Maint / Mgmt
- −$341
- Net cashflow
- $620
Break-even live
Sensitivity live
| Price | -10% $680 | -5% $650 | +0% $620 | +5% $590 | +10% $560 |
|---|---|---|---|---|---|
| Rent | -10% $492 | -5% $556 | +0% $620 | +5% $684 | +10% $749 |
| Rate | -1.0pp $674 | -0.5pp $647 | base $620 | +0.5pp $593 | +1.0pp $565 |
UW: 25.0% down · 7.5% · 30yr · 1.5% tax · 5.0% vac · 8.0% maint · 8.0% mgmt
Financing live
Cash to close
- Down payment
- $26,475
- Closing costs
- $3,177
- Reserves months
- —
- Total cash needed
- —
Loan-product check · same deal, 3 products live
Conventional
25% down · 7.5% · 30yr
- Down + closing
- —
- Monthly P&I
- —
- Monthly cashflow
- —
- DSCR
- —
- Eligible?
- —
Personal DTI + credit; lowest rate.
DSCR
20% down · 8.5% · 30yr
- Down + closing
- —
- Monthly P&I
- —
- Monthly cashflow
- —
- DSCR
- —
- Eligible?
- —
No personal income docs; deal must DSCR.
Hard money
10% down · 12.0% · 12mo
- Down + closing
- —
- Monthly P&I
- —
- Monthly cashflow
- —
- DSCR
- —
- Eligible?
- —
Short-term bridge; refi at stabilization.
Rent comps 1 comps
| Address | Beds | Baths | Sqft | Rent | $/sqft | DOM | Units | Dist |
|---|---|---|---|---|---|---|---|---|
| 315 E Dameron Ave Liberty, NC | 3.0 | 1.0 | 1050 | $1,625 | $1.55 | 0d | 1 | 1.15mi |
Listing history 19 events
-
2026-06-21days on market $105,900 Active 94 DOM
-
2026-06-18days on market $105,900 Active 91 DOM
-
2026-06-17days on market $105,900 Active 90 DOM
-
2026-06-16days on market $105,900 Active 89 DOM
-
2026-06-15days on market $105,900 Active 88 DOM
-
2026-06-14days on market $105,900 Active 86 DOM
-
2026-06-10days on market $105,900 Active 83 DOM
-
2026-06-09days on market $105,900 Active 82 DOM
-
2026-06-08days on market $105,900 Active 81 DOM
-
2026-06-07days on market $105,900 Active 80 DOM
-
2026-06-05days on market $105,900 Active 77 DOM
-
2026-06-03days on market $105,900 Active 76 DOM
-
2026-06-02days on market $105,900 Active 75 DOM
-
2026-06-01days on market $105,900 Active 74 DOM
-
2026-05-31days on market $105,900 Active 73 DOM
-
2026-05-31days on market $105,900 Active 72 DOM
-
2026-05-13price $105,900
-
2026-04-21price $115,000
-
2026-03-19$119,900 Active
ⓘ Source: listings_history table (triggers on properties + properties_extension) + one-shot
backfill from property_details.listing_events for pre-trigger history.
Tax reassessment forecast NC · Resets to sale price
- Current annual tax
- $768 · $64/mo
- Projected year-2 tax
- $868 · $72/mo
- Expected delta
- +$100/yr (+$8/mo · 13.1%)
ⓘ Screening estimate from a state-policy table — verify with the county assessor before closing.
Climate risk First Street
- Flood 1/10 Low FEMA zone X (unshaded) · 0% chance over 30 yrs
- Wildfire 4/10 Moderate
- Heat 5/10 Major 7 d/yr ≥102°F today · 17 d/yr by 30 yrs out
- Wind 5/10 Major 25% chance of damaging wind over 30 yrs
- Air quality 2/10 Low 1 unhealthy d/yr today · 1 by 30 yrs out
Nearby sold comps map
Loading sold comps map…
Walkable amenities ~0.75 mi
Loading nearby amenities…
Taxation est. · year 1
- Rental income
- $19,500
- − Mortgage interest
- −$5,932
- − Property taxes
- −$768
- − Insurance
- −$530
- − Repairs & maintenance
- −$1,560
- − Management
- −$1,560
- − Depreciation
- −$3,081
- Taxable income
- $6,070
- Est. tax owed @ 24.0%
- −$1,457
- After-tax cash flow
- $5,987/yr
For passive investors: Depreciation is non-cash, so a rental often shows a tax loss while cash-flowing — sheltering income. Rental losses are passive: they offset passive income freely, and up to $25,000/yr can offset ordinary (W-2) income if you actively participate and your MAGI is under $100k (phasing out to $0 by $150k); unused losses carry forward. On sale, claimed depreciation is recaptured at up to 25%, and gains may owe capital-gains tax (a 1031 exchange can defer both). Figures are a year-1 estimate at your 24.0% rate — not tax advice; consult a CPA.
Schools (NCES district)
- District
- Randolph County School System
- NCES district ID
- 3703780
- Math proficiency
- 43% ▲ 1.00%
- Reading proficiency
- 43% ▲ 2.00%
- Median HH income
- $43,490
- Composite
- 36.37/100
- National rank
- #4686
- State rank
- #94 of 178 in NC
Livability — Liberty
- Score
- 74/100
- State rank
- #56
- US rank
- #4472
Category grades
Schools grade is shown separately in the Schools card above.
Census & demographics
- Census place
- Liberty, NC
- Population (ZIP)
- 10,507
Population outlook (Randolph County) Hauer SSP2
- Today (2025)
- 142,640 people
- By 2030
- 140,911 · -1.2%
- By 2040
- 135,692 · -4.9%
- By 2050
- 128,575 · -9.9%
- By 2075
- 111,507 · -21.8%
- By 2100
- 93,376 · -34.5%
Race, ethnicity, and origin ACS 2023
- Neighborhood character
- Predominantly White (76%)
- Race & ethnicity
- White 76% Hispanic / Latino 15% Two or more races 10% Black 7%
- Hispanic origin (detail)
- Mexican 12%
- Common ancestry
- Slovak 4% Lithuanian 2% Serbian 1%
- Foreign-born
- 7% · Canada
- Languages at home
- 90% English-only · Spanish 9% French/Haitian/Cajun 1%
Political lean MEDSL · Randolph
- 2024 margin
- Solid R (+57.2) · D 21.0% · R 78.3%
- 2008→2024 swing
- -15.0pp toward R · 2008: -42.3pp · 2024: -57.2pp
- All cycles
- 2024: R+57.2 2020: R+56.3 2016: R+56.7 2012: R+50.2 2008: R+42.3
Not yet ingested
- Civics
- —
Market trends
- HPI YoY
- ▼ -37.90%
- Current HPI
- 257.7834
- Rent YoY
- —
- Metro
- —
- State GDP YoY
- ▲ 3.28%
- F500 in state
- 26
Industry mix (Fortune 500 HQ in NC)
| Industry | F500 HQs | Revenue |
|---|---|---|
| Financial Services | 2 | $213B |
|
||
| Retail | 2 | $95B |
|
||
| Industrial Conglomerate | 1 | $38B |
|
||
| Metals / Steel | 1 | $35B |
|
||
| Utilities | 1 | $30B |
|
||
| Industrial Machinery | 1 | $19B |
|
||
Price history
-11.7% since first listed3 events — show timeline
- 2026-05-13 Price Changed $105,900 Triad MLS
- 2026-04-21 Price Changed $115,000 Triad MLS
- 2026-03-19 Listed $119,900 Triad MLS
Property tax history
+6.3%/yrLatest (2025): $768 · +7.0% YoY. Source: county tax records.
Cash-flow waterfall
monthlySold comps — $/sqft
last 12 mo · ≤1 miLoading sold comps…