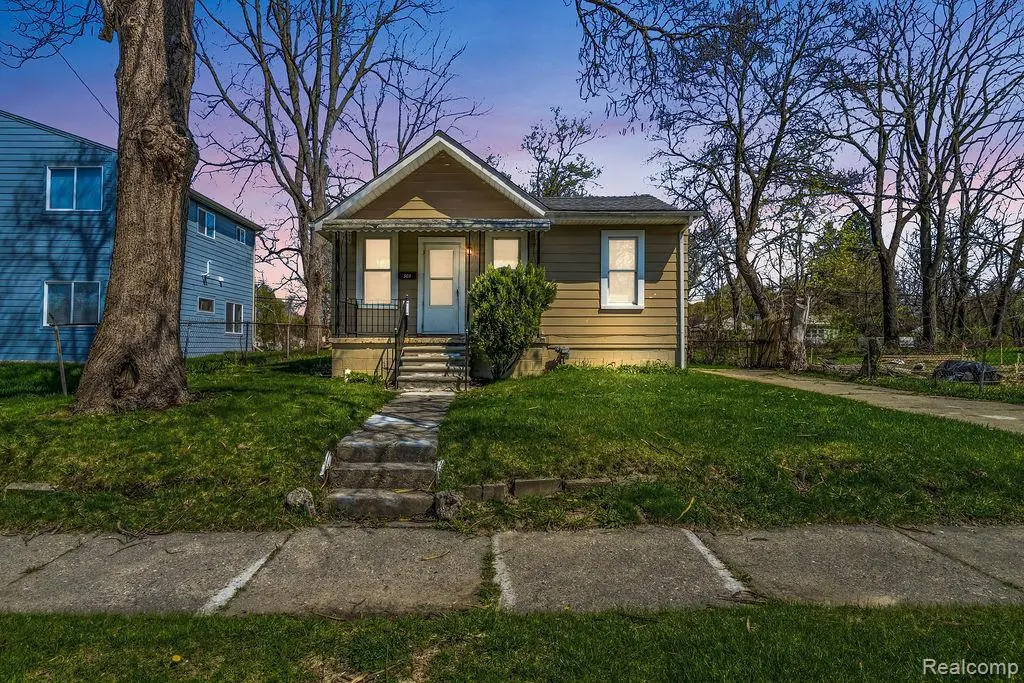
503 Bloomfield Ave · Pontiac, MI
Flood risk 1/10 · Minimal
- FEMA flood zone
- X (unshaded)
- Chance of flooding over 30 yrs
- 0.0%
- Est. flood insurance / yr
- $473 – $860
Fire risk 1/10 · Minimal
- Est. fire insurance / yr
- $784 – $1,456
Heat risk 2/10 · Minimal
- Hot days now (above 96°F)
- 7 days/yr
- Hot days in 30 yrs
- 14 days/yr
Wind risk 2/10 · Minimal
- Chance of severe wind over 30 yrs
- —
Air-quality risk 3/10 · Minor
- Unhealthy air days now
- 2 days/yr
- Unhealthy air days in 30 yrs
- 4 days/yr
Risk factors via First Street. Map © Google.
Why this score? — see what drove the B grade
The composite is a weighted blend of 9 inputs, each scored 0–100. Each bar is that input's sub-score; the figure is the points it added to the 100-point composite (weight × sub-score).
- Cash flow +30.0/30.0
- ARV discount +13.0/15.0
- DSCR +10.0/10.0
- 1% rule +9.3/10.0
- Livability +3.2/5.0
- Rent growth +2.5/5.0
- Condition / age +2.5/5.0
- Schools +1.0/10.0
- Appreciation +0.0/10.0
$110,000
🖨 Deal sheet (PDF) 📄 Offer letter ✓ Due diligence
Listing remarks MLS
Charming and updated ranch with standout curb appeal and a cozy, welcoming feel. Featuring an inviting front porch and elevated lot, this home offers a great blend of character and modern updates. Improvements include new shingles and flooring (2018), updated appliances, fresh paint (2020), brand new furnace (2025), and updated lighting (2026). Move in ready with major updates already completed!
Key facts
- Updated appliances
- Fresh paint
- Front porch
Tags
Property features AI
Exterior
- Parking: No garage
- Utilities: Public water; Public sewer; Water available
- Home design: Single-family residence; One level; Ground-level entry
- Construction: Aluminum siding; Block foundation
- Exterior features: Asphalt roof; Paved road access; Lot dimensions approximately 50 x 150 (0.17 acres)
Interior
- Kitchen: Gas cooktop; Free-standing gas oven; Free-standing refrigerator
- Bedrooms: Total rooms: 3
- Bathrooms: 2 full bathrooms
- Heating & cooling: Forced air heating; Natural gas heating; No cooling
- Interior features: Gas water heater; Free-standing gas oven; Free-standing refrigerator; Gas cooktop; Unfinished basement
Neighborhood map
What this means for you Summary
Snapshot
- This is a 3-bed/1.0-bath single-family listed at $110k.
Deal economics
- At list price, monthly cash flow is $557 ($7k/yr) — positive.
- The deal already cash-flows at list — no discount required.
- Meets the 1% rule at list price ($2k rent vs $110k).
- Recommended offer: $108k (1.5% below list) — sets the bar for market timing.
- Cap rate 12.4% vs local median 5.4% in Pontiac — top-decile yield for the area; either an underpriced asset or a hidden risk that comps aren't pricing in. Stress-test before assuming the spread holds.
Location & tenants
- Location reads 64/100 on livability (#499 in MI) — a middle-class / working-renter tenant base. Strengths: commute A+, cost of living A+, housing A+; Watch: health & safety D, crime F, amenities F.
- Pontiac City School District (urban): math 8% / reading 17% proficiency, ranked #514 of 540 in MI (top 95%) — low school quality limits family demand, transient renter base, plan for 1-2y turnover; 81% free/reduced lunch — lower-income household profile, screen leases tightly.
- Zoned schools: Whitman Elementary School (math 8% / reading 8%, grade F, #1,300 of 1,397 statewide, top 94%, 601 students, 81% FRL); Pontiac Middle School (math 8% / reading 23%, grade F, #450 of 493 statewide, top 91%, 729 students, 81% FRL); Pontiac High School (math 12% / reading 27%, grade F, #622 of 713 statewide, top 88%, 935 students, 75% FRL) — zoned schools at 79% FRL track the district average.
- Market conditions: 100 active listings in the ZIP; 11 comparable units currently listed for rent nearby; rentals at typical pace (median 19d on market — plan ~3-4 weeks tenant-placement turnaround); 2,614 units permitted in Oakland County in 2024 (721 in 5+ unit buildings).
- This rent runs 37% of the median local income ($51k/yr) — at the standard rent-burdened threshold; future hikes will face affordability resistance.
Forward outlook
- Local home prices are declining (-3.0%/yr); year-one equity from $761 of loan paydown is wiped out by about $3k of value loss. Plan a longer hold.
- Oakland County population projected at +10% by 2050 — modest demand growth; plan on rents tracking national, not racing it.
- At projected returns (-3.0% appreciation + 3.0% rent growth), your $31k cash investment doubles in ~6 years — after that, you're playing with house money.
Negotiation context
- It's been on market 17 days — a 2% lower offer ($108k) is reasonable based on typical stale-listing flexibility.
- 2 sale attempts with the ask held roughly flat each time — persistent listings suggest the price (not the market) is what's stuck; bring a comps-based counter.
Risks & watch-outs
- Watch-outs: built in 1910 — expect roof / HVAC / electrical / plumbing capex.
Questions for the listing agent
- Built in 1910 — when were the roof, HVAC, electrical panel, plumbing, and water heater last replaced?
- Is there a deadline driving the sale (1031 exchange, divorce, estate, relocation)? That informs how much negotiation room exists.
- Schools are F-rated, which usually means shorter tenancies and higher turnover. Who's the typical renter profile here, and what's been the actual vacancy rate?
- Crime grade is F in this area — have there been break-ins, vandalism, or insurance claims at this property in the last 3 years? What carrier currently insures it and at what premium?
- What's the average days-on-market for RENTAL listings here right now (not sales)? A rising rental-DOM trend means longer vacancies and softer asking-rent achievability than the comps imply.
- What's the recent tenant-quality profile in this submarket — average credit score on applications, eviction rate, late-payment / NSF rate, and stable-employment percentage? A property-management company in the area should have these aggregated.
- How much new for-sale + rental construction is in the pipeline within 1–3 miles? Heavy new supply typically softens prices + rents 12–24 months out; constrained supply supports both.
Investment metrics
- 1% rule
- 1.43% ✓
- Cap rate
- 12.37%
- Cash-on-cash
- 21.71%
- DSCR
- 1.97
- GRM
- 5.8
CMA / ARV
- ARV (median comp)
- $125,235
- List price
- $110,000
- Delta
- -12.17%
- Verdict
- UNDERPRICED
- Comps
- 20 within 1.0 mi
Show comp detail 12 sales within ~0.75 mi
| Address | Dist | Beds/Ba | Sqft | Sold | Price | $/sf | Match |
|---|---|---|---|---|---|---|---|
| 256 Cedardale Ave | 0.14mi | 3/1.0 | 1,348 (+4%) | 2mo | $100,000 | $74 | 85 |
| 582 Nevada Ave | 0.51mi | 3/1.0 | 1,346 (+4%) | 2mo | $135,000 | $100 | 67 |
| 438 Franklin Rd | 0.26mi | 3/1.0 | 1,444 (+12%) | 1mo | $160,000 | $111 | 67 |
| 442 Howland Ave | 0.12mi | 2/1.0 (-1) | 1,159 (-10%) | 11mo | $135,000 | $116 | 64 |
| 497 Montana Ave | 0.37mi | 4/1.0 (+1) | 1,195 (-7%) | 4mo | $102,000 | $85 | 62 |
| 551 Nebraska Ave | 0.43mi | 3/2.0 | 1,247 (-3%) | 11mo | $66,000 | $53 | 61 |
| 353 South Blvd W | 0.49mi | 2/1.0 (-1) | 1,303 (+1%) | 12mo | $90,000 | $69 | 61 |
| 313 W Wilson Ave | 0.69mi | 2/1.0 (-1) | 1,301 (+1%) | 6mo | $53,500 | $41 | 56 |
| 200 Prospect St | 0.67mi | 3/1.0 | 1,350 (+5%) | 9mo | $63,000 | $47 | 54 |
| 354 Ferry Ave | 0.66mi | 3/1.0 | 1,222 (-5%) | 8mo | $140,000 | $115 | 54 |
| 483 Pearsall Ave | 0.44mi | 2/1.5 (-1) | 1,138 (-12%) | 3mo | $139,900 | $123 | 50 |
| 205 Hughes Ave | 0.46mi | 4/1.5 (+1) | 1,426 (+10%) | 5mo | $100,000 | $70 | 50 |
Match score weights: distance 35% · size 25% · config 20% · recency 20%. Top-matched comps best support the ARV.
Projected returns pro-forma
-3.0% appreciation · 3.0% rent growth · sell at horizon
- IRR
- 14.3%
- Equity multiple
- 1.57×
- Total profit
- $17,649
- Equity at exit
- $16,401
- IRR
- 23.1%
- Equity multiple
- 2.98×
- Total profit
- $60,988
- Equity at exit
- $9,511
Cash invested: $30,800 (down + closing). Projections, not guarantees.
Landlord ↔ Tenant lean methodology
- Overall (STATE)
- 62 Landlord-Friendly
- State Michigan
- 62 Landlord-Friendly · EVEN
- County
- — inherits STATE
- City
- — inherits STATE
ZIP-level market 48341
- Active inventory
- 100
- Price-to-rent
- 5.8×
Monthly cashflow live
- Estimated rent
- $1,576 high interval (Pro) →
- Mortgage (P&I)
- −$577
- Tax from tax record
- −$65 /mo · $776/yr
- Insurance
- −$46
- HOA
- −$0
- Vacancy / Maint / Mgmt
- −$331
- Net cashflow
- $557
Break-even live
Sensitivity live
| Price | -10% $620 | -5% $588 | +0% $557 | +5% $526 | +10% $495 |
|---|---|---|---|---|---|
| Rent | -10% $433 | -5% $495 | +0% $557 | +5% $620 | +10% $682 |
| Rate | -1.0pp $613 | -0.5pp $585 | base $557 | +0.5pp $529 | +1.0pp $500 |
UW: 25.0% down · 7.5% · 30yr · 1.5% tax · 5.0% vac · 8.0% maint · 8.0% mgmt
Financing live
Cash to close
- Down payment
- $27,500
- Closing costs
- $3,300
- Reserves months
- —
- Total cash needed
- —
Loan-product check · same deal, 3 products live
Conventional
25% down · 7.5% · 30yr
- Down + closing
- —
- Monthly P&I
- —
- Monthly cashflow
- —
- DSCR
- —
- Eligible?
- —
Personal DTI + credit; lowest rate.
DSCR
20% down · 8.5% · 30yr
- Down + closing
- —
- Monthly P&I
- —
- Monthly cashflow
- —
- DSCR
- —
- Eligible?
- —
No personal income docs; deal must DSCR.
Hard money
10% down · 12.0% · 12mo
- Down + closing
- —
- Monthly P&I
- —
- Monthly cashflow
- —
- DSCR
- —
- Eligible?
- —
Short-term bridge; refi at stabilization.
Rent comps 11 comps
| Address | Beds | Baths | Sqft | Rent | $/sqft | DOM | Units | Dist |
|---|---|---|---|---|---|---|---|---|
| 471 Montana Ave Pontiac, MI | 3.0 | 1.0 | 1017 | $1,599 | $1.57 | 45d | 1 | 0.31mi |
| 594 Colorado Ave Pontiac, MI | 3.0 | 1.0 | 1008 | $1,075 | $1.07 | 26d | 1 | 0.50mi |
| 611 Montana Ave Pontiac, MI | 3.0 | 1.0 | 1112 | $1,350 | $1.21 | 45d | 1 | 0.55mi |
| 249 W Wilson Ave Unit 1 Pontiac, MI | 3.0 | 1.0 | 900 | $1,540 | $1.71 | 45d | 1 | 0.58mi |
| 124 Alice Ave Bloomfield Township, MI | 3.0 | 1.0 | 1440 | $2,000 | $1.39 | 6d | 1 | 0.72mi |
| 442 Central Ave Unit 1 Pontiac, MI | 2.0 | 1.0 | 1500 | $1,500 | $1.00 | 6d | 1 | 0.75mi |
| 442 Central Ave Pontiac, MI | 2.0 | 1.0 | 1500 | $1,250 | $0.83 | 18d | 1 | 0.75mi |
| 2083 S Telegraph Rd Bloomfield Twp, MI | 1.0–2.0 | 1.0–2.0 | 938 | $2,338 | $2.49 | 0d | 23 | 0.82mi |
| 489 Central Ave Pontiac, MI | 2.0 | 1.0 | 1140 | $1,195 | $1.05 | 6d | 1 | 0.84mi |
| 1974 Klingensmith Rd #4 Bloomfield Hills, MI | 2.0 | 2.0 | 1219 | $1,995 | $1.64 | 19d | 1 | 1.29mi |
| 128 S Edith St Pontiac, MI | 2.0–3.0 | 2.0 | 1155 | $1,700 | $1.47 | 19d | 1 | 1.39mi |
Listing history 4 events
-
2026-05-11status Pending 398-char remark
Show marketing remark (398 chars)
Charming and updated ranch with standout curb appeal and a cozy, welcoming feel. Featuring an inviting front porch and elevated lot, this home offers a great blend of character and modern updates. Improvements include new shingles and flooring (2018), updated appliances, fresh paint (2020), brand new furnace (2025), and updated lighting (2026). Move in ready with major updates already completed!
-
2026-04-24$110,000 Active 398-char remark
Show marketing remark (398 chars)
Charming and updated ranch with standout curb appeal and a cozy, welcoming feel. Featuring an inviting front porch and elevated lot, this home offers a great blend of character and modern updates. Improvements include new shingles and flooring (2018), updated appliances, fresh paint (2020), brand new furnace (2025), and updated lighting (2026). Move in ready with major updates already completed!
ⓘ Source: listings_history table (triggers on properties + properties_extension) + one-shot
backfill from property_details.listing_events for pre-trigger history.
Tax reassessment forecast MI · Partial reset (capped growth)
- Current annual tax
- $776 · $65/mo
- Projected year-2 tax
- $1,235 · $103/mo
- Expected delta
- +$459/yr (+$38/mo · 59.1%)
ⓘ Screening estimate from a state-policy table — verify with the county assessor before closing.
Climate risk First Street
- Flood 1/10 Low FEMA zone X (unshaded) · 0% chance over 30 yrs
- Wildfire 1/10 Low
- Heat 2/10 Low 7 d/yr ≥96°F today · 14 d/yr by 30 yrs out
- Wind 2/10 Low
- Air quality 3/10 Moderate 2 unhealthy d/yr today · 4 by 30 yrs out
Nearby sold comps map
Loading sold comps map…
Walkable amenities ~0.75 mi
Loading nearby amenities…
Taxation est. · year 1
- Rental income
- $18,906
- − Mortgage interest
- −$6,162
- − Property taxes
- −$776
- − Insurance
- −$550
- − Repairs & maintenance
- −$1,513
- − Management
- −$1,513
- − Depreciation
- −$3,200
- Taxable income
- $5,193
- Est. tax owed @ 24.0%
- −$1,246
- After-tax cash flow
- $5,441/yr
For passive investors: Depreciation is non-cash, so a rental often shows a tax loss while cash-flowing — sheltering income. Rental losses are passive: they offset passive income freely, and up to $25,000/yr can offset ordinary (W-2) income if you actively participate and your MAGI is under $100k (phasing out to $0 by $150k); unused losses carry forward. On sale, claimed depreciation is recaptured at up to 25%, and gains may owe capital-gains tax (a 1031 exchange can defer both). Figures are a year-1 estimate at your 24.0% rate — not tax advice; consult a CPA.
Schools (NCES district)
- District
- Pontiac City School District
- NCES district ID
- 2628740
- Math proficiency
- 8% ▼ -5.00%
- Reading proficiency
- 17% ▼ -3.00%
- Median HH income
- $33,888
- Composite
- 10.12/100
- National rank
- #9802
- State rank
- #514 of 540 in MI
Livability — Pontiac
- Score
- 64/100
- State rank
- #499
- US rank
- #14703
Category grades
Schools grade is shown separately in the Schools card above.
Census & demographics
- Census place
- Pontiac, MI
- County
- Oakland County · 1,009,092 people
- City population
- 44,593
- Metro
- Detroit-Warren-Dearborn, MI
- Population (ZIP)
- 18,924
- Household income
- $51,390
- Rent vs Own
- Severe rent burden
- 833.0
Population outlook (Oakland County) Hauer SSP2
- Today (2025)
- 1,335,747 people
- By 2030
- 1,375,100 · +2.9%
- By 2040
- 1,435,385 · +7.5%
- By 2050
- 1,469,250 · +10.0%
- By 2075
- 1,531,946 · +14.7%
- By 2100
- 1,450,485 · +8.6%
Race, ethnicity, and origin ACS 2023
- Neighborhood character
- Diverse neighborhood (Simpson 0.61)
- Race & ethnicity
- Black 57% White 22% Hispanic / Latino 12% Two or more races 11% Asian 3%
- Hispanic origin (detail)
- Mexican 4% Puerto Rican 2%
- Common ancestry
- Slovak 2% Romanian 1% Swiss 1%
- Foreign-born
- 10% · Canada
- Languages at home
- 86% English-only · Spanish 9% Other Indo-European 1% Other Asian/Pacific 1%
Political lean MEDSL · Oakland
- 2024 margin
- D (+10.6) · D 54.4% · R 43.8% · Other 1.9%
- 2008→2024 swing
- -3.9pp toward R · 2008: 14.5pp · 2024: 10.6pp
- All cycles
- 2024: D+10.6 2020: D+14.1 2016: D+8.1 2012: D+8.1 2008: D+14.5
Not yet ingested
- Civics
- —
Market trends
- HPI YoY
- ▼ -204.11%
- Current HPI
- 257.8941
- Rent YoY
- —
- Metro
- Detroit-Warren-Dearborn, MI
- State GDP YoY
- ▲ 1.37%
- F500 in state
- 28
Industry mix (Fortune 500 HQ in MI)
| Industry | F500 HQs | Revenue |
|---|---|---|
| Automotive Parts | 3 | $48B |
|
||
| Automotive | 2 | $372B |
|
||
| Chemicals | 1 | $45B |
|
||
| Automotive Retail | 1 | $29B |
|
||
| Healthcare / Medical Devices | 1 | $23B |
|
||
| Automotive Technology | 1 | $20B |
|
||
Price history
+0.0% since first listed4 events — show timeline
- 2026-05-11 Pending — MiRealSource-MiMLS
- 2026-05-11 Pending — REALCOMP
- 2026-04-24 Listed $110,000 REALCOMP
- 2026-04-24 Listed $110,000 MiRealSource-MiMLS
Property tax history
+5.5%/yrLatest (2025): $776 · +2.6% YoY. Source: county tax records.
Cash-flow waterfall
monthlySold comps — $/sqft
last 12 mo · ≤1 miLoading sold comps…