 Duplex
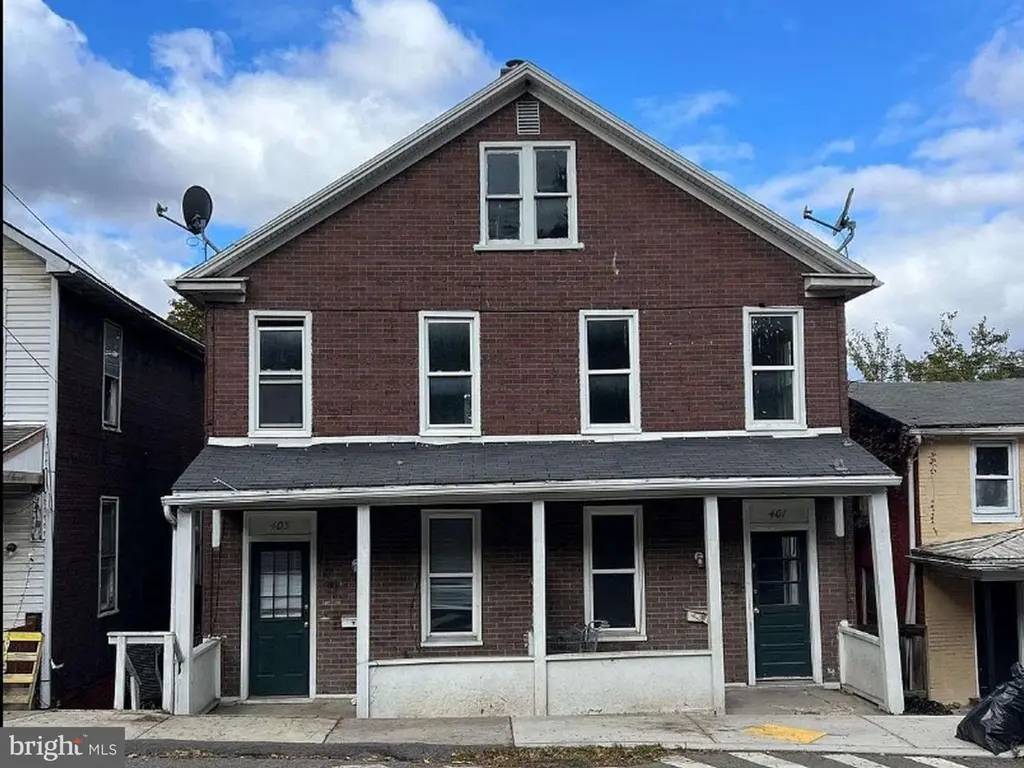
401 - 403 Ascension St · Cumberland, MD
Flood risk 1/10 · Minimal
- FEMA flood zone
- X (unshaded)
- Chance of flooding over 30 yrs
- 0.0%
- Est. flood insurance / yr
- $473 – $860
Fire risk 4/10 · Minor
- Est. fire insurance / yr
- $755 – $1,403
Heat risk 5/10 · Moderate
- Hot days now (above 101°F)
- 7 days/yr
- Hot days in 30 yrs
- 17 days/yr
Wind risk 2/10 · Minimal
- Chance of severe wind over 30 yrs
- —
Air-quality risk 2/10 · Minimal
- Unhealthy air days now
- 0 days/yr
- Unhealthy air days in 30 yrs
- 1 days/yr
Risk factors via First Street. Map © Google.
Why this score? — see what drove the B grade
The composite is a weighted blend of 9 inputs, each scored 0–100. Each bar is that input's sub-score; the figure is the points it added to the 100-point composite (weight × sub-score).
- Cash flow +30.0/30.0
- 1% rule +10.0/10.0
- DSCR +10.0/10.0
- ARV discount +7.5/15.0
- Rent growth +5.0/5.0
- Livability +3.9/5.0
- Condition / age +2.5/5.0
- Schools +1.9/10.0
- Appreciation +0.0/10.0
$99,850
🖨 Deal sheet 📄 Offer letter ✓ Due diligence
Multi-family units
County records classify this as Multi-Family (2-4 Unit). Listing-text estimate: 2 units. confirmed
Listing remarks
Rare vacant duplex opportunity in the path of Cumberland’s continued revitalization. 401-403 Ascension Street offers two 2-bedroom, 1-bath units with completely separate utilities, giving investors a clean slate to renovate, stabilize, and capture upside without working around existing tenants. Whether you are looking for a long-term rental, BRRRR project, house-hack, or value-add portfolio piece, this property checks the boxes: vacant possession, separate utility setup, two functional units, and strong income potential after improvement. Cumberland continues to attract attention for its affordability, historic character, outdoor recreation, and major downtown investment, including th
Key facts
- 3,446 sq ft lot
- Built 1920
- Listed 17 days
Property features AI
Finance
- Other: 841 sq ft total below grade (includes finished and unfinished area); 1,682 sq ft finished above grade (estimated); Below-grade finished and unfinished areas reported
- Financial info: Total of 2 units; Improvement assessed value reported; Land assessed value reported; Tax assessed value reported; Annual taxes reported
Exterior
- Parking: On-street parking
- Utilities: Natural gas hot water; Natural gas heating fuel; Public water; Public sewer
- Home design: Detached property; Ownership is fee simple; Estimated year built
- Construction: Frame construction; Other foundation
- Exterior features: Detached structure; Above grade and below grade additional structures; No tidal water
Interior
- Bedrooms: Two 2-bedroom units
- Heating & cooling: Forced air heating; Electric cooling
- Interior features: Estimated living area; Two total units in the building
Neighborhood map
What this means for you Summary
Snapshot
- This is a 2 × 2-bed/1-bath units multifamily listed at $100k.
Deal economics
- At list price, monthly cash flow is $1k ($13k/yr) — positive. Per door: $553/mo.
- The deal already cash-flows at list — no discount required.
- Meets the 1% rule at list price ($2k rent vs $100k).
- Recommended offer: $98k (1.5% below list) — sets the bar for market timing.
- Cap rate 19.6% vs local median 6.7% in Cumberland — top-decile yield for the area; either an underpriced asset or a hidden risk that comps aren't pricing in. Stress-test before assuming the spread holds.
Location & tenants
- Location reads 78/100 on livability (#64 in MD, #2,385 nationally) — a middle-class / working-renter tenant base. Strengths: amenities A+, commute A+, cost of living A+; Watch: schools D+, crime F, employment F.
- Allegany County Public Schools (other): math 15% / reading 30% proficiency, ranked #18 of 24 in MD (top 75%) — low school quality limits family demand, transient renter base, plan for 1-2y turnover.
- Market conditions: Rents rising fast (+10.9%/yr); 235 active listings in the ZIP; 5 comparable units currently listed for rent nearby; rentals lingering (median 44d on market — plan ~5-8 weeks vacancy on turnover, expect pricing pressure); 100% of comp listings sitting > 30 days — soft ceiling on asking rent; 24 units permitted in Allegany County in 2024 (0 in 5+ unit buildings).
- This rent runs 43% of the median local income ($61k/yr) — at the standard rent-burdened threshold; future hikes will face affordability resistance.
Forward outlook
- Local home prices are declining (-3.0%/yr); year-one equity from $690 of loan paydown is wiped out by about $3k of value loss. Plan a longer hold.
- Allegany County population projected at -14% by 2050 — secular population decline; favor cash flow + early exit over multi-decade hold.
- At projected returns (-3.0% appreciation + 8.0% rent growth), your $28k cash investment doubles in ~3 years — after that, you're playing with house money.
Negotiation context
- It's been on market 18 days — a 2% lower offer ($98k) is reasonable based on typical stale-listing flexibility.
- 11 sale attempts since 19y ago; this cycle's ask is 100% above the opening price — seller raised mid-cycle; expect resistance to lowballs.
Risks & watch-outs
- Watch-outs: built in 1920 — expect roof / HVAC / electrical / plumbing capex.
- Climate carrying-cost: extreme-heat days projected 7→17/yr by 2055 (HVAC capex compounding) — expect insurance premiums to compound above CPI over the hold.
Questions for the listing agent
- Can we see the unit-by-unit rent roll, current vacancy, and any below-market leases? What's the average tenancy length?
- What capital expenditures (roof, boiler, parking lot, exteriors) have been made in the last 5 years, and what's planned in the next 2?
- Built in 1920 — when were the roof, HVAC, electrical panel, plumbing, and water heater last replaced?
- Is there a deadline driving the sale (1031 exchange, divorce, estate, relocation)? That informs how much negotiation room exists.
- Schools are D-rated, which usually means shorter tenancies and higher turnover. Who's the typical renter profile here, and what's been the actual vacancy rate?
- Crime grade is F in this area — have there been break-ins, vandalism, or insurance claims at this property in the last 3 years? What carrier currently insures it and at what premium?
- What's the average days-on-market for RENTAL listings here right now (not sales)? A rising rental-DOM trend means longer vacancies and softer asking-rent achievability than the comps imply.
- What's the recent tenant-quality profile in this submarket — average credit score on applications, eviction rate, late-payment / NSF rate, and stable-employment percentage? A property-management company in the area should have these aggregated.
- How much new apartment / multifamily construction is in the pipeline within 1–3 miles? Heavy new supply (>2% of stock underway) typically softens rents 12–24 months out; light construction supports rent growth.
Investment metrics
- 1% rule
- 2.19% ✓
- Cap rate
- 19.60%
- Cash-on-cash
- 47.51%
- DSCR
- 3.11
- GRM
- 3.8
CMA / ARV
- ARV (on-the-fly)
- $29,148
- Comps found
- 2
Show comp detail 2 sales within ~0.75 mi
| Address | Dist | Beds/Ba | Sqft | Sold | Price | $/sf | Match |
|---|---|---|---|---|---|---|---|
| 405 and 407 Ascension St | 0.01mi | 4/— | 1,885 (-10%) | 5mo | $16,500 | $9 | 80 |
| 209-70 Blocker St | 0.74mi | 4/— | 2,276 (+9%) | 11mo | $32,000 | $14 | 41 |
Match score weights: distance 35% · size 25% · config 20% · recency 20%. Top-matched comps best support the ARV.
Projected returns pro-forma
-3.0% appreciation · 8.0% rent growth · sell at horizon
- IRR
- 50.3%
- Equity multiple
- 3.36×
- Total profit
- $65,847
- Equity at exit
- $14,888
- IRR
- 57.7%
- Equity multiple
- 8.17×
- Total profit
- $200,582
- Equity at exit
- $8,633
Cash invested: $27,958 (down + closing). Projections, not guarantees.
Landlord ↔ Tenant lean methodology
- Overall (STATE)
- 27 Tenant-Leaning
- State Maryland
- 27 Tenant-Leaning · D+14
- County
- — inherits STATE
- City
- — inherits STATE
ZIP-level market 21502
- Home prices YoY
- -17.4%
- Rents YoY
- 10.9%
- Active inventory
- 235
- Price-to-rent
- 7.6×
Monthly cashflow live
- Estimated rent
- $2,183 high interval (Pro) →
- Mortgage (P&I)
- −$524
- Tax from tax record
- −$52 /mo · $629/yr
- Insurance
- −$42
- HOA
- −$0
- Vacancy / Maint / Mgmt
- −$458
- Net cashflow
- $1,107
Break-even live
2-unit breakdown (identical units grouped — click to expand)
| Units | Beds | Baths | Est. rent |
|---|---|---|---|
| 2× units | 2 | 1 | $2,182 |
| #1 | 2 | 1 | $1,091 |
| #2 | 2 | 1 | $1,091 |
| Total (2 units) | $2,183 | ||
UW: 25.0% down · 7.5% · 30yr · 1.5% tax · 5.0% vac · 8.0% maint · 8.0% mgmt
Financing live
Cash to close
- Down payment
- $24,962
- Closing costs
- $2,996
- Reserves months
- —
- Total cash needed
- —
Loan-product check · same deal, 3 products live
Conventional
25% down · 7.5% · 30yr
- Down + closing
- —
- Monthly P&I
- —
- Monthly cashflow
- —
- DSCR
- —
- Eligible?
- —
Personal DTI + credit; lowest rate.
DSCR
20% down · 8.5% · 30yr
- Down + closing
- —
- Monthly P&I
- —
- Monthly cashflow
- —
- DSCR
- —
- Eligible?
- —
No personal income docs; deal must DSCR.
Hard money
10% down · 12.0% · 12mo
- Down + closing
- —
- Monthly P&I
- —
- Monthly cashflow
- —
- DSCR
- —
- Eligible?
- —
Short-term bridge; refi at stabilization.
Rent comps 5 comps
| Address | Beds | Baths | Sqft | Rent | $/sqft | DOM | Units | Dist |
|---|---|---|---|---|---|---|---|---|
| 630 Hill Top Dr Cumberland, MD | 5.0 | 1.5 | 2300 | $1,495 | $0.65 | 44d | 1 | 0.31mi |
| 131 Grand Ave Cumberland, MD | 3.0 | 2.0 | 1444 | $1,300 | $0.90 | 44d | 1 | 0.82mi |
| 516 Bedford St Cumberland, MD | 3.0 | 1.5 | 1500 | $1,195 | $0.80 | 44d | 1 | 0.92mi |
| 418 N Mechanic St Unit 1C Cumberland, MD | 3.0 | 1.0 | 1500 | $1,295 | $0.86 | 44d | 1 | 1.00mi |
| 423 Furnace St Cumberland, MD | 3.0 | 1.5 | 1440 | $1,250 | $0.87 | 44d | 1 | 1.19mi |
Listing history 50 events
-
2026-06-19days on market $99,850 Active 18 DOM
-
2026-06-18days on market $99,850 Active 17 DOM
-
2026-06-17days on market $99,850 Active 16 DOM
-
2026-06-16days on market $99,850 Active 15 DOM
-
2026-06-15days on market $99,850 Active 14 DOM
-
2026-06-14days on market $99,850 Active 12 DOM
-
2026-06-12days on market $99,850 Active 11 DOM
-
2026-06-09days on market $99,850 Active 8 DOM
-
2026-06-08days on market $99,850 Active 7 DOM
-
2026-06-07days on market $99,850 Active 6 DOM
-
2026-06-02statusdays on market $99,850 Active 1 DOM
-
2026-06-01days on market $99,850 Coming Soon 13 DOM
-
2026-05-31days on market $99,850 Coming Soon 12 DOM
-
2026-05-30days on market $99,850 Coming Soon 11 DOM
-
2026-05-20historical $99,850
-
2025-12-23historical
-
2025-12-11price $95,000
-
2025-09-10$50,000 Active
-
2025-08-21historical
-
2025-05-14price $122,500
-
2025-05-14status Active
-
2025-05-12historical
-
2025-04-22price $123,000
-
2024-12-31price $123,500
-
2024-11-30price $125,000
-
2024-11-08price $133,500
-
2024-10-20price $134,000
-
2024-09-13$135,000 Active
-
2024-08-26historical
-
2023-06-22soldstatus $92,500
-
2023-05-26soldstatus $92,500 Closed
-
2023-03-09status Pending
-
2023-01-26price $95,000
-
2022-09-28price $99,900
-
2022-07-14status Active
-
2022-07-07status Pending
-
2022-06-08$115,000 Active
-
2020-09-25historical
-
2019-10-17$75,000 Active
-
2014-08-01historical Expired
-
2014-08-01historical
-
2014-01-28Active
-
2014-01-28$99,999
-
2007-07-02soldstatus $35,000
-
2007-06-21historical
-
2007-06-20historical
-
2007-05-03
-
2007-03-12historical
-
2007-02-01$39,000
-
2007-02-01
ⓘ Source: listings_history table (triggers on properties + properties_extension) + one-shot
backfill from property_details.listing_events for pre-trigger history.
Tax reassessment forecast MD · Partial reset (capped growth)
- Current annual tax
- $629 · $52/mo
- Projected year-2 tax
- $859 · $72/mo
- Expected delta
- +$230/yr (+$19/mo · 36.6%)
ⓘ Screening estimate from a state-policy table — verify with the county assessor before closing.
Climate risk First Street
- Flood 1/10 Low FEMA zone X (unshaded) · 0% chance over 30 yrs
- Wildfire 4/10 Moderate
- Heat 5/10 Major 7 d/yr ≥101°F today · 17 d/yr by 30 yrs out
- Wind 2/10 Low
- Air quality 2/10 Low 0 unhealthy d/yr today · 1 by 30 yrs out
Nearby sold comps map
Loading sold comps map…
Walkable amenities ~0.75 mi
Loading nearby amenities…
Taxation est. · year 1
- Rental income
- $26,196
- − Mortgage interest
- −$5,593
- − Property taxes
- −$629
- − Insurance
- −$499
- − Repairs & maintenance
- −$2,096
- − Management
- −$2,096
- − Depreciation
- −$2,905
- Taxable income
- $12,379
- Est. tax owed @ 24.0%
- −$2,971
- After-tax cash flow
- $10,312/yr
For passive investors: Depreciation is non-cash, so a rental often shows a tax loss while cash-flowing — sheltering income. Rental losses are passive: they offset passive income freely, and up to $25,000/yr can offset ordinary (W-2) income if you actively participate and your MAGI is under $100k (phasing out to $0 by $150k); unused losses carry forward. On sale, claimed depreciation is recaptured at up to 25%, and gains may owe capital-gains tax (a 1031 exchange can defer both). Figures are a year-1 estimate at your 24.0% rate — not tax advice; consult a CPA.
Schools (NCES district)
- District
- Allegany County Public Schools
- NCES district ID
- 2400030
- Math proficiency
- 15% ▼ -26.00%
- Reading proficiency
- 30% ▼ -20.00%
- Median HH income
- $39,760
- Composite
- 18.95/100
- National rank
- #8854
- State rank
- #18 of 24 in MD
Livability — Cumberland
- Score
- 78/100
- State rank
- #64
- US rank
- #2385
Category grades
Schools grade is shown separately in the Schools card above.
Census & demographics
- Census place
- Cumberland, MD
- County
- Allegany County · 41,015 people
- City population
- 41,015
- Metro
- Cumberland, MD-WV
- Population (ZIP)
- 41,015
- Household income
- $60,725
- Rent vs Own
- Severe rent burden
- 824.0
Population outlook (Allegany County) Hauer SSP2
- Today (2025)
- 68,778 people
- By 2030
- 66,766 · -2.9%
- By 2040
- 62,784 · -8.7%
- By 2050
- 59,179 · -14.0%
- By 2075
- 50,732 · -26.2%
- By 2100
- 40,837 · -40.6%
Race, ethnicity, and origin ACS 2023
- Neighborhood character
- Predominantly White (83%)
- Race & ethnicity
- White 83% Black 9% Two or more races 5% Hispanic / Latino 2%
- Common ancestry
- Slovak 3% Romanian 2% Italian 1%
- Foreign-born
- 2% · Canada
- Languages at home
- 96% English-only · Spanish 2%
Political lean MEDSL · Allegany
- 2024 margin
- Solid R (+40.3) · D 28.9% · R 69.2% · Other 2.0%
- 2008→2024 swing
- -14.4pp toward R · 2008: -25.9pp · 2024: -40.3pp
- All cycles
- 2024: R+40.3 2020: R+38.3 2016: R+48.0 2012: R+32.9 2008: R+25.9
Not yet ingested
- Civics
- —
Market trends
- HPI YoY
- ▼ -54.33%
- Current HPI
- 258.6676
- Rent YoY
- ▲ 10.88%
- Metro
- Cumberland, MD-WV
- State GDP YoY
- ▲ 2.97%
- F500 in state
- 12
Industry mix (Fortune 500 HQ in MD)
| Industry | F500 HQs | Revenue |
|---|---|---|
| Aerospace / Defense | 1 | $71B |
|
||
| Utilities | 1 | $25B |
|
||
| Hotels | 1 | $24B |
|
||
| Consumer Goods | 1 | $7B |
|
||
| Real Estate | 1 | $6B |
|
||
| Chemicals | 1 | $2B |
|
||
Price history
+487.4% since first listed38 events — show timeline
- 2026-05-20 Coming Soon $99,850 BRIGHT MLS
- 2025-12-23 Listing Removed — BRIGHT MLS
- 2025-12-11 Price Changed $95,000 BRIGHT MLS
- 2025-09-10 Listed $50,000 BRIGHT MLS
- 2025-08-21 Listing Removed — BRIGHT MLS
- 2025-05-14 Price Changed $122,500 BRIGHT MLS
- 2025-05-14 Relisted — BRIGHT MLS
- 2025-05-12 Listing Removed — BRIGHT MLS
- 2025-04-22 Price Changed $123,000 BRIGHT MLS
- 2024-12-31 Price Changed $123,500 BRIGHT MLS
- 2024-11-30 Price Changed $125,000 BRIGHT MLS
- 2024-11-08 Price Changed $133,500 BRIGHT MLS
- 2024-10-20 Price Changed $134,000 BRIGHT MLS
- 2024-09-13 Listed $135,000 BRIGHT MLS
- 2024-08-26 Coming Soon — BRIGHT MLS
- 2023-06-22 Sold (Public Records) $92,500 Public Records
- 2023-05-26 Sold (MLS) $92,500 BRIGHT MLS
- 2023-03-09 Pending — BRIGHT MLS
- 2023-01-26 Price Changed $95,000 BRIGHT MLS
- 2022-09-28 Price Changed $99,900 BRIGHT MLS
- 2022-07-14 Relisted — BRIGHT MLS
- 2022-07-07 Pending — BRIGHT MLS
- 2022-06-08 Listed $115,000 BRIGHT MLS
- 2020-09-25 Listing Removed — BRIGHT MLS
- 2019-10-17 Listed $75,000 BRIGHT MLS
- 2014-08-01 Delisted — MRIS
- 2014-08-01 Listing Removed — BRIGHT MLS
- 2014-01-28 Listed — MRIS
- 2014-01-28 Listed $99,999 BRIGHT MLS
- 2007-07-02 Sold (MLS) $35,000 MRIS
- 2007-06-21 Delisted — MRIS
- 2007-06-20 Delisted — MRIS
- 2007-05-03 Listed — MRIS
- 2007-03-12 Delisted — MRIS
- 2007-02-01 Listed — MRIS
- 2007-02-01 Listed $39,000 MRIS
- 1996-11-25 Sold (Public Records) $25,000 Public Records
- 1990-06-05 Sold (Public Records) $17,000 Public Records
Property tax history
+4.8%/yrLatest (2025): $629 · +20.1% YoY. Source: county tax records.
Cash-flow waterfall
monthlySold comps — $/sqft
last 12 mo · ≤1 miLoading sold comps…