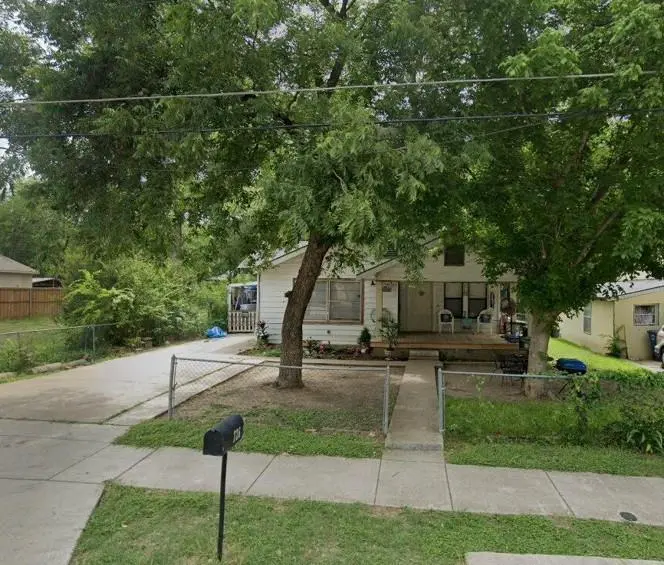
726 Helena St · Dallas, TX
Flood risk 1/10 · Minimal
- FEMA flood zone
- X (unshaded)
- Chance of flooding over 30 yrs
- 0.0%
- Est. flood insurance / yr
- $507 – $1,088
Fire risk 3/10 · Minor
- Est. fire insurance / yr
- $1,222 – $2,270
Heat risk 7/10 · Major
- Hot days now (above 110°F)
- 7 days/yr
- Hot days in 30 yrs
- 25 days/yr
Wind risk 6/10 · Moderate
- Chance of severe wind over 30 yrs
- 27.0%
Air-quality risk 2/10 · Minimal
- Unhealthy air days now
- 1 days/yr
- Unhealthy air days in 30 yrs
- 2 days/yr
Risk factors via First Street. Map © Google.
Why this score? — see what drove the B+ grade
The composite is a weighted blend of 9 inputs, each scored 0–100. Each bar is that input's sub-score; the figure is the points it added to the 100-point composite (weight × sub-score).
- Cash flow +30.0/30.0
- ARV discount +15.0/15.0
- 1% rule +10.0/10.0
- DSCR +10.0/10.0
- Livability +4.0/5.0
- Rent growth +2.8/5.0
- Schools +2.8/10.0
- Condition / age +2.5/5.0
- Appreciation +0.0/10.0
$119,999
🖨 Deal sheet 📄 Offer letter ✓ Due diligence
Listing remarks
OPEN HOUSE ON 05-27 12:30PM. * THIS IS THE ONLY TIME TO VIEW * Great investment opportunity with tons of potential for the right buyer looking to renovate, flip, or add to their rental portfolio. This fixer-upper offers a spacious layout and endless possibilities to update and customize to fit your vision. Ideal for investors, flippers, or buyers seeking a property with income-producing potential. Conveniently located near schools, shopping, dining, and major highways, making it attractive for future tenants or resale opportunities. With some TLC and updates, this property could truly shine. Property is being sold as-is.
Key facts
- 7,057 sq ft lot
- Built 1955
- Listed 21 days
Property features AI
Finance
- Other: Listing status: Active; Possession at closing/funding; Listing agreement: Exclusive right to sell; Special listing conditions: Standard
- Financial info: Listing terms: Cash; Loan type: Treat As Clear; No second mortgage
- HOA & community: No association
Exterior
- Parking: Driveway
- Utilities: Utilities: Other; No municipal utility district
- Home design: Single family residence; Residential property; One story; Property is not attached; no accessory unit; Built in 1955
- Construction: Composition roof; Pillar/post/pier foundation
- Exterior features: Lot under 0.5 acre (approx. 0.162 acres); Subdivision: Home Gardens; Directions: GPS
Interior
- Kitchen: Microwave
- Bedrooms: 3 bedrooms (all on main level)
- Flooring: Wood flooring
- Bathrooms: 2 full bathrooms
- Heating & cooling: Central heating; Central air conditioning
- Interior features: Cable TV available; One living area; One dining area; Total room count: 4; One level
Neighborhood map
What this means for you Summary
Snapshot
- This is a 3-bed/2.0-bath single-family listed at $120k.
Deal economics
- At list price, monthly cash flow is $481 ($6k/yr) — positive.
- The deal already cash-flows at list — no discount required.
- Meets the 1% rule at list price ($2k rent vs $120k).
- Recommended offer: $118k (1.5% below list) — sets the bar for market timing.
- Cap rate 11.1% vs local median 2.3% in Dallas — top-decile yield for the area; either an underpriced asset or a hidden risk that comps aren't pricing in. Stress-test before assuming the spread holds.
Location & tenants
- Location reads 81/100 on livability (#24 in TX, #1,380 nationally) — a professional / high-income tenant draw. Strengths: amenities A+, commute A+, housing A+; Watch: crime F.
- Dallas ISD (urban): math 31% / reading 36% proficiency, ranked #559 of 826 in TX (top 68%) — families likely to look elsewhere, expect single-tenant / working-renter base with shorter leases; 83% free/reduced lunch — lower-income household profile, screen leases tightly.
- Zoned schools: Rufus C Burleson El (math 37% / reading 28%, grade F, #2,234 of 4,322 statewide, top 52%, 506 students, 98% FRL).
- Market conditions: Rents rising (+1.0%/yr); 198 active listings in the ZIP; 18 comparable units currently listed for rent nearby; rentals leasing fast (median 8d on market — plan ~1-2 weeks tenant-placement turnaround); 12,577 units permitted in Dallas County in 2024 (6,829 in 5+ unit buildings).
- This rent runs 42% of the median local income ($56k/yr) — at the standard rent-burdened threshold; future hikes will face affordability resistance.
Forward outlook
- Local home prices are declining (-3.0%/yr); year-one equity from $829 of loan paydown is wiped out by about $4k of value loss. Plan a longer hold.
- Dallas County population projected at +35% by 2050 — long-run rental-demand tailwind backs the buy-and-hold thesis.
- At projected returns (-3.0% appreciation + 1.0% rent growth), your $34k cash investment doubles in ~9 years — after that, you're playing with house money.
Negotiation context
- It's been on market 21 days — a 2% lower offer ($118k) is reasonable based on typical stale-listing flexibility.
Risks & watch-outs
- Watch-outs: property tax is 3.8% of price; built in 1955 — expect roof / HVAC / electrical / plumbing capex.
- Climate carrying-cost: major wind risk, 27% chance of damaging wind over 30y; extreme-heat days projected 7→25/yr by 2055 (HVAC capex compounding) — expect insurance premiums to compound above CPI over the hold.
Questions for the listing agent
- Built in 1955 — when were the roof, HVAC, electrical panel, plumbing, and water heater last replaced?
- Property tax is high relative to price — has the assessment been appealed recently, and will the sale trigger a re-assessment?
- Is there a deadline driving the sale (1031 exchange, divorce, estate, relocation)? That informs how much negotiation room exists.
- Crime grade is F in this area — have there been break-ins, vandalism, or insurance claims at this property in the last 3 years? What carrier currently insures it and at what premium?
- What's the average days-on-market for RENTAL listings here right now (not sales)? A rising rental-DOM trend means longer vacancies and softer asking-rent achievability than the comps imply.
- What's the recent tenant-quality profile in this submarket — average credit score on applications, eviction rate, late-payment / NSF rate, and stable-employment percentage? A property-management company in the area should have these aggregated.
- How much new for-sale + rental construction is in the pipeline within 1–3 miles? Heavy new supply typically softens prices + rents 12–24 months out; constrained supply supports both.
Investment metrics
- 1% rule
- 1.62% ✓
- Cap rate
- 11.11%
- Cash-on-cash
- 17.20%
- DSCR
- 1.77
- GRM
- 5.1
CMA / ARV
- ARV (on-the-fly)
- $236,802
- Comps found
- 12
Show comp detail 12 sales within ~0.75 mi
| Address | Dist | Beds/Ba | Sqft | Sold | Price | $/sf | Match |
|---|---|---|---|---|---|---|---|
| 6245 Fenway St | 0.28mi | 4/2.0 (+1) | 1,332 (+3%) | 1mo | $255,000 | $191 | 76 |
| 6119 Elam Rd | 0.39mi | 3/2.0 | 1,254 (-3%) | 2mo | $230,000 | $183 | 75 |
| 743 Ella Ave | 0.05mi | 3/2.0 | 1,480 (+14%) | 1mo | $305,500 | $206 | 73 |
| 766 Bethpage Ave | 0.28mi | 3/1.0 | 1,250 (-3%) | 7mo | $165,000 | $132 | 71 |
| 6107 Elam Rd | 0.39mi | 3/2.0 | 1,254 (-3%) | 10mo | $215,000 | $171 | 68 |
| 638 Bethpage Ave | 0.30mi | 3/2.0 | 1,418 (+10%) | 5mo | $115,000 | $81 | 66 |
| 559 Helena St | 0.25mi | 3/2.0 | 1,178 (-9%) | 12mo | $257,500 | $219 | 64 |
| 6257 Fenway St | 0.29mi | 3/2.0 | 1,428 (+10%) | 8mo | $189,000 | $132 | 63 |
| 706 Elkhart Ave | 0.12mi | 3/2.0 | 1,461 (+13%) | 12mo | $299,900 | $205 | 62 |
| 548 Ezekial Ave | 0.42mi | 3/2.0 | 1,222 (-6%) | 12mo | $151,000 | $124 | 61 |
| 6520 Godfrey Ave | 0.44mi | 3/2.0 | 1,127 (-13%) | 9mo | $219,999 | $195 | 50 |
| 6340 Bellbrook Dr | 0.69mi | 3/1.0 | 1,144 (-12%) | 12mo | $99,900 | $87 | 34 |
Match score weights: distance 35% · size 25% · config 20% · recency 20%. Top-matched comps best support the ARV.
Projected returns pro-forma
-3.0% appreciation · 1.02% rent growth · sell at horizon
- IRR
- 6.0%
- Equity multiple
- 1.23×
- Total profit
- $7,588
- Equity at exit
- $17,892
- IRR
- 13.2%
- Equity multiple
- 1.95×
- Total profit
- $31,787
- Equity at exit
- $10,375
Cash invested: $33,600 (down + closing). Projections, not guarantees.
Landlord ↔ Tenant lean methodology
- Overall (STATE)
- 87 Strongly Landlord-Friendly
- State Texas
- 87 Strongly Landlord-Friendly · R+5
- County
- — inherits STATE
- City
- — inherits STATE
ZIP-level market 75217
- Home prices YoY
- -4.3%
- Rents YoY
- 1.0%
- Active inventory
- 198
- Price-to-rent
- 5.1×
Monthly cashflow live
- Estimated rent
- $1,946 high interval (Pro) →
- Mortgage (P&I)
- −$629
- Tax from tax record
- −$376 /mo · $4,518/yr
- Insurance
- −$50
- HOA
- −$0
- Vacancy / Maint / Mgmt
- −$409
- Net cashflow
- $481
Break-even live
UW: 25.0% down · 7.5% · 30yr · 1.5% tax · 5.0% vac · 8.0% maint · 8.0% mgmt
Financing live
Cash to close
- Down payment
- $30,000
- Closing costs
- $3,600
- Reserves months
- —
- Total cash needed
- —
Loan-product check · same deal, 3 products live
Conventional
25% down · 7.5% · 30yr
- Down + closing
- —
- Monthly P&I
- —
- Monthly cashflow
- —
- DSCR
- —
- Eligible?
- —
Personal DTI + credit; lowest rate.
DSCR
20% down · 8.5% · 30yr
- Down + closing
- —
- Monthly P&I
- —
- Monthly cashflow
- —
- DSCR
- —
- Eligible?
- —
No personal income docs; deal must DSCR.
Hard money
10% down · 12.0% · 12mo
- Down + closing
- —
- Monthly P&I
- —
- Monthly cashflow
- —
- DSCR
- —
- Eligible?
- —
Short-term bridge; refi at stabilization.
Rent comps 18 comps
| Address | Beds | Baths | Sqft | Rent | $/sqft | DOM | Units | Dist |
|---|---|---|---|---|---|---|---|---|
| 758 Bethpage Ave Dallas, TX | 4.0 | 2.0 | 1484 | $1,975 | $1.33 | 7d | 1 | 0.28mi |
| 6307 Elam Rd Dallas, TX | 4.0 | 2.0 | 1844 | $2,000 | $1.08 | 43d | 1 | 0.37mi |
| 332 Ezekial Ave Dallas, TX | 3.0 | 2.5 | 1347 | $1,838 | $1.36 | 1d | 1 | 0.60mi |
| 328 Ezekial Ave Dallas, TX | 3.0 | 2.5 | 1347 | $2,098 | $1.56 | 6d | 1 | 0.61mi |
| 216 Creek Cove Dr Dallas, TX | 3.0 | 2.5 | 1501 | $2,000 | $1.33 | 4d | 1 | 0.74mi |
| 146 Creek Cove Dr Dallas, TX | 3.0 | 2.5 | 1347 | $1,773 | $1.32 | 43d | 1 | 0.78mi |
| 220 Stoneport Dr Dallas, TX | 2.0–4.0 | 2.0 | 1062 | $1,518 | $1.43 | 5d | 13 | 0.79mi |
| 130 Creek Cove Dr Dallas, TX | 3.0 | 2.5 | 1347 | $1,873 | $1.39 | 24d | 1 | 0.79mi |
| 445 Bolero Ave Dallas, TX | 3.0 | 2.0 | 1200 | $1,900 | $1.58 | 7d | 1 | 0.81mi |
| 1244 Lonsdale Ave Dallas, TX | 3.0 | 2.5 | 1501 | $2,120 | $1.41 | 20d | 1 | 0.84mi |
| 1246 Lonsdale Ave Dallas, TX | 3.0 | 2.5 | 1501 | $2,050 | $1.37 | 20d | 1 | 0.84mi |
| 6811 Marla Dr Dallas, TX | 3.0 | 2.0 | 1070 | $1,850 | $1.73 | 1d | 1 | 0.94mi |
| 7250 Elam Rd Dallas, TX | 1.0–3.0 | 1.0–2.0 | 724 | $1,612 | $2.23 | 2d | 9 | 1.00mi |
| 1355 N Jim Miller Rd Unit 23 Dallas, TX | 2.0 | 1.5 | 953 | $1,100 | $1.15 | 2d | 1 | 1.07mi |
| 1355 N Jim Miller Rd Unit 121 Dallas, TX | 3.0 | 1.5 | 1169 | $1,250 | $1.07 | 2d | 1 | 1.07mi |
| 119 Palm Oak Dr Dallas, TX | 3.0 | 1.5 | 1401 | $2,000 | $1.43 | 6d | 1 | 1.11mi |
| 121 N Jim Miller Rd Unit 121 Dallas, TX | 3.0 | 2.0 | 1169 | $1,175 | $1.01 | 7d | 1 | 1.13mi |
| 1315 Whitley Dr Unit 1 Dallas, TX | 2.0 | 1.0 | 1050 | $1,600 | $1.52 | 43d | 1 | 1.49mi |
Listing history 12 events
-
2026-06-15status $119,999 Pending 21 DOM
-
2026-06-15days on market $119,999 Active 21 DOM
-
2026-06-13days on market $119,999 Active 19 DOM
-
2026-06-09days on market $119,999 Active 15 DOM
-
2026-06-08days on market $119,999 Active 14 DOM
-
2026-06-07days on market $119,999 Active 13 DOM
-
2026-06-04days on market $119,999 Active 10 DOM
-
2026-06-03days on market $119,999 Active 9 DOM
-
2026-06-02days on market $119,999 Active 8 DOM
-
2026-06-01days on market $119,999 Active 7 DOM
-
2026-05-31days on market $119,999 Active 6 DOM
-
2026-05-25$119,999 Active
ⓘ Source: listings_history table (triggers on properties + properties_extension) + one-shot
backfill from property_details.listing_events for pre-trigger history.
Tax reassessment forecast TX · Resets to sale price
- Current annual tax
- $4,518 · $376/mo
- Projected year-2 tax
- $4,518 · $376/mo
- Expected delta
- $0/yr ($0/mo · 0.0%)
ⓘ Screening estimate from a state-policy table — verify with the county assessor before closing.
Climate risk First Street
- Flood 1/10 Low FEMA zone X (unshaded) · 0% chance over 30 yrs
- Wildfire 3/10 Moderate
- Heat 7/10 Severe 7 d/yr ≥110°F today · 25 d/yr by 30 yrs out
- Wind 6/10 Major 27% chance of damaging wind over 30 yrs
- Air quality 2/10 Low 1 unhealthy d/yr today · 2 by 30 yrs out
Nearby sold comps map
Loading sold comps map…
Walkable amenities ~0.75 mi
Loading nearby amenities…
Taxation est. · year 1
- Rental income
- $23,351
- − Mortgage interest
- −$6,722
- − Property taxes
- −$4,518
- − Insurance
- −$600
- − Repairs & maintenance
- −$1,868
- − Management
- −$1,868
- − Depreciation
- −$3,491
- Taxable income
- $4,284
- Est. tax owed @ 24.0%
- −$1,028
- After-tax cash flow
- $4,750/yr
For passive investors: Depreciation is non-cash, so a rental often shows a tax loss while cash-flowing — sheltering income. Rental losses are passive: they offset passive income freely, and up to $25,000/yr can offset ordinary (W-2) income if you actively participate and your MAGI is under $100k (phasing out to $0 by $150k); unused losses carry forward. On sale, claimed depreciation is recaptured at up to 25%, and gains may owe capital-gains tax (a 1031 exchange can defer both). Figures are a year-1 estimate at your 24.0% rate — not tax advice; consult a CPA.
Schools (NCES district)
- District
- Dallas ISD
- NCES district ID
- 4816230
- Math proficiency
- 31% ▼ -16.00%
- Reading proficiency
- 36% ▼ -4.00%
- Median HH income
- $42,881
- Composite
- 28.41/100
- National rank
- #6763
- State rank
- #559 of 826 in TX
Livability — Dallas
- Score
- 81/100
- State rank
- #24
- US rank
- #1380
Category grades
Schools grade is shown separately in the Schools card above.
Census & demographics
- Census place
- Dallas, TX
- County
- Dallas County · 2,612,404 people
- City population
- 1,168,437
- Metro
- Dallas-Fort Worth-Arlington, TX
- Population (ZIP)
- 85,028
- Household income
- $55,723
- Rent vs Own
- Severe rent burden
- 2649.0
Population outlook (Dallas County) Hauer SSP2
- Today (2025)
- 2,979,839 people
- By 2030
- 3,191,823 · +7.1%
- By 2040
- 3,619,611 · +21.5%
- By 2050
- 4,026,915 · +35.1%
- By 2075
- 4,957,073 · +66.4%
- By 2100
- 5,508,725 · +84.9%
Race, ethnicity, and origin ACS 2023
- Neighborhood character
- Predominantly Hispanic (73%)
- Race & ethnicity
- Hispanic / Latino 73% Two or more races 34% Black 20% White 6%
- Hispanic origin (detail)
- Mexican 68%
- Foreign-born
- 30% · Canada, Philippines
- Languages at home
- 34% English-only · Spanish 65% Other Asian/Pacific 1%
Political lean MEDSL · Dallas
- 2024 margin
- Strong D (+22.2) · D 60.2% · R 38.0% · Other 1.8%
- 2008→2024 swing
- +6.9pp toward D · 2008: 15.3pp · 2024: 22.2pp
- All cycles
- 2024: D+22.2 2020: D+31.6 2016: D+26.2 2012: D+15.4 2008: D+15.3
Not yet ingested
- Civics
- —
Market trends
- HPI YoY
- ▼ -17.04%
- Current HPI
- 382.5527
- Rent YoY
- ▲ 1.02%
- Metro
- Dallas-Fort Worth-Arlington, TX
- State GDP YoY
- ▲ 3.95%
- F500 in state
- 110
Industry mix (Fortune 500 HQ in TX)
| Industry | F500 HQs | Revenue |
|---|---|---|
| Energy | 16 | $1,198B |
|
||
| Technology | 5 | $198B |
|
||
| Engineering / Construction | 4 | $72B |
|
||
| Energy Services | 3 | $60B |
|
||
| Utilities | 3 | $41B |
|
||
| Healthcare | 2 | $330B |
|
||
Price history
1 event — show timeline
- 2026-05-25 Listed $119,999 NTREIS
Property tax history
+9.7%/yrLatest (2025): $4,518 · -0.4% YoY. Source: county tax records.
Cash-flow waterfall
monthlySold comps — $/sqft
last 12 mo · ≤1 miLoading sold comps…