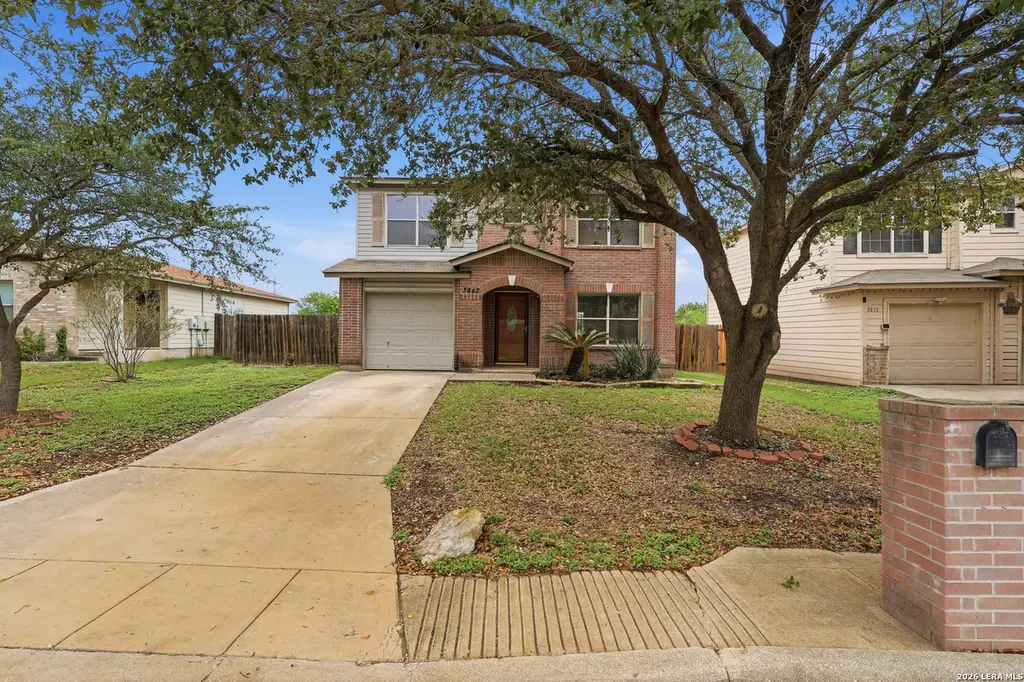
3842 Candleglenn · San Antonio, TX
Flood risk 1/10 · Minimal
- FEMA flood zone
- X (unshaded)
- Chance of flooding over 30 yrs
- 0.0%
- Est. flood insurance / yr
- $507 – $1,088
Fire risk 4/10 · Minor
- Est. fire insurance / yr
- $1,222 – $2,270
Heat risk 8/10 · Major
- Hot days now (above 108°F)
- 7 days/yr
- Hot days in 30 yrs
- 22 days/yr
Wind risk 8/10 · Major
- Chance of severe wind over 30 yrs
- 80.0%
Air-quality risk 2/10 · Minimal
- Unhealthy air days now
- 0 days/yr
- Unhealthy air days in 30 yrs
- 1 days/yr
Risk factors via First Street. Map © Google.
Why this score? — see what drove the C- grade
The composite is a weighted blend of 9 inputs, each scored 0–100. Each bar is that input's sub-score; the figure is the points it added to the 100-point composite (weight × sub-score).
- Cash flow +15.1/30.0
- ARV discount +15.0/15.0
- 1% rule +5.4/10.0
- DSCR +4.6/10.0
- Livability +4.0/5.0
- Rent growth +2.7/5.0
- Condition / age +2.5/5.0
- Schools +2.4/10.0
- Appreciation +0.0/10.0
$155,000
🖨 Deal sheet 📄 Offer letter ✓ Due diligence
Listing remarks
Fixer-upper with several options: GREAT opportunity to utilize a FHA, VA, or Conventional RENOVATION LOAN. OR, buy at below market value and renovate over time at your own pace. OR purchase, renovate, and rent for long-term equity growth. This one will be sold AS-IS and the seller will entertain reasonable offers.
Key facts
- 8,668 sq ft lot
- Garage
- Built 2003
Property features AI
Finance
- HOA & community: Located in the Candlewood Park subdivision
Exterior
- Parking: 1-car garage
- Utilities: City water and sewer
- Home design: Pre-owned single-family home; Built by KB (approx. 23 years old)
- Construction: Brick and cement fiber exterior; Composition roof; Slab foundation
- Exterior features: Privacy fence; Level lot; Street paved with sidewalks and streetlights; City street
Interior
- Kitchen: Kitchen (approx. 11 x 8); Stove/Range; Refrigerator; Dishwasher; Disposal; Ice maker connection
- Bedrooms: Master bedroom on upper level with ceiling fan and full bath (approx. 11 x 20); Second bedroom (approx. 10 x 11); Third bedroom (approx. 18 x 13)
- Flooring: Carpeting; Linoleum flooring; Laminate flooring
- Bathrooms: 2 full bathrooms; 1 half bathroom; Master bath with separate tub and shower and single vanity (approx. 7 x 6)
- Heating & cooling: Central heating (electric); Central air conditioning
- Interior features: Ceiling fans throughout; 1 living area; Utility room inside; All bedrooms located on the upper level; Cable TV available; All window coverings remain
- Laundry & utility: Washer and dryer included; Washer and dryer connections; Utility room (approx. 6 x 5); Electric water heater
Neighborhood map
What this means for you Summary
Snapshot
- This is a 3-bed/2.5-bath single-family listed at $155k.
Deal economics
- At list price, monthly cash flow is $51 ($615/yr) — positive.
- The deal already cash-flows at list — no discount required.
- Meets the 1% rule at list price ($2k rent vs $155k).
- Cap rate 6.7% vs local median 3.8% in San Antonio — top-decile yield for the area; either an underpriced asset or a hidden risk that comps aren't pricing in. Stress-test before assuming the spread holds.
Location & tenants
- Location reads 80/100 on livability (#31 in TX, #1,616 nationally) — a professional / high-income tenant draw. Strengths: amenities A+, commute A+, cost of living A+; Watch: crime F.
- Judson ISD (suburban): math 21% / reading 33% proficiency, ranked #660 of 826 in TX (top 80%) — low school quality limits family demand, transient renter base, plan for 1-2y turnover.
- Zoned schools: Candlewood El (math 12% / reading 22%, grade F, #3,836 of 4,322 statewide, top 91%, 519 students, 90% FRL); Karen Wagner H S (math 12% / reading 29%, grade F, #1,389 of 1,632 statewide, top 86%, 2,366 students, 80% FRL) — zoned schools average 85% FRL vs 57% district-wide (28 pts higher); higher-poverty schools than district average — tighter screening recommended.
- Market conditions: Rents flat; 187 active listings in the ZIP; 40 comparable units currently listed for rent nearby; rentals at typical pace (median 24d on market — plan ~3-4 weeks tenant-placement turnaround); 8,308 units permitted in Bexar County in 2024 (2,506 in 5+ unit buildings).
Forward outlook
- Local home prices are declining (-3.0%/yr); year-one equity from $1k of loan paydown is wiped out by about $5k of value loss. Plan a longer hold.
- Bexar County population projected at +50% by 2050 — long-run rental-demand tailwind backs the buy-and-hold thesis.
Negotiation context
- Only 12 days on market — expect competitive offers; lowballing is unlikely to land.
- 5 sale attempts since 6y ago with the ask held roughly flat each time — persistent listings suggest the price (not the market) is what's stuck; bring a comps-based counter.
Risks & watch-outs
- Watch-outs: property tax is 2.6% of price.
- Climate carrying-cost: severe wind risk, 80% chance of damaging wind over 30y; extreme-heat days projected 7→22/yr by 2055 (HVAC capex compounding) — expect insurance premiums to compound above CPI over the hold.
Questions for the listing agent
- Property tax is high relative to price — has the assessment been appealed recently, and will the sale trigger a re-assessment?
- Is there a deadline driving the sale (1031 exchange, divorce, estate, relocation)? That informs how much negotiation room exists.
- Crime grade is F in this area — have there been break-ins, vandalism, or insurance claims at this property in the last 3 years? What carrier currently insures it and at what premium?
- What's the average days-on-market for RENTAL listings here right now (not sales)? A rising rental-DOM trend means longer vacancies and softer asking-rent achievability than the comps imply.
- What's the recent tenant-quality profile in this submarket — average credit score on applications, eviction rate, late-payment / NSF rate, and stable-employment percentage? A property-management company in the area should have these aggregated.
- How much new for-sale + rental construction is in the pipeline within 1–3 miles? Heavy new supply typically softens prices + rents 12–24 months out; constrained supply supports both.
Investment metrics
- 1% rule
- 1.04% ✓
- Cap rate
- 6.69%
- Cash-on-cash
- 1.42%
- DSCR
- 1.06
- GRM
- 8.0
CMA / ARV
- ARV (median comp)
- $186,001
- List price
- $155,000
- Delta
- -16.67%
- Verdict
- UNDERPRICED
- Comps
- 20 within 1.0 mi
Show comp detail 12 sales within ~0.75 mi
| Address | Dist | Beds/Ba | Sqft | Sold | Price | $/sf | Match |
|---|---|---|---|---|---|---|---|
| 3842 Candleglenn | 0.00mi | 3/2.5 | 1,501 (0%) | 0mo | $155,000 | $103 | 100 |
| 3717 Candlecreek Ct | 0.13mi | 3/2.5 | 1,501 (0%) | 0mo | $199,999 | $133 | 94 |
| 6143 Lyndell Spgs | 0.24mi | 3/2.5 | 1,501 (0%) | 1mo | $208,000 | $139 | 88 |
| 6002 Glacier Sun | 0.09mi | 3/2.0 | 1,344 (-10%) | 1mo | $165,000 | $123 | 76 |
| 4141 Sunrise Cove Dr | 0.51mi | 3/2.5 | 1,478 (-2%) | 3mo | $125,000 | $85 | 72 |
| 6011 Meadow Sunrise Dr | 0.60mi | 3/2.0 | 1,521 (+1%) | 1mo | $150,000 | $99 | 67 |
| 6518 Candleview | 0.38mi | 3/2.0 | 1,630 (+9%) | 1mo | $179,000 | $110 | 65 |
| 2915 Candleside | 0.31mi | 3/2.5 | 1,716 (+14%) | 2mo | $190,000 | $111 | 60 |
| 6508 Buffalo Rnch | 0.66mi | 3/2.0 | 1,360 (-9%) | 1mo | $140,000 | $103 | 51 |
| 3019 Pacific Coast | 0.75mi | 3/2.0 | 1,654 (+10%) | 1mo | $245,000 | $148 | 46 |
| 6617 Richland Pl | 0.72mi | 3/2.0 | 1,653 (+10%) | 2mo | $232,500 | $141 | 46 |
| 5807 Summer Fest | 0.72mi | 4/2.0 (+1) | 1,352 (-10%) | 2mo | $180,000 | $133 | 41 |
Match score weights: distance 35% · size 25% · config 20% · recency 20%. Top-matched comps best support the ARV.
Projected returns pro-forma
-3.0% appreciation · 0.75% rent growth · sell at horizon
- IRR
- -16.9%
- Equity multiple
- 0.42×
- Total profit
- $-25,297
- Equity at exit
- $23,111
- IRR
- -14.1%
- Equity multiple
- 0.28×
- Total profit
- $-31,315
- Equity at exit
- $13,402
Cash invested: $43,400 (down + closing). Projections, not guarantees.
Landlord ↔ Tenant lean methodology
- Overall (STATE)
- 87 Strongly Landlord-Friendly
- State Texas
- 87 Strongly Landlord-Friendly · R+5
- County
- — inherits STATE
- City
- — inherits STATE
ZIP-level market 78244
- Home prices YoY
- -4.4%
- Rents YoY
- 0.8%
- Active inventory
- 187
- Price-to-rent
- 8.0×
Monthly cashflow live
- Estimated rent
- $1,606 high interval (Pro) →
- Mortgage (P&I)
- −$813
- Tax from tax record
- −$340 /mo · $4,085/yr
- Insurance
- −$65
- HOA
- −$0
- Vacancy / Maint / Mgmt
- −$337
- Net cashflow
- $51
Break-even live
UW: 25.0% down · 7.5% · 30yr · 1.5% tax · 5.0% vac · 8.0% maint · 8.0% mgmt
Financing live
Cash to close
- Down payment
- $38,750
- Closing costs
- $4,650
- Reserves months
- —
- Total cash needed
- —
Loan-product check · same deal, 3 products live
Conventional
25% down · 7.5% · 30yr
- Down + closing
- —
- Monthly P&I
- —
- Monthly cashflow
- —
- DSCR
- —
- Eligible?
- —
Personal DTI + credit; lowest rate.
DSCR
20% down · 8.5% · 30yr
- Down + closing
- —
- Monthly P&I
- —
- Monthly cashflow
- —
- DSCR
- —
- Eligible?
- —
No personal income docs; deal must DSCR.
Hard money
10% down · 12.0% · 12mo
- Down + closing
- —
- Monthly P&I
- —
- Monthly cashflow
- —
- DSCR
- —
- Eligible?
- —
Short-term bridge; refi at stabilization.
Rent comps 40 comps
| Address | Beds | Baths | Sqft | Rent | $/sqft | DOM | Units | Dist |
|---|---|---|---|---|---|---|---|---|
| 6254 Eddie Way San Antonio, TX | 3.0 | 2.5 | 1225 | $1,375 | $1.12 | 44d | 1 | 0.08mi |
| 6230 Eddie Way San Antonio, TX | 3.0 | 2.5 | 1225 | $1,350 | $1.10 | 24d | 1 | 0.13mi |
| 3713 Candlebluff Dr San Antonio, TX | 3.0 | 2.5 | 1501 | $2,100 | $1.40 | 15d | 1 | 0.13mi |
| 4001 Colonial Sun Dr San Antonio, TX | 3.0 | 2.0 | 1344 | $1,400 | $1.04 | 44d | 1 | 0.13mi |
| 6222 Eddie Way San Antonio, TX | 3.0 | 2.5 | 1225 | $1,350 | $1.10 | 24d | 1 | 0.15mi |
| 6222 Eddie Way Unit 2 San Antonio, TX | 3.0 | 2.5 | 1225 | $1,350 | $1.10 | 3d | 1 | 0.15mi |
| 6214 Eddie Way Unit 2 San Antonio, TX | 3.0 | 2.5 | 1225 | $1,600 | $1.31 | 22d | 1 | 0.17mi |
| 6214 Eddie Way San Antonio, TX | 3.0 | 2.5 | 1225 | $1,600 | $1.31 | 20d | 1 | 0.17mi |
| 3710 Candleglenn San Antonio, TX | 3.0 | 2.5 | 1582 | $1,650 | $1.04 | 3d | 1 | 0.17mi |
| 6210 Eddie Way Unit 1 San Antonio, TX | 3.0 | 2.5 | 1225 | $1,350 | $1.10 | 3d | 1 | 0.17mi |
| 6210 Eddie Way Unit 1 San Antonio, TX | 3.0 | 2.5 | 1225 | $1,350 | $1.10 | 44d | 1 | 0.17mi |
| 4014 Sunrise Creek Dr San Antonio, TX | 3.0 | 2.0 | 1100 | $1,600 | $1.45 | 44d | 1 | 0.18mi |
| 6206 Eddie Way Unit 2 San Antonio, TX | 3.0 | 2.5 | 1225 | $1,350 | $1.10 | 3d | 1 | 0.18mi |
| 6206 Eddie Way Unit 2 San Antonio, TX | 3.0 | 2.5 | 1225 | $1,350 | $1.10 | 24d | 1 | 0.18mi |
| 3633 Candlebrook Ln San Antonio, TX | 3.0 | 2.0 | 1621 | $1,495 | $0.92 | 24d | 1 | 0.21mi |
| 6523 Candlecrest Ct San Antonio, TX | 4.0 | 2.0 | 1905 | $1,930 | $1.01 | 44d | 1 | 0.23mi |
| 5840 Glacier Sun Dr San Antonio, TX | 3.0 | 2.0 | 1344 | $1,749 | $1.30 | 2d | 1 | 0.29mi |
| 3327 Candlemoon Dr San Antonio, TX | 3.0 | 2.0 | 1344 | $1,550 | $1.15 | 44d | 1 | 0.29mi |
| 4047 Indian Sunrise San Antonio, TX | 3.0 | 1.0 | 1089 | $1,150 | $1.06 | 44d | 1 | 0.31mi |
| 6402 Candlewick Ct San Antonio, TX | 4.0 | 2.5 | 2008 | $1,790 | $0.89 | 4d | 1 | 0.33mi |
| 6231 Post Ml San Antonio, TX | 3.0 | 2.0 | 1447 | $1,495 | $1.03 | 24d | 1 | 0.36mi |
| 6231 Post Ml San Antonio, TX | 3.0 | 2.0 | 1447 | $1,495 | $1.03 | 20d | 1 | 0.36mi |
| 2726 Candleridge Dr San Antonio, TX | 3.0 | 2.0 | 1430 | $1,349 | $0.94 | 24d | 1 | 0.36mi |
| 6402 Candleview Ct San Antonio, TX | 3.0 | 2.0 | 1319 | $1,499 | $1.14 | 4d | 1 | 0.37mi |
| 4111 Sunrise Terrace Dr San Antonio, TX | 4.0 | 2.0 | 1220 | $1,700 | $1.39 | 2d | 1 | 0.38mi |
| 4111 Sunrise Terrace Dr San Antonio, TX | 4.0 | 2.0 | 1220 | $1,800 | $1.48 | 44d | 1 | 0.38mi |
| 4078 Enchanted Sun San Antonio, TX | 3.0 | 1.0 | 1056 | $1,250 | $1.18 | 24d | 1 | 0.39mi |
| 6458 Candleview Ct San Antonio, TX | 4.0 | 2.5 | 2008 | $1,645 | $0.82 | 4d | 1 | 0.39mi |
| 4122 Alaskian Sunrise San Antonio, TX | 3.0 | 2.0 | 1454 | $1,495 | $1.03 | 44d | 1 | 0.40mi |
| 3643 Cameron Spgs San Antonio, TX | 3.0 | 1.5 | 1501 | $1,180 | $0.79 | 3d | 1 | 0.40mi |
| 3603 Aranda Flds Converse, TX | 3.0 | 2.0 | 1346 | $1,650 | $1.23 | 44d | 1 | 0.42mi |
| 3669 Candlehead Ln San Antonio, TX | 3.0 | 2.5 | 1294 | $1,700 | $1.31 | 44d | 1 | 0.44mi |
| 3511 Dunlap Flds Converse, TX | 3.0 | 2.0 | 1317 | $1,650 | $1.25 | 11d | 1 | 0.46mi |
| 4123 Frontier Sun San Antonio, TX | 3.0 | 2.0 | 1086 | $1,350 | $1.24 | 44d | 1 | 0.46mi |
| 4102 Dakota Sun San Antonio, TX | 3.0 | 1.0 | 1202 | $1,350 | $1.12 | 44d | 1 | 0.47mi |
| 3422 Dunlap Flds Converse, TX | 3.0 | 2.0 | 1450 | $1,540 | $1.06 | 20d | 1 | 0.49mi |
| 4082 Sunrise Pass San Antonio, TX | 3.0 | 1.0 | 1125 | $1,355 | $1.20 | 4d | 1 | 0.49mi |
| 2631 Green Leaf Way San Antonio, TX | 4.0 | 2.5 | 1918 | $1,689 | $0.88 | 24d | 1 | 0.50mi |
| 6114 Hackberry Pond San Antonio, TX | 3.0 | 2.5 | 2043 | $1,695 | $0.83 | 44d | 1 | 0.51mi |
| 4162 Frontier Sun San Antonio, TX | 3.0 | 2.5 | 1246 | $1,400 | $1.12 | 44d | 1 | 0.52mi |
Listing history 12 events
-
2026-05-12historical Active Option 315-char remark
-
2026-05-07$155,000 New 315-char remark
-
2025-05-05historical $1,300
-
2025-05-05$1,300
-
2025-05-05historical $1,300
-
2025-05-01$1,300
-
2022-02-07price $1,500
-
2020-08-07soldstatus
-
2020-08-06soldstatus Sold
-
2020-06-26status Pending
-
2020-06-19Active Option
-
2020-06-19$150,000
ⓘ Source: listings_history table (triggers on properties + properties_extension) + one-shot
backfill from property_details.listing_events for pre-trigger history.
Tax reassessment forecast TX · Resets to sale price
- Current annual tax
- $4,085 · $340/mo
- Projected year-2 tax
- $4,085 · $340/mo
- Expected delta
- $0/yr ($0/mo · -0.0%)
ⓘ Screening estimate from a state-policy table — verify with the county assessor before closing.
Climate risk First Street
- Flood 1/10 Low FEMA zone X (unshaded) · 0% chance over 30 yrs
- Wildfire 4/10 Moderate
- Heat 8/10 Severe 7 d/yr ≥108°F today · 22 d/yr by 30 yrs out
- Wind 8/10 Severe 80% chance of damaging wind over 30 yrs
- Air quality 2/10 Low 0 unhealthy d/yr today · 1 by 30 yrs out
Nearby sold comps map
Loading sold comps map…
Walkable amenities ~0.75 mi
Loading nearby amenities…
Taxation est. · year 1
- Rental income
- $19,277
- − Mortgage interest
- −$8,682
- − Property taxes
- −$4,085
- − Insurance
- −$775
- − Repairs & maintenance
- −$1,542
- − Management
- −$1,542
- − Depreciation
- −$4,509
- Taxable loss
- −$1,859
- Est. tax savings @ 24.0%
- +$446
- After-tax cash flow
- $1,061/yr
For passive investors: Depreciation is non-cash, so a rental often shows a tax loss while cash-flowing — sheltering income. Rental losses are passive: they offset passive income freely, and up to $25,000/yr can offset ordinary (W-2) income if you actively participate and your MAGI is under $100k (phasing out to $0 by $150k); unused losses carry forward. On sale, claimed depreciation is recaptured at up to 25%, and gains may owe capital-gains tax (a 1031 exchange can defer both). Figures are a year-1 estimate at your 24.0% rate — not tax advice; consult a CPA.
Schools (NCES district)
- District
- Judson ISD
- NCES district ID
- 4824990
- Math proficiency
- 21% ▼ -21.00%
- Reading proficiency
- 33% ▼ -7.00%
- Median HH income
- $57,542
- Composite
- 24.39/100
- National rank
- #7689
- State rank
- #660 of 826 in TX
Livability — San Antonio
- Score
- 80/100
- State rank
- #31
- US rank
- #1616
Category grades
Schools grade is shown separately in the Schools card above.
Census & demographics
- County
- Bexar County · 1,990,555 people
- City population
- 1,806,925
- Metro
- San Antonio-New Braunfels, TX
- Population (ZIP)
- 38,092
- Household income
- $71,128
- Rent vs Own
- Severe rent burden
- 677.0
Population outlook (Bexar County) Hauer SSP2
- Today (2025)
- 2,336,851 people
- By 2030
- 2,560,728 · +9.6%
- By 2040
- 3,020,569 · +29.3%
- By 2050
- 3,493,522 · +49.5%
- By 2075
- 4,668,459 · +99.8%
- By 2100
- 5,533,242 · +136.8%
Race, ethnicity, and origin ACS 2023
- Neighborhood character
- Diverse neighborhood (Simpson 0.68)
- Race & ethnicity
- Hispanic / Latino 46% Black 27% Two or more races 24% White 20% Asian 2%
- Hispanic origin (detail)
- Mexican 38% Puerto Rican 2% Cuban 2%
- Common ancestry
- Slovak 2% Lithuanian 1% Italian 1%
- Foreign-born
- 14% · Canada, Vietnam
- Languages at home
- 68% English-only · Spanish 28% Vietnamese 1% Tagalog/Filipino 1%
Political lean MEDSL · Bexar
- 2024 margin
- Lean D (+9.8) · D 54.3% · R 44.6% · Other 1.1%
- 2008→2024 swing
- +4.2pp toward D · 2008: 5.6pp · 2024: 9.8pp
- All cycles
- 2024: D+9.8 2020: D+18.2 2016: D+13.5 2012: D+4.6 2008: D+5.6
Not yet ingested
- Civics
- —
Market trends
- HPI YoY
- ▼ -11.42%
- Current HPI
- 249.3834
- Rent YoY
- ▲ 0.75%
- Metro
- San Antonio-New Braunfels, TX
- State GDP YoY
- ▲ 3.95%
- F500 in state
- 110
Industry mix (Fortune 500 HQ in TX)
| Industry | F500 HQs | Revenue |
|---|---|---|
| Energy | 16 | $1,198B |
|
||
| Technology | 5 | $198B |
|
||
| Engineering / Construction | 4 | $72B |
|
||
| Energy Services | 3 | $60B |
|
||
| Utilities | 3 | $41B |
|
||
| Healthcare | 2 | $330B |
|
||
Price history
+3.3% since first listed14 events — show timeline
- 2026-06-10 Sold (MLS) — LERA
- 2026-05-20 Pending — LERA
- 2026-05-12 Contingent — LERA
- 2026-05-07 Listed $155,000 LERA
- 2025-05-05 Rental Removed $1,300 SHOWMOJO2
- 2025-05-05 Listed for Rent $1,300 SHOWMOJO2
- 2025-05-05 Rental Removed $1,300 SHOWMOJO2
- 2025-05-01 Listed for Rent $1,300 SHOWMOJO2
- 2022-02-07 Price Changed $1,500 RENT.
- 2020-08-07 Sold (Public Records) — Public Records
- 2020-08-06 Sold (MLS) — LERA
- 2020-06-26 Pending — LERA
- 2020-06-19 Listed — LERA
- 2020-06-19 Listed $150,000 LERA
Property tax history
+13.9%/yrLatest (2025): $4,085 · +2.4% YoY. Source: county tax records.
Cash-flow waterfall
monthlySold comps — $/sqft
last 12 mo · ≤1 miLoading sold comps…