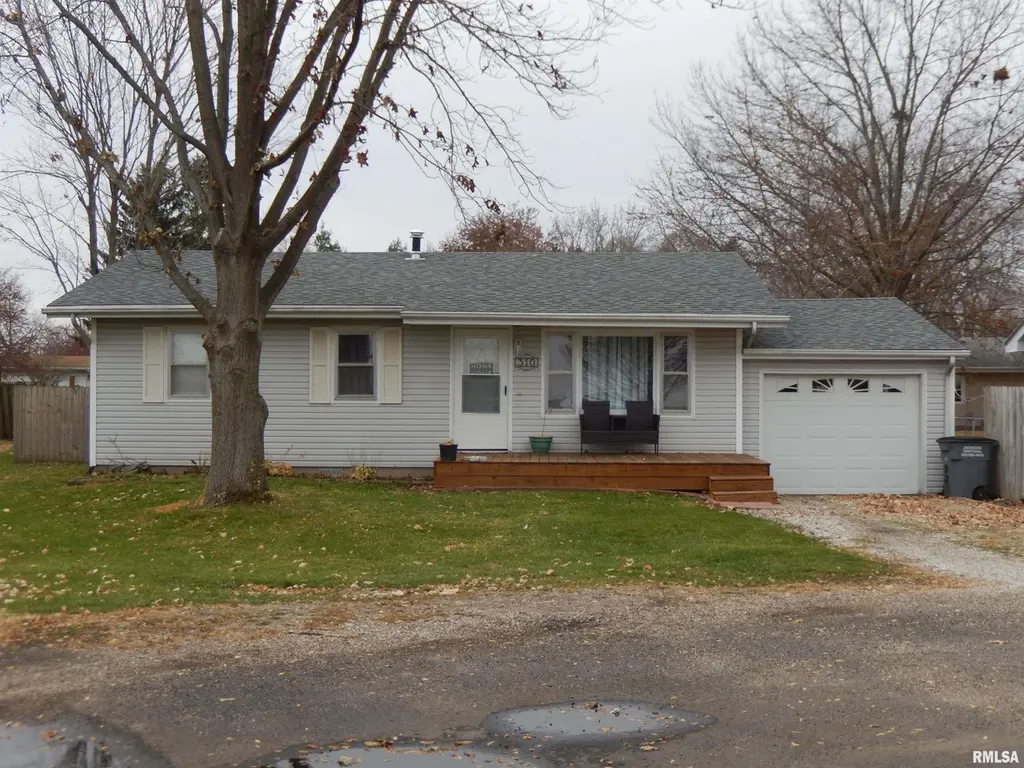
310 Cathy St · Colchester, IL
Flood risk 1/10 · Minimal
- FEMA flood zone
- —
- Chance of flooding over 30 yrs
- 0.0%
- Est. flood insurance / yr
- —
Fire risk 1/10 · Minimal
- Est. fire insurance / yr
- $804 – $1,492
Heat risk 3/10 · Minor
- Hot days now (above 106°F)
- 7 days/yr
- Hot days in 30 yrs
- 17 days/yr
Wind risk 2/10 · Minimal
- Chance of severe wind over 30 yrs
- —
Air-quality risk 2/10 · Minimal
- Unhealthy air days now
- 0 days/yr
- Unhealthy air days in 30 yrs
- 1 days/yr
Risk factors via First Street. Map © Google.
Why this score? — see what drove the C- grade
The composite is a weighted blend of 9 inputs, each scored 0–100. Each bar is that input's sub-score; the figure is the points it added to the 100-point composite (weight × sub-score).
- Cash flow +22.2/30.0
- DSCR +7.1/10.0
- 1% rule +6.7/10.0
- Appreciation +6.4/10.0
- Livability +3.4/5.0
- Rent growth +2.5/5.0
- Condition / age +2.5/5.0
- Schools +1.9/10.0
- ARV discount +0.0/15.0
$87,000
🖨 Deal sheet (PDF) 📄 Offer letter ✓ Due diligence
Listing remarks MLS
This 3 bedroom home in Colchester has over 1,000 SF, a fenced backyard, and an attached garage. Located on a cul-de-sac in a quiet subdivision, this cute home even has a newer roof, replaced in 2021! Priced to sell at only $71,500; call today for your appointment!
Key facts
- Laminate flooring
- Attached garage
- Fenced in backyard
Tags
Neighborhood map
What this means for you Summary
Snapshot
- This is a 3-bed/1.0-bath single-family listed at $87k.
Deal economics
- At list price, monthly cash flow is $141 ($2k/yr) — positive.
- The deal already cash-flows at list — no discount required.
- Meets the 1% rule at list price ($1k rent vs $87k).
- Recommended offer: $84k (3.0% below list) — sets the bar for market timing.
Location & tenants
- Location reads 68/100 on livability (#485 in IL) — a middle-class / working-renter tenant base. Strengths: cost of living A+, housing A+, crime A; Watch: health & safety C-, amenities F, commute F.
- West Prairie CUSD 103 (rural): math 20% / reading 23% proficiency, ranked #408 of 620 in IL (top 66%) — low school quality limits family demand, transient renter base, plan for 1-2y turnover.
- Zoned schools: West Prairie South Elementary Sch (math 64% / reading 54%, grade B-, #68 of 2,056 statewide, top 4%, 177 students, 0% FRL); West Prairie Junior High School (math 8% / reading 17%, grade F, #550 of 665 statewide, top 84%, 99 students, 0% FRL); West Prairie Senior High School (math 10% / reading 30%, grade F, #357 of 693 statewide, top 54%, 162 students, 0% FRL) — zoned schools average 0% FRL vs 43% district-wide (43 pts lower); this property's tenant base skews higher-income than the district average.
- Market conditions: 7 active listings in the ZIP.
Forward outlook
- In year one you build about $3k of equity ($601 loan paydown + $2k appreciation (2.7% local appreciation)).
- At projected returns (2.7% appreciation + 3.0% rent growth), your $24k cash investment doubles in ~5 years — after that, you're playing with house money.
Negotiation context
- It's been on market 39 days — a 3% lower offer ($84k) is reasonable based on typical stale-listing flexibility.
- 3 sale attempts since 3y ago; this cycle's ask is 22% above the opening price — seller raised mid-cycle; expect resistance to lowballs.
- Current owner paid $68k; 28% above their basis — modest negotiation headroom, anchor on the comps not their cost.
Questions for the listing agent
- It's been on market 39 days. Have you received any prior offers? Is the seller open to a 3% concession, seller financing, or rate buy-down credit?
- Built in 1977 — when were the roof, HVAC, electrical panel, plumbing, and water heater last replaced?
- Is there a deadline driving the sale (1031 exchange, divorce, estate, relocation)? That informs how much negotiation room exists.
- Schools are F-rated, which usually means shorter tenancies and higher turnover. Who's the typical renter profile here, and what's been the actual vacancy rate?
- What's the average days-on-market for RENTAL listings here right now (not sales)? A rising rental-DOM trend means longer vacancies and softer asking-rent achievability than the comps imply.
- What's the recent tenant-quality profile in this submarket — average credit score on applications, eviction rate, late-payment / NSF rate, and stable-employment percentage? A property-management company in the area should have these aggregated.
- How much new for-sale + rental construction is in the pipeline within 1–3 miles? Heavy new supply typically softens prices + rents 12–24 months out; constrained supply supports both.
Investment metrics
- 1% rule
- 1.17% ✓
- Cap rate
- 8.24%
- Cash-on-cash
- 6.96%
- DSCR
- 1.31
- GRM
- 7.2
CMA / ARV
- ARV (median comp)
- $72,350
- List price
- $87,000
- Delta
- 20.25%
- Verdict
- OVERPRICED
- Comps
- 20 within 1.0 mi
Show comp detail 7 sales within ~0.75 mi
| Address | Dist | Beds/Ba | Sqft | Sold | Price | $/sf | Match |
|---|---|---|---|---|---|---|---|
| 306 Debbie St | 0.05mi | 3/1.0 | 1,075 (+7%) | 9mo | $83,000 | $77 | 80 |
| 603 Sherry St | 0.09mi | 3/1.0 | 1,128 (+12%) | 11mo | $80,500 | $71 | 67 |
| 207 E North St | 0.44mi | 2/1.0 (-1) | 1,024 (+2%) | 12mo | $70,000 | $68 | 62 |
| 206 & 210 E Smith St | 0.33mi | 3/1.5 | 1,144 (+14%) | 6mo | $149,000 | $130 | 55 |
| 704 Macomb St | 0.25mi | 3/1.5 | 1,126 (+12%) | 18mo | $130,000 | $115 | 52 |
| 413 W South St | 0.65mi | 2/1.5 (-1) | 1,102 (+9%) | 3mo | $27,000 | $25 | 44 |
| 305 W Lee St | 0.58mi | 3/2.0 | 1,128 (+12%) | 14mo | $127,000 | $113 | 38 |
Match score weights: distance 35% · size 25% · config 20% · recency 20%. Top-matched comps best support the ARV.
Projected returns pro-forma
2.74% appreciation · 3.0% rent growth · sell at horizon
- IRR
- 13.4%
- Equity multiple
- 1.75×
- Total profit
- $18,336
- Equity at exit
- $37,850
- IRR
- 15.5%
- Equity multiple
- 3.23×
- Total profit
- $54,248
- Equity at exit
- $57,362
Cash invested: $24,360 (down + closing). Projections, not guarantees.
Landlord ↔ Tenant lean methodology
- Overall (STATE)
- 43 Moderately Tenant-Leaning
- State Illinois
- 43 Moderately Tenant-Leaning · D+7
- County
- — inherits STATE
- City
- — inherits STATE
ZIP-level market 62326
- Home prices YoY
- 1.8%
- Active inventory
- 7
- Price-to-rent
- 7.2×
Monthly cashflow live
- Estimated rent
- $1,014 medium interval (Pro) →
- Mortgage (P&I)
- −$456
- Tax from tax record
- −$167 /mo · $2,005/yr
- Insurance
- −$36
- HOA
- −$0
- Vacancy / Maint / Mgmt
- −$213
- Net cashflow
- $141
Break-even live
Sensitivity live
| Price | -10% $191 | -5% $166 | +0% $141 | +5% $117 | +10% $92 |
|---|---|---|---|---|---|
| Rent | -10% $61 | -5% $101 | +0% $141 | +5% $181 | +10% $221 |
| Rate | -1.0pp $185 | -0.5pp $163 | base $141 | +0.5pp $119 | +1.0pp $96 |
UW: 25.0% down · 7.5% · 30yr · 1.5% tax · 5.0% vac · 8.0% maint · 8.0% mgmt
Financing live
Cash to close
- Down payment
- $21,750
- Closing costs
- $2,610
- Reserves months
- —
- Total cash needed
- —
Loan-product check · same deal, 3 products live
Conventional
25% down · 7.5% · 30yr
- Down + closing
- —
- Monthly P&I
- —
- Monthly cashflow
- —
- DSCR
- —
- Eligible?
- —
Personal DTI + credit; lowest rate.
DSCR
20% down · 8.5% · 30yr
- Down + closing
- —
- Monthly P&I
- —
- Monthly cashflow
- —
- DSCR
- —
- Eligible?
- —
No personal income docs; deal must DSCR.
Hard money
10% down · 12.0% · 12mo
- Down + closing
- —
- Monthly P&I
- —
- Monthly cashflow
- —
- DSCR
- —
- Eligible?
- —
Short-term bridge; refi at stabilization.
Listing history 18 events
-
2026-06-21days on market $87,000 Active 39 DOM
-
2026-06-19days on market $87,000 Active 37 DOM
-
2026-06-18days on market $87,000 Active 36 DOM
-
2026-06-17days on market $87,000 Active 35 DOM
-
2026-06-16days on market $87,000 Active 34 DOM
-
2026-06-15days on market $87,000 Active 33 DOM
-
2026-06-14days on market $87,000 Active 31 DOM
-
2026-06-13statusdays on market $87,000 Active 30 DOM
-
2026-04-03price
-
2026-01-21price
-
2025-12-04status Active
-
2025-12-04historical
-
2025-11-11historical Under Contract
-
2025-11-04Active
-
2024-01-05soldstatus $68,000 Closed 265-char remark
Show marketing remark (265 chars)
This 3 bedroom home in Colchester has over 1,000 SF, a fenced backyard, and an attached garage. Located on a cul-de-sac in a quiet subdivision, this cute home even has a newer roof, replaced in 2021! Priced to sell at only $71,500; call today for your appointment!
-
2024-01-05soldstatus $68,000
Show marketing remark (265 chars)
This 3 bedroom home in Colchester has over 1,000 SF, a fenced backyard, and an attached garage. Located on a cul-de-sac in a quiet subdivision, this cute home even has a newer roof, replaced in 2021! Priced to sell at only $71,500; call today for your appointment!
-
2023-11-27status Pending 265-char remark
Show marketing remark (265 chars)
This 3 bedroom home in Colchester has over 1,000 SF, a fenced backyard, and an attached garage. Located on a cul-de-sac in a quiet subdivision, this cute home even has a newer roof, replaced in 2021! Priced to sell at only $71,500; call today for your appointment!
-
2023-11-20$71,500 Active 265-char remark
Show marketing remark (265 chars)
This 3 bedroom home in Colchester has over 1,000 SF, a fenced backyard, and an attached garage. Located on a cul-de-sac in a quiet subdivision, this cute home even has a newer roof, replaced in 2021! Priced to sell at only $71,500; call today for your appointment!
ⓘ Source: listings_history table (triggers on properties + properties_extension) + one-shot
backfill from property_details.listing_events for pre-trigger history.
Tax reassessment forecast IL · Partial reset (capped growth)
- Current annual tax
- $2,005 · $167/mo
- Projected year-2 tax
- $2,005 · $167/mo
- Expected delta
- $0/yr ($0/mo · 0.0%)
ⓘ Screening estimate from a state-policy table — verify with the county assessor before closing.
Climate risk First Street
- Flood 1/10 Low 0% chance over 30 yrs
- Wildfire 1/10 Low
- Heat 3/10 Moderate 7 d/yr ≥106°F today · 17 d/yr by 30 yrs out
- Wind 2/10 Low
- Air quality 2/10 Low 0 unhealthy d/yr today · 1 by 30 yrs out
Nearby sold comps map
Loading sold comps map…
Walkable amenities ~0.75 mi
Loading nearby amenities…
Taxation est. · year 1
- Rental income
- $12,165
- − Mortgage interest
- −$4,873
- − Property taxes
- −$2,005
- − Insurance
- −$435
- − Repairs & maintenance
- −$973
- − Management
- −$973
- − Depreciation
- −$2,531
- Taxable income
- $374
- Est. tax owed @ 24.0%
- −$90
- After-tax cash flow
- $1,606/yr
For passive investors: Depreciation is non-cash, so a rental often shows a tax loss while cash-flowing — sheltering income. Rental losses are passive: they offset passive income freely, and up to $25,000/yr can offset ordinary (W-2) income if you actively participate and your MAGI is under $100k (phasing out to $0 by $150k); unused losses carry forward. On sale, claimed depreciation is recaptured at up to 25%, and gains may owe capital-gains tax (a 1031 exchange can defer both). Figures are a year-1 estimate at your 24.0% rate — not tax advice; consult a CPA.
Schools (NCES district)
- District
- West Prairie CUSD 103
- NCES district ID
- 1700314
- Math proficiency
- 20% ▬ 0.00%
- Reading proficiency
- 23% ▼ -8.00%
- Median HH income
- $44,721
- Composite
- 18.65/100
- National rank
- #8890
- State rank
- #408 of 620 in IL
Livability — Colchester
- Score
- 68/100
- State rank
- #485
- US rank
- #10073
Category grades
Schools grade is shown separately in the Schools card above.
Census & demographics
- Census place
- Colchester, IL
- Population (ZIP)
- 2,317
Population outlook (McDonough County) Hauer SSP2
- Today (2025)
- 33,242 people
- By 2030
- 33,318 · +0.2%
- By 2040
- 33,520 · +0.8%
- By 2050
- 33,630 · +1.2%
- By 2075
- 33,657 · +1.2%
- By 2100
- 33,127 · -0.3%
Race, ethnicity, and origin ACS 2023
- Neighborhood character
- Predominantly White (97%)
- Race & ethnicity
- White 97% Hispanic / Latino 2% Two or more races 1%
- Common ancestry
- Iranian 9% Slovak 5% Italian 2%
- Foreign-born
- 0%
- Languages at home
- 95% English-only · German/W. Germanic 4% Spanish 1%
Political lean MEDSL · McDonough
- 2024 margin
- R (+18.9) · D 39.7% · R 58.5% · Other 1.8%
- 2008→2024 swing
- -24.4pp toward R · 2008: 5.6pp · 2024: -18.9pp
- All cycles
- 2024: R+18.9 2020: R+16.6 2016: R+11.7 2012: R+1.5 2008: D+5.6
Not yet ingested
- Civics
- —
Market trends
- HPI YoY
- ▲ 2.74%
- Current HPI
- 157.9142
- Rent YoY
- —
- Metro
- —
- State GDP YoY
- ▲ 1.59%
- F500 in state
- 60
Industry mix (Fortune 500 HQ in IL)
| Industry | F500 HQs | Revenue |
|---|---|---|
| Insurance | 4 | $201B |
|
||
| Consumer Goods | 4 | $87B |
|
||
| Industrial Machinery | 3 | $64B |
|
||
| Healthcare | 2 | $55B |
|
||
| Retail / Pharmacy | 1 | $148B |
|
||
| Agriculture / Food | 1 | $86B |
|
||
Price history
-4.9% since first listed10 events — show timeline
- 2026-04-03 Price Changed — RMLSA as Distributed by MLS Grid
- 2026-01-21 Price Changed — RMLSA as Distributed by MLS Grid
- 2025-12-04 Relisted — RMLSA as Distributed by MLS Grid
- 2025-12-04 Listing Removed — RMLSA as Distributed by MLS Grid
- 2025-11-11 Contingent — RMLSA as Distributed by MLS Grid
- 2025-11-04 Listed — RMLSA as Distributed by MLS Grid
- 2024-01-05 Sold (Public Records) $68,000 Public Records
- 2024-01-05 Sold (MLS) $68,000 RMLSA as Distributed by MLS Grid
- 2023-11-27 Pending — RMLSA as Distributed by MLS Grid
- 2023-11-20 Listed $71,500 RMLSA as Distributed by MLS Grid
Property tax history
+3.0%/yrLatest (2024): $2,005 · +6.4% YoY. Source: county tax records.
Cash-flow waterfall
monthlySold comps — $/sqft
last 12 mo · ≤1 miLoading sold comps…