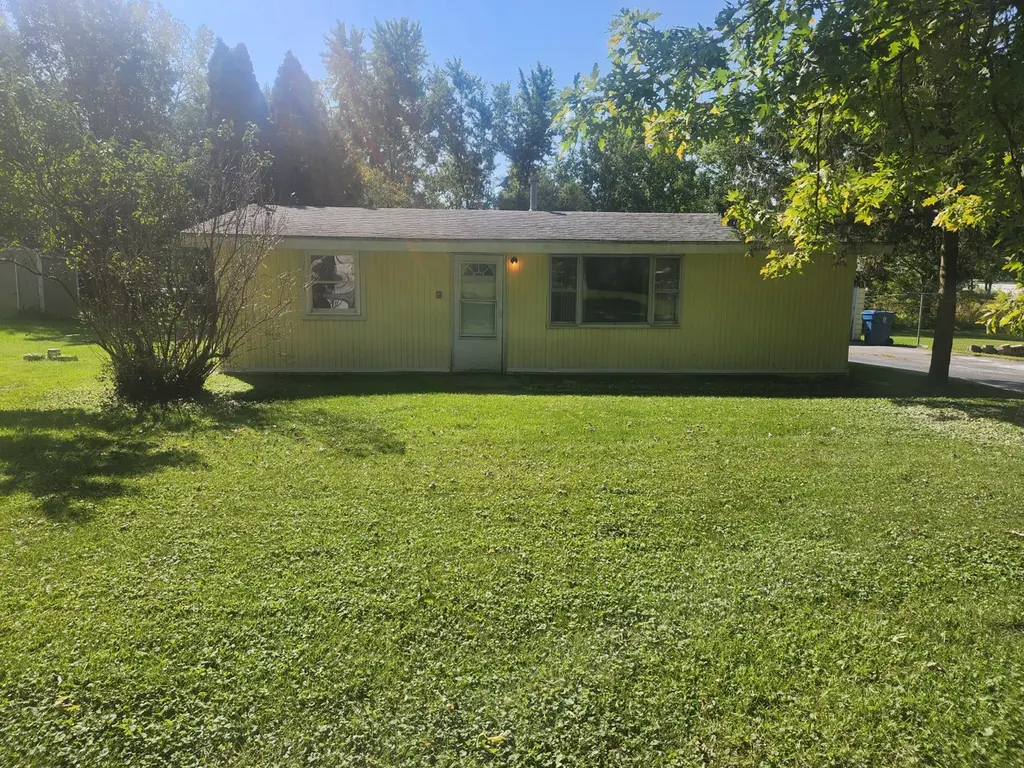
14205 Jay St · Dyer, IN
Flood risk 8/10 · Major
- FEMA flood zone
- X (unshaded)
- Chance of flooding over 30 yrs
- 0.99%
- Est. flood insurance / yr
- $507 – $1,088
Fire risk 1/10 · Minimal
- Est. fire insurance / yr
- $717 – $1,331
Heat risk 3/10 · Minor
- Hot days now (above 101°F)
- 7 days/yr
- Hot days in 30 yrs
- 15 days/yr
Wind risk 2/10 · Minimal
- Chance of severe wind over 30 yrs
- 0.0%
Air-quality risk 2/10 · Minimal
- Unhealthy air days now
- 2 days/yr
- Unhealthy air days in 30 yrs
- 2 days/yr
Risk factors via First Street. Map © Google.
Why this score? — see what drove the C+ grade
The composite is a weighted blend of 9 inputs, each scored 0–100. Each bar is that input's sub-score; the figure is the points it added to the 100-point composite (weight × sub-score).
- Cash flow +20.9/30.0
- ARV discount +15.0/15.0
- DSCR +6.6/10.0
- Schools +4.5/10.0
- 1% rule +4.1/10.0
- Livability +4.0/5.0
- Rent growth +2.5/5.0
- Condition / age +2.5/5.0
- Appreciation +0.0/10.0
$180,000
🖨 Deal sheet (PDF) 📄 Offer letter ✓ Due diligence
Listing remarks MLS
Welcome Home!! This 3-bedroom, 1-bathroom house is on a spacious lot. Conveniently located near shopping, dining, and major highways.
Key facts
- 0.46 acre lot
- 2 garage spots
- Built 1956
Neighborhood map
What this means for you Summary
Snapshot
- This is a 3-bed/1.0-bath single-family listed at $180k.
Deal economics
- At list price, monthly cash flow is $183 ($2k/yr) — positive.
- The deal already cash-flows at list — no discount required.
- To meet the 1% rule (rent ≥ 1% of price), the offer needs to be $165k (8.5% below list).
- Recommended offer: $158k (12.0% below list) — sets the bar for market timing.
- Cap rate 8.0% vs local median 2.5% in Dyer — top-decile yield for the area; either an underpriced asset or a hidden risk that comps aren't pricing in. Stress-test before assuming the spread holds.
Location & tenants
- Location reads 79/100 on livability (#27 in IN, #2,273 nationally) — a middle-class / working-renter tenant base. Strengths: crime A+, employment A+, housing A+; Watch: health & safety D+, amenities F, commute F.
- Lake Central School Corporation (suburban): math 45% / reading 54% proficiency, ranked #41 of 301 in IN (top 14%) — families likely to look elsewhere, expect single-tenant / working-renter base with shorter leases; only 15% free/reduced lunch — higher-income household profile.
- Zoned schools: Lake Central High School (math 46% / reading 74%, grade C+, #46 of 369 statewide, top 13%, 3,069 students, 23% FRL).
- Market conditions: 166 active listings in the ZIP; 1,642 units permitted in Lake County in 2024 (14 in 5+ unit buildings).
Forward outlook
- Local home prices are declining (-3.0%/yr); year-one equity from $1k of loan paydown is wiped out by about $5k of value loss. Plan a longer hold.
- Lake County population projected to shrink 7% by 2050 — rents likely to lag national; underwrite the cash flow, not the appreciation.
Negotiation context
- It's been on market 276 days — a 12% lower offer ($158k) is reasonable based on typical stale-listing flexibility.
Risks & watch-outs
- Watch-outs: flood insurance adds $66/mo; built in 1956 — expect roof / HVAC / electrical / plumbing capex.
- Climate carrying-cost: severe flood risk — expect insurance premiums to compound above CPI over the hold.
Questions for the listing agent
- It's been on market 276 days. Have you received any prior offers? Is the seller open to a 12% concession, seller financing, or rate buy-down credit?
- Built in 1956 — when were the roof, HVAC, electrical panel, plumbing, and water heater last replaced?
- What's the actual annual flood-insurance premium (NFIP or private), and is the property in a SFHA with mandatory coverage?
- Why hasn't it sold? Are there any deal-killer items the seller is aware of (foundation, flood, title, zoning, code violations)?
- Is there a deadline driving the sale (1031 exchange, divorce, estate, relocation)? That informs how much negotiation room exists.
- Schools are B-rated — typically a magnet for longer-tenancy family renters. What's the average tenant stay here, and is there a school-zone premium baked into asking?
- What's the average days-on-market for RENTAL listings here right now (not sales)? A rising rental-DOM trend means longer vacancies and softer asking-rent achievability than the comps imply.
- What's the recent tenant-quality profile in this submarket — average credit score on applications, eviction rate, late-payment / NSF rate, and stable-employment percentage? A property-management company in the area should have these aggregated.
- How much new for-sale + rental construction is in the pipeline within 1–3 miles? Heavy new supply typically softens prices + rents 12–24 months out; constrained supply supports both.
Investment metrics
- 1% rule
- 0.91% ✗
- Cap rate
- 7.95%
- Cash-on-cash
- 5.93%
- DSCR
- 1.26
- GRM
- 9.1
CMA / ARV
- ARV (median comp)
- $250,515
- List price
- $180,000
- Delta
- -28.15%
- Verdict
- UNDERPRICED
- Comps
- 16 within 1.0 mi
Show comp detail 1 sale within ~0.75 mi
| Address | Dist | Beds/Ba | Sqft | Sold | Price | $/sf | Match |
|---|---|---|---|---|---|---|---|
| 7892 Larry St | 0.16mi | 2/1.0 (-1) | 900 (-3%) | 4mo | $230,000 | $256 | 79 |
Match score weights: distance 35% · size 25% · config 20% · recency 20%. Top-matched comps best support the ARV.
Projected returns pro-forma
-3.0% appreciation · 3.0% rent growth · sell at horizon
- IRR
- -9.5%
- Equity multiple
- 0.65×
- Total profit
- $-17,592
- Equity at exit
- $26,839
- IRR
- -0.2%
- Equity multiple
- 0.99×
- Total profit
- $-559
- Equity at exit
- $15,563
Cash invested: $50,400 (down + closing). Projections, not guarantees.
Landlord ↔ Tenant lean methodology
- Overall (STATE)
- 90 Strongly Landlord-Friendly
- State Indiana
- 90 Strongly Landlord-Friendly · R+11
- County
- — inherits STATE
- City
- — inherits STATE
ZIP-level market 46311
- Active inventory
- 166
- Price-to-rent
- 9.1×
Monthly cashflow live
- Estimated rent
- $1,647 medium interval (Pro) →
- Mortgage (P&I)
- −$944
- Tax from tax record
- −$33 /mo · $394/yr
- Insurance
- −$75
- Flood insurance flood zone
- −$66 /mo · $798/yr
- HOA
- −$0
- Vacancy / Maint / Mgmt
- −$346
- Net cashflow
- $183
Break-even live
Sensitivity live
| Price | -10% $284 | -5% $234 | +0% $183 | +5% $132 | +10% $-134 |
|---|---|---|---|---|---|
| Rent | -10% $52 | -5% $118 | +0% $183 | +5% $248 | +10% $313 |
| Rate | -1.0pp $273 | -0.5pp $228 | base $183 | +0.5pp $136 | +1.0pp $88 |
UW: 25.0% down · 7.5% · 30yr · 1.5% tax · 5.0% vac · 8.0% maint · 8.0% mgmt
Financing live
Cash to close
- Down payment
- $45,000
- Closing costs
- $5,400
- Reserves months
- —
- Total cash needed
- —
Loan-product check · same deal, 3 products live
Conventional
25% down · 7.5% · 30yr
- Down + closing
- —
- Monthly P&I
- —
- Monthly cashflow
- —
- DSCR
- —
- Eligible?
- —
Personal DTI + credit; lowest rate.
DSCR
20% down · 8.5% · 30yr
- Down + closing
- —
- Monthly P&I
- —
- Monthly cashflow
- —
- DSCR
- —
- Eligible?
- —
No personal income docs; deal must DSCR.
Hard money
10% down · 12.0% · 12mo
- Down + closing
- —
- Monthly P&I
- —
- Monthly cashflow
- —
- DSCR
- —
- Eligible?
- —
Short-term bridge; refi at stabilization.
Listing history 16 events
-
2026-06-21days on market $180,000 Active 276 DOM
-
2026-06-18days on market $180,000 Active 273 DOM
-
2026-06-17days on market $180,000 Active 272 DOM
-
2026-06-16days on market $180,000 Active 271 DOM
-
2026-06-15days on market $180,000 Active 270 DOM
-
2026-06-13days on market $180,000 Active 268 DOM
-
2026-06-09days on market $180,000 Active 264 DOM
-
2026-06-08days on market $180,000 Active 263 DOM
-
2026-06-07days on market $180,000 Active 262 DOM
-
2026-06-04days on market $180,000 Active 259 DOM
-
2026-06-03days on market $180,000 Active 258 DOM
-
2026-06-02days on market $180,000 Active 257 DOM
-
2026-06-01days on market $180,000 Active 256 DOM
-
2026-05-31days on market $180,000 Active 255 DOM
-
2026-04-16price $180,000 133-char remark
Show marketing remark (133 chars)
Welcome Home!! This 3-bedroom, 1-bathroom house is on a spacious lot. Conveniently located near shopping, dining, and major highways.
-
2025-09-18$209,999 Active 133-char remark
Show marketing remark (133 chars)
Welcome Home!! This 3-bedroom, 1-bathroom house is on a spacious lot. Conveniently located near shopping, dining, and major highways.
ⓘ Source: listings_history table (triggers on properties + properties_extension) + one-shot
backfill from property_details.listing_events for pre-trigger history.
Tax reassessment forecast IN · Partial reset (capped growth)
- Current annual tax
- $394 · $33/mo
- Projected year-2 tax
- $962 · $80/mo
- Expected delta
- +$568/yr (+$47/mo · 144.2%)
ⓘ Screening estimate from a state-policy table — verify with the county assessor before closing.
Climate risk First Street
- Flood 8/10 Severe FEMA zone X (unshaded) · 99% chance over 30 yrs
- Wildfire 1/10 Low
- Heat 3/10 Moderate 7 d/yr ≥101°F today · 15 d/yr by 30 yrs out
- Wind 2/10 Low 0% chance of damaging wind over 30 yrs
- Air quality 2/10 Low 2 unhealthy d/yr today · 2 by 30 yrs out
Nearby sold comps map
Loading sold comps map…
Walkable amenities ~0.75 mi
Loading nearby amenities…
Taxation est. · year 1
- Rental income
- $19,759
- − Mortgage interest
- −$10,083
- − Property taxes
- −$394
- − Insurance
- −$1,697
- − Repairs & maintenance
- −$1,581
- − Management
- −$1,581
- − Depreciation
- −$5,236
- Taxable loss
- −$813
- Est. tax savings @ 24.0%
- +$195
- After-tax cash flow
- $2,386/yr
For passive investors: Depreciation is non-cash, so a rental often shows a tax loss while cash-flowing — sheltering income. Rental losses are passive: they offset passive income freely, and up to $25,000/yr can offset ordinary (W-2) income if you actively participate and your MAGI is under $100k (phasing out to $0 by $150k); unused losses carry forward. On sale, claimed depreciation is recaptured at up to 25%, and gains may owe capital-gains tax (a 1031 exchange can defer both). Figures are a year-1 estimate at your 24.0% rate — not tax advice; consult a CPA.
Schools (NCES district)
- District
- Lake Central School Corporation
- NCES district ID
- 1805450
- Math proficiency
- 45% ▼ -9.00%
- Reading proficiency
- 54% ▼ -11.00%
- Median HH income
- $75,957
- Composite
- 44.82/100
- National rank
- #2736
- State rank
- #41 of 301 in IN
Livability — Dyer
- Score
- 79/100
- State rank
- #27
- US rank
- #2273
Category grades
Schools grade is shown separately in the Schools card above.
Census & demographics
- Population (ZIP)
- 23,405
Population outlook (Lake County) Hauer SSP2
- Today (2025)
- 484,026 people
- By 2030
- 478,091 · -1.2%
- By 2040
- 462,974 · -4.3%
- By 2050
- 449,894 · -7.1%
- By 2075
- 436,169 · -9.9%
- By 2100
- 426,607 · -11.9%
Race, ethnicity, and origin ACS 2023
- Neighborhood character
- Predominantly White (81%)
- Race & ethnicity
- White 81% Hispanic / Latino 13% Two or more races 10% Black 3% Asian 1%
- Hispanic origin (detail)
- Mexican 10% Puerto Rican 2%
- Common ancestry
- Romanian 16% Iranian 8% Slovak 2%
- Foreign-born
- 6% · Canada, China
- Languages at home
- 90% English-only · Spanish 6% Other Indo-European 1% Russian/Polish/Slavic 1%
Political lean MEDSL · Lake
- 2024 margin
- Lean D (+5.6) · D 52.1% · R 46.5% · Other 1.5%
- 2008→2024 swing
- -28.6pp toward R · 2008: 34.3pp · 2024: 5.6pp
- All cycles
- 2024: D+5.6 2020: D+15.1 2016: D+20.6 2012: D+31.0 2008: D+34.3
Not yet ingested
- Civics
- —
Market trends
- HPI YoY
- ▼ -177.39%
- Current HPI
- 212.2066
- Rent YoY
- —
- Metro
- —
- State GDP YoY
- ▲ 2.90%
- F500 in state
- 18
Industry mix (Fortune 500 HQ in IN)
| Industry | F500 HQs | Revenue |
|---|---|---|
| Industrial Machinery | 2 | $37B |
|
||
| Healthcare | 1 | $177B |
|
||
| Pharmaceuticals | 1 | $45B |
|
||
| Metals / Steel | 1 | $18B |
|
||
| Agriculture | 1 | $17B |
|
||
| Packaging | 1 | $12B |
|
||
Price history
-14.3% since first listed2 events — show timeline
- 2026-04-16 Price Changed $180,000 NIRA MLS as Distributed by MLS Grid
- 2025-09-18 Listed $209,999 NIRA MLS as Distributed by MLS Grid
Property tax history
+0.2%/yrLatest (2024): $394 · +27.2% YoY. Source: county tax records.
Cash-flow waterfall
monthlySold comps — $/sqft
last 12 mo · ≤1 miLoading sold comps…