6206 188th St NE #68 · Arlington, WA
Flood risk No data
- FEMA flood zone
- —
- Chance of flooding over 30 yrs
- —
- Est. flood insurance / yr
- —
Fire risk No data
- Est. fire insurance / yr
- —
Heat risk No data
- Hot days now (above threshold)
- —
- Hot days in 30 yrs
- —
Wind risk No data
- Chance of severe wind over 30 yrs
- —
Air-quality risk No data
- Unhealthy air days now
- —
- Unhealthy air days in 30 yrs
- —
Risk factors via First Street. Map © Google.
Why this score? — see what drove the B grade
The composite is a weighted blend of 9 inputs, each scored 0–100. Each bar is that input's sub-score; the figure is the points it added to the 100-point composite (weight × sub-score).
- Cash flow +30.0/30.0
- DSCR +10.0/10.0
- 1% rule +9.3/10.0
- ARV discount +7.5/15.0
- Schools +5.3/10.0
- Livability +4.0/5.0
- Rent growth +3.7/5.0
- Condition / age +2.5/5.0
- Appreciation +0.0/10.0
$125,000
🖨 Deal sheet (PDF) 📄 Offer letter ✓ Due diligence
Listing remarks
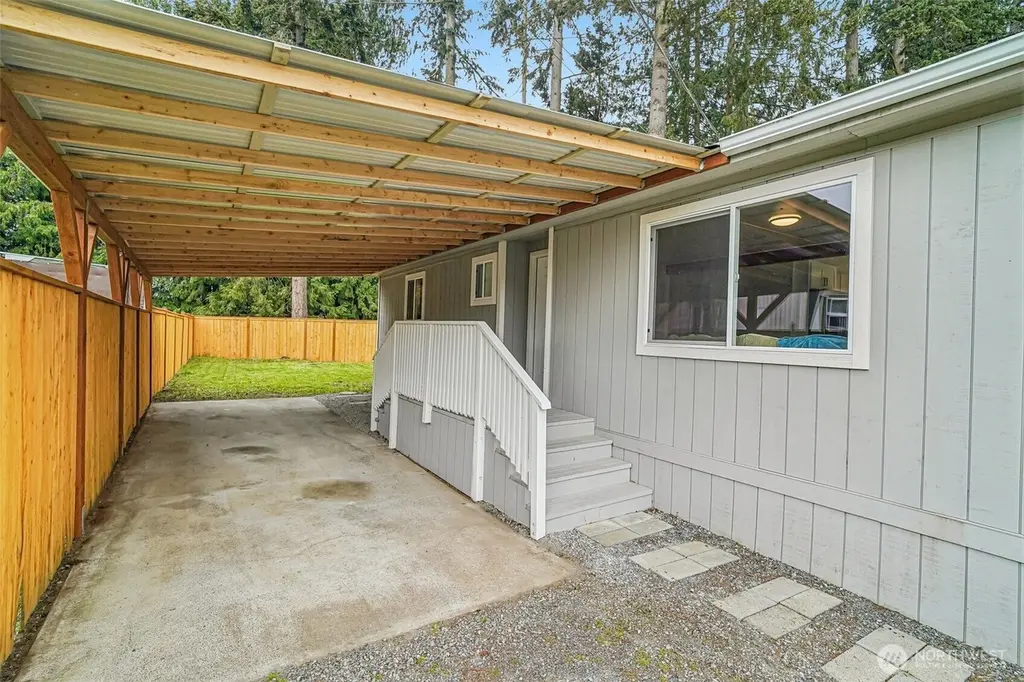
Tucked away in a quiet, low-density 55+ community in Arlington, this beautifully remodeled double-wide offers 2 bedrooms and 1.75 baths with comfort and convenience in mind. Thoughtfully updated throughout, you’ll find a brand-new kitchen with granite countertops, new appliances, and refreshed bathroom vanities—all tied together with a bright, open-concept layout. The home features new LVP flooring in the main living areas, plush new carpet in the bedrooms, fresh interior and exterior paint, a durable metal roof, and a recently serviced furnace—this is not a quick flip, but a home upgraded with care. Set in a quiet, cozy location, this home features a large, partially fenc
Key facts
- New appliances
- Brand-new kitchen
- Granite countertops
Tags
Property features AI
Finance
- Other: Buyer brokerage compensation 2.5%
- Financial info: Land lease amount $768; Listing terms: Cash
- HOA & community: Located in Airways MH Park; Park approved for sale; Common area; Senior community; Cats OK, Dogs OK; Land lease
Exterior
- Parking: Carport
- Utilities: Public water (paid by park); Public sewer (paid by park); PUD electric; Electric water heater
- Home design: Manufactured double-wide home; One level; Double wide body type; Model 44/24; Mobile home remains in place; Has view
- Construction: Wood construction; Metal roof; Wood skirt; Pillar/post/pier foundation with tie downs; Manufactured house structure
- Exterior features: Wood exterior; Paved lot
Interior
- Kitchen: Dishwasher; Microwave; Refrigerator; Stove/Range
- Bedrooms: 2 bedrooms
- Flooring: Vinyl plank; Carpet
- Bathrooms: 1 full bath; 1 three-quarter bath; 1 bathtub; 2 showers
- Heating & cooling: Forced air heating; No central cooling
- Interior features: Water heater; Kitchen with eating space; Living room; Utility room; Awnings; Patio/porch/deck; Landscaped
- Laundry & utility: Washer; Dryer
Neighborhood map
What this means for you Summary
Snapshot
- This is a 1-bed/1.0-bath manufactured listed at $125k.
Deal economics
- At list price, monthly cash flow is $546 ($7k/yr) — positive.
- The deal already cash-flows at list — no discount required.
- Meets the 1% rule at list price ($2k rent vs $125k).
- Cap rate 11.5% vs local median 2.5% in Arlington — top-decile yield for the area; either an underpriced asset or a hidden risk that comps aren't pricing in. Stress-test before assuming the spread holds.
Location & tenants
- Location reads 80/100 on livability (#96 in WA, #1,873 nationally) — a professional / high-income tenant draw. Strengths: employment A+, housing A+, health & safety A+; Watch: crime D+, cost of living F.
- Arlington School District (suburban): math 50% / reading 66% proficiency, ranked #58 of 291 in WA (top 20%) — acceptable for families but not a draw, mixed tenant base, ~2y average lease.
- Zoned schools: Pioneer Elementary (493 students, 35% FRL); Haller Middle School (589 students, 38% FRL); Arlington High School (1,661 students, 36% FRL).
- Market conditions: Rents rising fast (+4.8%/yr); 287 active listings in the ZIP; 8 comparable units currently listed for rent nearby; rentals leasing fast (median 1d on market — plan ~1-2 weeks tenant-placement turnaround); solid renter incomes; 3,982 units permitted in Snohomish County in 2024 (1,492 in 5+ unit buildings).
Forward outlook
- Local home prices are declining (-3.0%/yr); year-one equity from $864 of loan paydown is wiped out by about $4k of value loss. Plan a longer hold.
- Snohomish County population projected at +30% by 2050 — long-run rental-demand tailwind backs the buy-and-hold thesis.
- At projected returns (-3.0% appreciation + 4.8% rent growth), your $35k cash investment doubles in ~6 years — after that, you're playing with house money.
Negotiation context
- Only 12 days on market — expect competitive offers; lowballing is unlikely to land.
- 5 sale attempts since 12y ago with the ask held roughly flat each time — persistent listings suggest the price (not the market) is what's stuck; bring a comps-based counter.
- Current owner paid $18k; list at $125k implies a 594% gain — meaningful room to come down on a strong offer.
Questions for the listing agent
- Built in 1976 — when were the roof, HVAC, electrical panel, plumbing, and water heater last replaced?
- Is there a deadline driving the sale (1031 exchange, divorce, estate, relocation)? That informs how much negotiation room exists.
- Schools are B-rated — typically a magnet for longer-tenancy family renters. What's the average tenant stay here, and is there a school-zone premium baked into asking?
- Crime grade is D in this area — have there been break-ins, vandalism, or insurance claims at this property in the last 3 years? What carrier currently insures it and at what premium?
- What's the average days-on-market for RENTAL listings here right now (not sales)? A rising rental-DOM trend means longer vacancies and softer asking-rent achievability than the comps imply.
- What's the recent tenant-quality profile in this submarket — average credit score on applications, eviction rate, late-payment / NSF rate, and stable-employment percentage? A property-management company in the area should have these aggregated.
- How much new for-sale + rental construction is in the pipeline within 1–3 miles? Heavy new supply typically softens prices + rents 12–24 months out; constrained supply supports both.
Investment metrics
- 1% rule
- 1.43% ✓
- Cap rate
- 11.53%
- Cash-on-cash
- 18.72%
- DSCR
- 1.83
- GRM
- 5.8
CMA / ARV
- ARV (on-the-fly)
- $72,680
- Comps found
- 6
Show comp detail 6 sales within ~0.75 mi
| Address | Dist | Beds/Ba | Sqft | Sold | Price | $/sf | Match |
|---|---|---|---|---|---|---|---|
| 6206 188th St NE #11 | 0.00mi | 2/1.0 (+1) | 924 (+0%) | 2mo | $45,000 | $49 | 93 |
| 6206 188th St NE #68 | 0.00mi | 2/2.0 (+1) | 920 (0%) | 1mo | $125,000 | $136 | 90 |
| 6206 188th St NE #26 | 0.00mi | 2/2.0 (+1) | 924 (+0%) | 3mo | $64,698 | $70 | 88 |
| 6206 188th St NE #59 | 0.00mi | 2/1.5 (+1) | 960 (+4%) | 8mo | $76,000 | $79 | 79 |
| 6206 188th St #63 | 0.00mi | 2/2.0 (+1) | 1,008 (+10%) | 7mo | $80,400 | $80 | 69 |
| 6206 188th Ave NE #6 | 0.00mi | 2/1.0 (+1) | 1,008 (+10%) | 21mo | $51,000 | $51 | 62 |
Match score weights: distance 35% · size 25% · config 20% · recency 20%. Top-matched comps best support the ARV.
Projected returns pro-forma
-3.0% appreciation · 4.77% rent growth · sell at horizon
- IRR
- 12.5%
- Equity multiple
- 1.51×
- Total profit
- $17,778
- Equity at exit
- $18,638
- IRR
- 22.8%
- Equity multiple
- 3.12×
- Total profit
- $74,126
- Equity at exit
- $10,808
Cash invested: $35,000 (down + closing). Projections, not guarantees.
Landlord ↔ Tenant lean methodology
- Overall (STATE)
- 28 Tenant-Leaning
- State Washington
- 28 Tenant-Leaning · D+8
- County
- — inherits STATE
- City
- — inherits STATE
ZIP-level market 98223
- Rents YoY
- 4.8%
- Active inventory
- 287
- Price-to-rent
- 5.8×
Monthly cashflow live
- Estimated rent
- $1,785 high interval (Pro) →
- Mortgage (P&I)
- −$656
- Tax est. 1.5%
- −$156 /mo · $1,875/yr
- Insurance
- −$52
- HOA
- −$0
- Vacancy / Maint / Mgmt
- −$375
- Net cashflow
- $546
Break-even live
Sensitivity live
| Price | -10% $632 | -5% $589 | +0% $546 | +5% $503 | +10% $460 |
|---|---|---|---|---|---|
| Rent | -10% $405 | -5% $475 | +0% $546 | +5% $616 | +10% $687 |
| Rate | -1.0pp $609 | -0.5pp $578 | base $546 | +0.5pp $514 | +1.0pp $481 |
UW: 25.0% down · 7.5% · 30yr · 1.5% tax · 5.0% vac · 8.0% maint · 8.0% mgmt
Financing live
Cash to close
- Down payment
- $31,250
- Closing costs
- $3,750
- Reserves months
- —
- Total cash needed
- —
Loan-product check · same deal, 3 products live
Conventional
25% down · 7.5% · 30yr
- Down + closing
- —
- Monthly P&I
- —
- Monthly cashflow
- —
- DSCR
- —
- Eligible?
- —
Personal DTI + credit; lowest rate.
DSCR
20% down · 8.5% · 30yr
- Down + closing
- —
- Monthly P&I
- —
- Monthly cashflow
- —
- DSCR
- —
- Eligible?
- —
No personal income docs; deal must DSCR.
Hard money
10% down · 12.0% · 12mo
- Down + closing
- —
- Monthly P&I
- —
- Monthly cashflow
- —
- DSCR
- —
- Eligible?
- —
Short-term bridge; refi at stabilization.
Rent comps 8 comps
| Address | Beds | Baths | Sqft | Rent | $/sqft | DOM | Units | Dist |
|---|---|---|---|---|---|---|---|---|
| 18725 67th Ave NE Arlington, WA | 1.0–2.0 | 1.0–2.0 | 667 | $1,795 | $2.69 | 0d | 3 | 0.33mi |
| 19920 67th Ave NE #52 Arlington, WA | 2.0 | 1.0 | 800 | $1,485 | $1.86 | 6d | 1 | 0.84mi |
| 17327 67th Ave NE Arlington, WA | 2.0 | 1.0–2.5 | 900 | $1,918 | $2.13 | 0d | 7 | 0.91mi |
| 6605 204th St NE Arlington, WA | 1.0 | 1.0 | 578 | $1,700 | $2.94 | 0d | 2 | 1.15mi |
| 20310 74th Ave NE Arlington, WA | 3.0 | 1.0–2.0 | 819 | $1,937 | $2.36 | 0d | 17 | 1.28mi |
| 7980 200th St NE Arlington, WA | 2.0 | 1.5–2.0 | 958 | $2,188 | $2.28 | 0d | 6 | 1.31mi |
| 20227 77th Ave NE Arlington, WA | 1.0–2.0 | 1.0–2.0 | 805 | $1,675 | $2.08 | 0d | 6 | 1.37mi |
| 4906 Longhouse Trail Ln NE Arlington, WA | 2.0 | 1.0–2.0 | 687 | $1,874 | $2.73 | 0d | 9 | 1.47mi |
Listing history 13 events
-
2026-05-14status Pending
-
2026-05-01$125,000 Active
-
2025-01-15soldstatus $18,000 Closed
-
2025-01-07status Pending
-
2025-01-03price $26,500
-
2024-11-07status Active
-
2024-10-28status Pending
-
2024-10-21status Active
-
2024-10-04status Pending
-
2024-09-03$29,500 Active
-
2014-09-30soldstatus $7,000 Sold
-
2014-09-08status Pending
-
2014-08-12$8,500 Active
ⓘ Source: listings_history table (triggers on properties + properties_extension) + one-shot
backfill from property_details.listing_events for pre-trigger history.
Nearby sold comps map
Loading sold comps map…
Walkable amenities ~0.75 mi
Loading nearby amenities…
Taxation est. · year 1
- Rental income
- $21,415
- − Mortgage interest
- −$7,002
- − Property taxes
- −$1,875
- − Insurance
- −$625
- − Repairs & maintenance
- −$1,713
- − Management
- −$1,713
- − Depreciation
- −$3,636
- Taxable income
- $4,850
- Est. tax owed @ 24.0%
- −$1,164
- After-tax cash flow
- $5,388/yr
For passive investors: Depreciation is non-cash, so a rental often shows a tax loss while cash-flowing — sheltering income. Rental losses are passive: they offset passive income freely, and up to $25,000/yr can offset ordinary (W-2) income if you actively participate and your MAGI is under $100k (phasing out to $0 by $150k); unused losses carry forward. On sale, claimed depreciation is recaptured at up to 25%, and gains may owe capital-gains tax (a 1031 exchange can defer both). Figures are a year-1 estimate at your 24.0% rate — not tax advice; consult a CPA.
Schools (NCES district)
- District
- Arlington School District
- NCES district ID
- 5300240
- Math proficiency
- 50% ▼ -1.00%
- Reading proficiency
- 66% ▲ 1.00%
- Median HH income
- $73,341
- Composite
- 53.31/100
- National rank
- #3184
- State rank
- #58 of 291 in WA
Livability — Arlington
- Score
- 80/100
- State rank
- #96
- US rank
- #1873
Category grades
Schools grade is shown separately in the Schools card above.
Census & demographics
- Census place
- Arlington, WA
- County
- Snohomish County · 786,756 people
- City population
- 46,497
- Metro
- Seattle-Tacoma-Bellevue, WA
- Population (ZIP)
- 46,497
- Household income
- $99,681
- Rent vs Own
- Severe rent burden
- 1068.0
Population outlook (Snohomish County) Hauer SSP2
- Today (2025)
- 899,800 people
- By 2030
- 960,975 · +6.8%
- By 2040
- 1,074,447 · +19.4%
- By 2050
- 1,171,954 · +30.2%
- By 2075
- 1,384,849 · +53.9%
- By 2100
- 1,497,296 · +66.4%
Race, ethnicity, and origin ACS 2023
- Neighborhood character
- Predominantly White (79%)
- Race & ethnicity
- White 79% Hispanic / Latino 10% Two or more races 10% Asian 3%
- Hispanic origin (detail)
- Mexican 6%
- Common ancestry
- Portuguese 9% Lithuanian 3% Slovak 3%
- Foreign-born
- 7% · Canada, Vietnam
- Languages at home
- 90% English-only · Spanish 5% Tagalog/Filipino 1% Russian/Polish/Slavic 1%
Political lean MEDSL · Snohomish
- 2024 margin
- D (+19.0) · D 57.8% · R 38.9% · Other 3.3%
- 2008→2024 swing
- +0.1pp no change · 2008: 18.9pp · 2024: 19.0pp
- All cycles
- 2024: D+19.0 2020: D+20.6 2016: D+16.6 2012: D+16.2 2008: D+18.9
Not yet ingested
- Civics
- —
Market trends
- HPI YoY
- ▼ -527.84%
- Current HPI
- 314.8582
- Rent YoY
- ▲ 4.77%
- Metro
- Seattle-Tacoma-Bellevue, WA
- State GDP YoY
- ▲ 4.65%
- F500 in state
- 22
Industry mix (Fortune 500 HQ in WA)
| Industry | F500 HQs | Revenue |
|---|---|---|
| Retail | 2 | $269B |
|
||
| Technology / Retail | 1 | $638B |
|
||
| Technology | 1 | $245B |
|
||
| Telecommunications | 1 | $38B |
|
||
| Food / Beverage | 1 | $36B |
|
||
| Automotive / Trucks | 1 | $34B |
|
||
Price history
+1370.6% since first listed13 events — show timeline
- 2026-05-14 Pending — NWMLS as Distributed by MLS Grid
- 2026-05-01 Listed $125,000 NWMLS as Distributed by MLS Grid
- 2025-01-15 Sold (MLS) $18,000 NWMLS as Distributed by MLS Grid
- 2025-01-07 Pending — NWMLS as Distributed by MLS Grid
- 2025-01-03 Price Changed $26,500 NWMLS as Distributed by MLS Grid
- 2024-11-07 Relisted — NWMLS as Distributed by MLS Grid
- 2024-10-28 Pending — NWMLS as Distributed by MLS Grid
- 2024-10-21 Relisted — NWMLS as Distributed by MLS Grid
- 2024-10-04 Pending — NWMLS as Distributed by MLS Grid
- 2024-09-03 Listed $29,500 NWMLS as Distributed by MLS Grid
- 2014-09-30 Sold (MLS) $7,000 NWMLS as Distributed by MLS Grid
- 2014-09-08 Pending — NWMLS as Distributed by MLS Grid
- 2014-08-12 Listed $8,500 NWMLS as Distributed by MLS Grid
Property tax history
+3.9%/yrLatest (2026): $179 · +28.7% YoY. Source: county tax records.
Cash-flow waterfall
monthlySold comps — $/sqft
last 12 mo · ≤1 miLoading sold comps…