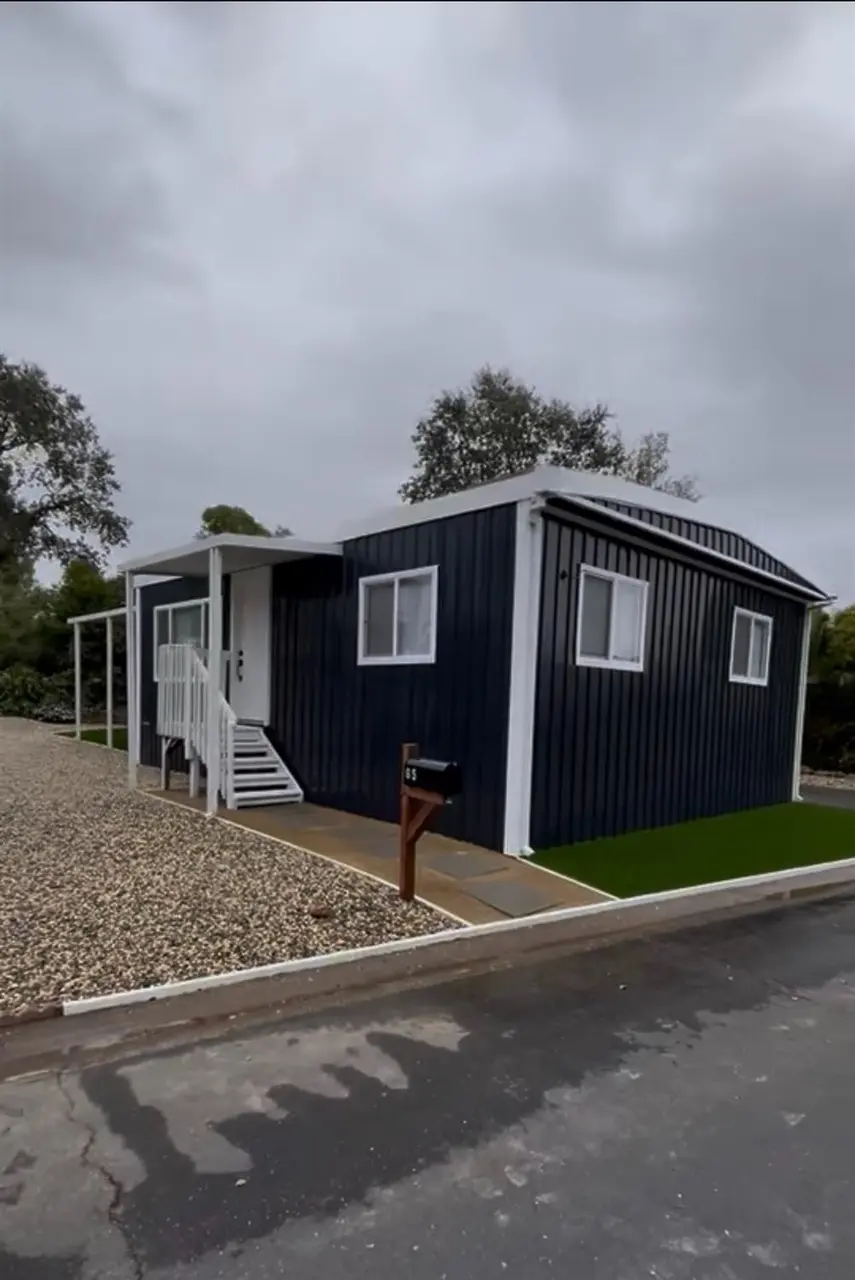
10035 Mills Station Rd #65 · Rancho Cordova, CA
Flood risk 1/10 · Minimal
- FEMA flood zone
- X (unshaded)
- Chance of flooding over 30 yrs
- 0.0%
- Est. flood insurance / yr
- $507 – $1,088
Fire risk 4/10 · Minor
- Est. fire insurance / yr
- $659 – $1,223
Heat risk 7/10 · Major
- Hot days now (above 102°F)
- 6 days/yr
- Hot days in 30 yrs
- 13 days/yr
Wind risk 1/10 · Minimal
- Chance of severe wind over 30 yrs
- —
Air-quality risk 10/10 · Severe
- Unhealthy air days now
- 33 days/yr
- Unhealthy air days in 30 yrs
- 35 days/yr
Risk factors via First Street. Map © Google.
Why this score? — see what drove the C+ grade
The composite is a weighted blend of 9 inputs, each scored 0–100. Each bar is that input's sub-score; the figure is the points it added to the 100-point composite (weight × sub-score).
- Cash flow +26.2/30.0
- DSCR +8.9/10.0
- ARV discount +7.5/15.0
- 1% rule +7.0/10.0
- Condition / age +4.0/5.0
- Schools +3.5/10.0
- Livability +3.4/5.0
- Rent growth +3.1/5.0
- Appreciation +0.0/10.0
$168,000
🖨 Deal sheet 📄 Offer letter ✓ Due diligence
Listing remarks
Everything is NEW! This move-in ready home features new flooring throughout, an updated kitchen and bathrooms, new siding, new windows, new doors, and fresh interior and exterior paint. Enjoy a low-maintenance patio, perfect for relaxing or entertaining. A total remodel from top to bottom, ready for its new owner!
Key facts
- New siding
- New doors
- New flooring
Tags
Neighborhood map
What this means for you Summary
Snapshot
- This is a 3-bed/2.0-bath manufactured listed at $168k. Condition is rated good.
Deal economics
- At list price, monthly cash flow is $429 ($5k/yr) — positive.
- The deal already cash-flows at list — no discount required.
- Meets the 1% rule at list price ($2k rent vs $168k).
- Recommended offer: $158k (6.0% below list) — sets the bar for market timing.
- Cap rate 9.4% vs local median 3.0% in Rancho Cordova — top-decile yield for the area; either an underpriced asset or a hidden risk that comps aren't pricing in. Stress-test before assuming the spread holds.
Location & tenants
- Location reads 68/100 on livability (#268 in CA) — a middle-class / working-renter tenant base. Strengths: housing A+, employment B; Watch: schools C-, commute C-, crime D.
- Sacramento City Unified (urban): math 32% / reading 43% proficiency, ranked #804 of 1,400 in CA (top 57%) — families likely to look elsewhere, expect single-tenant / working-renter base with shorter leases; 63% free/reduced lunch — lower-income household profile, screen leases tightly.
- Market conditions: Rents rising (+2.4%/yr); 109 active listings in the ZIP; 37 comparable units currently listed for rent nearby; rentals at typical pace (median 15d on market — plan ~3-4 weeks tenant-placement turnaround); solid renter incomes; 6,825 units permitted in Sacramento County in 2024 (1,752 in 5+ unit buildings).
Forward outlook
- Local home prices are declining (-3.0%/yr); year-one equity from $1k of loan paydown is wiped out by about $5k of value loss. Plan a longer hold.
- Sacramento County population projected at +17% by 2050 — long-run rental-demand tailwind backs the buy-and-hold thesis.
Negotiation context
- It's been on market 90 days — a 6% lower offer ($158k) is reasonable based on typical stale-listing flexibility.
Risks & watch-outs
- Climate carrying-cost: extreme-heat days projected 6→13/yr by 2055 (HVAC capex compounding) — expect insurance premiums to compound above CPI over the hold.
Questions for the listing agent
- It's been on market 90 days. Have you received any prior offers? Is the seller open to a 6% concession, seller financing, or rate buy-down credit?
- Built in 1977 — when were the roof, HVAC, electrical panel, plumbing, and water heater last replaced?
- Why hasn't it sold? Are there any deal-killer items the seller is aware of (foundation, flood, title, zoning, code violations)?
- Is there a deadline driving the sale (1031 exchange, divorce, estate, relocation)? That informs how much negotiation room exists.
- Crime grade is D in this area — have there been break-ins, vandalism, or insurance claims at this property in the last 3 years? What carrier currently insures it and at what premium?
- What's the average days-on-market for RENTAL listings here right now (not sales)? A rising rental-DOM trend means longer vacancies and softer asking-rent achievability than the comps imply.
- What's the recent tenant-quality profile in this submarket — average credit score on applications, eviction rate, late-payment / NSF rate, and stable-employment percentage? A property-management company in the area should have these aggregated.
- How much new for-sale + rental construction is in the pipeline within 1–3 miles? Heavy new supply typically softens prices + rents 12–24 months out; constrained supply supports both.
Investment metrics
- 1% rule
- 1.20% ✓
- Cap rate
- 9.36%
- Cash-on-cash
- 10.95%
- DSCR
- 1.49
- GRM
- 7.0
CMA / ARV
- ARV (median comp)
- $88,669
- List price
- $168,000
- Delta
- 89.47%
- Verdict
- OVERPRICED
- Comps
- 7 within 1.0 mi
Show comp detail 7 sales within ~0.75 mi
| Address | Dist | Beds/Ba | Sqft | Sold | Price | $/sf | Match |
|---|---|---|---|---|---|---|---|
| 10035 Mills Station Rd #26 | 0.12mi | 2/2.0 (-1) | 1,140 (+3%) | 6mo | $82,000 | $72 | 79 |
| 102 Countess Way #102 | 0.14mi | 3/2.0 | 1,248 (+13%) | 6mo | $127,500 | $102 | 66 |
| 10035 Mills Sta #7 | 0.05mi | 2/2.0 (-1) | 1,200 (+9%) | 14mo | $105,000 | $88 | 66 |
| 175 Dutchess Way #175 | 0.20mi | 3/2.0 | 1,152 (+4%) | 23mo | $125,500 | $109 | 64 |
| 2950 Routier #48 | 0.34mi | 3/2.0 | 1,248 (+13%) | 14mo | $160,000 | $128 | 51 |
| 101 Countess Way | 0.15mi | 2/2.0 (-1) | 1,248 (+13%) | 18mo | $120,000 | $96 | 51 |
| 2950 Routier Rd #5 | 0.29mi | 2/1.0 (-1) | 1,000 (-9%) | 15mo | $80,000 | $80 | 49 |
Match score weights: distance 35% · size 25% · config 20% · recency 20%. Top-matched comps best support the ARV.
Projected returns pro-forma
-3.0% appreciation · 2.41% rent growth · sell at horizon
- IRR
- -0.6%
- Equity multiple
- 0.98×
- Total profit
- $-1,054
- Equity at exit
- $25,049
- IRR
- 8.5%
- Equity multiple
- 1.63×
- Total profit
- $29,577
- Equity at exit
- $14,526
Cash invested: $47,040 (down + closing). Projections, not guarantees.
Landlord ↔ Tenant lean methodology
- Overall (STATE)
- 18 Strongly Tenant-Friendly
- State California
- 18 Strongly Tenant-Friendly · D+13
- County
- — inherits STATE
- City
- — inherits STATE
ZIP-level market 95827
- Rents YoY
- 2.4%
- Active inventory
- 109
- Price-to-rent
- 7.0×
Monthly cashflow live
- Estimated rent
- $2,013 high interval (Pro) →
- Mortgage (P&I)
- −$881
- Tax est. 1.5%
- −$210 /mo · $2,520/yr
- Insurance
- −$70
- HOA
- −$0
- Vacancy / Maint / Mgmt
- −$423
- Net cashflow
- $429
Break-even live
UW: 25.0% down · 7.5% · 30yr · 1.5% tax · 5.0% vac · 8.0% maint · 8.0% mgmt
Financing live
Cash to close
- Down payment
- $42,000
- Closing costs
- $5,040
- Reserves months
- —
- Total cash needed
- —
Loan-product check · same deal, 3 products live
Conventional
25% down · 7.5% · 30yr
- Down + closing
- —
- Monthly P&I
- —
- Monthly cashflow
- —
- DSCR
- —
- Eligible?
- —
Personal DTI + credit; lowest rate.
DSCR
20% down · 8.5% · 30yr
- Down + closing
- —
- Monthly P&I
- —
- Monthly cashflow
- —
- DSCR
- —
- Eligible?
- —
No personal income docs; deal must DSCR.
Hard money
10% down · 12.0% · 12mo
- Down + closing
- —
- Monthly P&I
- —
- Monthly cashflow
- —
- DSCR
- —
- Eligible?
- —
Short-term bridge; refi at stabilization.
Rent comps 37 comps
| Address | Beds | Baths | Sqft | Rent | $/sqft | DOM | Units | Dist |
|---|---|---|---|---|---|---|---|---|
| 2929 Routier Rd Sacramento, CA | 1.0–2.0 | 1.0–2.0 | 790 | $1,995 | $2.53 | 2d | 15 | 0.21mi |
| 2080 W La Loma Dr Rancho Cordova, CA | 1.0–2.0 | 1.0 | 650 | $1,645 | $2.53 | 17d | 3 | 0.44mi |
| 2725 El Parque Cir Unit A Rancho Cordova, CA | 2.0 | 1.0 | 800 | $1,495 | $1.87 | 43d | 1 | 0.44mi |
| 2850 La Loma Dr Rancho Cordova, CA | 2.0 | 1.0 | 920 | $1,800 | $1.96 | 7d | 1 | 0.49mi |
| 3250 Laurelhurst Dr Rancho Cordova, CA | 1.0–2.0 | 1.0–2.0 | 1015 | $2,275 | $2.24 | 1d | 6 | 0.50mi |
| 3329 Routier Rd Unit 3329 Sacramento, CA | 2.0 | 1.0 | 979 | $2,000 | $2.04 | 43d | 1 | 0.50mi |
| 10169 Crawford Way Sacramento, CA | 2.0 | 1.0 | 917 | $2,150 | $2.34 | 23d | 1 | 0.52mi |
| 2625 El Parque Cir Unit D Rancho Cordova, CA | 2.0 | 1.0 | 880 | $1,800 | $2.05 | 43d | 1 | 0.54mi |
| 10181 De Soto Way Unit 10181 Sacramento, CA | 2.0 | 1.0 | 917 | $1,950 | $2.13 | 3d | 1 | 0.56mi |
| 3226 Laurelhurst Dr Rancho Cordova, CA | 3.0 | 2.0 | 1008 | $1,900 | $1.88 | 23d | 1 | 0.56mi |
| 2961 Portsmouth Dr Unit 4 Rancho Cordova, CA | 2.0 | 1.5 | 900 | $1,650 | $1.83 | 12d | 1 | 0.58mi |
| 10281 Mills Station Rd Unit 12 Rancho Cordova, CA | 3.0 | 2.0 | 1100 | $2,200 | $2.00 | 4d | 1 | 0.58mi |
| 10108 Malaga Way Rancho Cordova, CA | 2.0 | 1.0 | 765 | $1,776 | $2.32 | 7d | 1 | 0.59mi |
| 10158 De Soto Way Sacramento, CA | 2.0 | 1.0 | 900 | $2,000 | $2.22 | 16d | 1 | 0.60mi |
| 10401 Rockingham Dr Rancho Cordova, CA | 1.0–2.0 | 1.0 | 714 | $1,450 | $2.03 | 7d | 6 | 0.61mi |
| 10136 Ellenwood Ave Sacramento, CA | 3.0 | 2.5 | 1418 | $2,375 | $1.67 | 43d | 1 | 0.66mi |
| 10421 El Mercado Dr Rancho Cordova, CA | 1.0–2.0 | 1.0 | 702 | $1,651 | $2.35 | 1d | 1 | 0.74mi |
| 9952 Vanguard Dr Sacramento, CA | 3.0 | 2.0 | 1168 | $2,450 | $2.10 | 12d | 1 | 0.80mi |
| 10407 White Rock Rd Unit B Rancho Cordova, CA | 2.0 | 1.0 | 1000 | $2,000 | $2.00 | 43d | 1 | 0.82mi |
| 3545 Mather Field Rd Rancho Cordova, CA | 2.0 | 1.0 | 604 | $1,775 | $2.94 | 1d | 5 | 0.90mi |
| 10240 S White Rock Rd Rancho Cordova, CA | 2.0 | 1.0 | 802 | $1,500 | $1.87 | 43d | 1 | 0.93mi |
| 10069 Lincoln Village Dr Sacramento, CA | 2.0 | 1.0 | 882 | $2,049 | $2.32 | 4d | 1 | 0.98mi |
| 3466 Data Dr Rancho Cordova, CA | 1.0–2.0 | 1.0–2.0 | 955 | $2,411 | $2.52 | 1d | 8 | 1.03mi |
| 10498 Mills Tower Dr Rancho Cordova, CA | 2.0 | 1.0 | 810 | $1,900 | $2.35 | 23d | 1 | 1.19mi |
| 3100 Explorer Dr Sacramento, CA | 3.0 | 2.0 | 1380 | $2,575 | $1.87 | 16d | 1 | 1.24mi |
| 10515 Mills Tower Dr Rancho Cordova, CA | 1.0–2.0 | 1.0 | 665 | $1,495 | $2.25 | 10d | 1 | 1.26mi |
| 9849 Lincoln Village Dr Unit A Sacramento, CA | 2.0 | 1.0 | 1100 | $1,995 | $1.81 | 43d | 1 | 1.32mi |
| 2830 Mills Park Dr Rancho Cordova, CA | 1.0–2.0 | 1.0 | 712 | $1,525 | $2.14 | 23d | 5 | 1.36mi |
| 10495 Malaga Way Rancho Cordova, CA | 3.0 | 2.0 | 1203 | $2,495 | $2.07 | 20d | 1 | 1.37mi |
| 9838 Lincoln Village Dr Sacramento, CA | 1.0–2.0 | 1.0–2.0 | 732 | $1,601 | $2.19 | 3d | 8 | 1.40mi |
| 2910 Weston Way Rancho Cordova, CA | 3.0 | 1.0 | 1098 | $2,460 | $2.24 | 10d | 1 | 1.40mi |
| 1200 Gary Way Carmichael, CA | 3.0 | 2.0 | 1414 | $2,495 | $1.76 | 14d | 1 | 1.43mi |
| 1111 McClaren Dr Carmichael, CA | 2.0 | 1.0 | 1440 | $2,335 | $1.62 | 10d | 1 | 1.45mi |
| 10524 Croetto Way Rancho Cordova, CA | 2.0 | 1.0 | 926 | $1,400 | $1.51 | 4d | 1 | 1.46mi |
| 10524 Croetto Way Unit 1 Rancho Cordova, CA | 2.0 | 1.0 | 926 | $1,500 | $1.62 | 23d | 1 | 1.46mi |
| 3600 Kobias Ct Sacramento, CA | 3.0 | 2.0 | 1257 | $2,650 | $2.11 | 23d | 1 | 1.46mi |
| 2643 Furmint Way Unit 3 Rancho Cordova, CA | 2.0 | 1.0 | 946 | $1,695 | $1.79 | 43d | 1 | 1.50mi |
Listing history 4 events
-
2026-06-03days on market $168,000 Active 90 DOM
-
2026-06-02days on market $168,000 Active 89 DOM
-
2026-06-01days on market $168,000 Active 88 DOM
-
2026-05-31days on market $168,000 Active 87 DOM
ⓘ Source: listings_history table (triggers on properties + properties_extension) + one-shot
backfill from property_details.listing_events for pre-trigger history.
Climate risk First Street
- Flood 1/10 Low FEMA zone X (unshaded) · 0% chance over 30 yrs
- Wildfire 4/10 Moderate
- Heat 7/10 Severe 6 d/yr ≥102°F today · 13 d/yr by 30 yrs out
- Wind 1/10 Low
- Air quality 10/10 Extreme 33 unhealthy d/yr today · 35 by 30 yrs out
Nearby sold comps map
Loading sold comps map…
Walkable amenities ~0.75 mi
Loading nearby amenities…
Taxation est. · year 1
- Rental income
- $24,153
- − Mortgage interest
- −$9,411
- − Property taxes
- −$2,520
- − Insurance
- −$840
- − Repairs & maintenance
- −$1,932
- − Management
- −$1,932
- − Depreciation
- −$4,887
- Taxable income
- $2,631
- Est. tax owed @ 24.0%
- −$631
- After-tax cash flow
- $4,517/yr
For passive investors: Depreciation is non-cash, so a rental often shows a tax loss while cash-flowing — sheltering income. Rental losses are passive: they offset passive income freely, and up to $25,000/yr can offset ordinary (W-2) income if you actively participate and your MAGI is under $100k (phasing out to $0 by $150k); unused losses carry forward. On sale, claimed depreciation is recaptured at up to 25%, and gains may owe capital-gains tax (a 1031 exchange can defer both). Figures are a year-1 estimate at your 24.0% rate — not tax advice; consult a CPA.
Condition & rehab AI · 4 photos
This move-in ready manufactured home has been fully renovated with new kitchen, bathrooms, siding, windows, flooring, and landscaping, making it an excellent investment opportunity.
Value-add opportunities
- Both Landscaping improvements — Enhances curb appeal and low-maintenance care.
- Both Interior updates — Fresh paint and new fixtures improve aesthetics and functionality.
- Both Kitchen and bathroom upgrades — Modern appliances and fixtures attract more buyers and renters.
- Both HVAC and mechanical system maintenance — Ensures comfort and energy efficiency, reducing utility costs and improving property value.
- Both Patio and landscaping maintenance — Keeps the property looking well-maintained and attractive to potential buyers and renters.
Renovation cost estimate screening
Value-add ROI direction
- Both Landscaping improvements — Enhances curb appeal and low-maintenance care. ↑
- Both Interior updates — Fresh paint and new fixtures improve aesthetics and functionality. ↑
- Both Kitchen and bathroom upgrades — Modern appliances and fixtures attract more buyers and renters. ↑
- Both HVAC and mechanical system maintenance — Ensures comfort and energy efficiency, reducing utility costs and improving property value. ↑
- Both Patio and landscaping maintenance — Keeps the property looking well-maintained and attractive to potential buyers and renters. ↑
ⓘ Cost ranges are severity-bucket heuristics (US national rule-of-thumb). Get contractor quotes + a written scope before underwriting a rehab budget.
Schools (NCES district)
- District
- Sacramento City Unified
- NCES district ID
- 0633840
- Math proficiency
- 32% ▬ 0.00%
- Reading proficiency
- 43% ▲ 3.00%
- Median HH income
- $49,280
- Composite
- 34.86/100
- National rank
- #10000
- State rank
- #804 of 1400 in CA
Livability — Rancho Cordova
- Score
- 68/100
- State rank
- #268
- US rank
- #9126
Category grades
Schools grade is shown separately in the Schools card above.
Census & demographics
- Census place
- Rancho Cordova, CA
- County
- Sacramento County · 1,539,646 people
- City population
- 98,329
- Metro
- Sacramento-Roseville-Folsom, CA
- Population (ZIP)
- 21,742
- Household income
- $85,841
- Rent vs Own
- Severe rent burden
- 949.0
Population outlook (Sacramento County) Hauer SSP2
- Today (2025)
- 1,660,763 people
- By 2030
- 1,732,990 · +4.3%
- By 2040
- 1,855,755 · +11.7%
- By 2050
- 1,941,335 · +16.9%
- By 2075
- 2,046,162 · +23.2%
- By 2100
- 1,961,444 · +18.1%
Race, ethnicity, and origin ACS 2023
- Neighborhood character
- Diverse neighborhood (Simpson 0.69)
- Race & ethnicity
- White 47% Hispanic / Latino 24% Black 13% Two or more races 12% Asian 10% Native American 1%
- Hispanic origin (detail)
- Mexican 19%
- Common ancestry
- Subsaharan African 5% Italian 2% Scotch-Irish 2%
- Foreign-born
- 22% · Canada, Vietnam, South Korea
- Languages at home
- 67% English-only · Spanish 14% Russian/Polish/Slavic 10% Other Indo-European 3%
Political lean MEDSL · Sacramento
- 2024 margin
- D (+19.7) · D 58.1% · R 38.4% · Other 3.5%
- 2008→2024 swing
- +0.7pp no change · 2008: 19.0pp · 2024: 19.7pp
- All cycles
- 2024: D+19.7 2020: D+25.3 2016: D+23.7 2012: D+16.3 2008: D+19.0
Not yet ingested
- Civics
- —
Market trends
- HPI YoY
- ▼ -223.22%
- Current HPI
- 349.4168
- Rent YoY
- ▲ 2.41%
- Metro
- Sacramento-Roseville-Folsom, CA
- State GDP YoY
- ▲ 3.21%
- F500 in state
- 116
Industry mix (Fortune 500 HQ in CA)
| Industry | F500 HQs | Revenue |
|---|---|---|
| Technology | 27 | $1,492B |
|
||
| Financial Services | 3 | $174B |
|
||
| Retail | 3 | $44B |
|
||
| Insurance | 3 | $26B |
|
||
| Media / Entertainment | 2 | $115B |
|
||
| Pharmaceuticals / Biotech | 2 | $62B |
|
||
Cash-flow waterfall
monthlySold comps — $/sqft
last 12 mo · ≤1 miLoading sold comps…