136 E Florida St · Holbrook, AZ
Flood risk 1/10 · Minimal
- FEMA flood zone
- X
- Chance of flooding over 30 yrs
- 0.0%
- Est. flood insurance / yr
- $507 – $1,088
Fire risk 1/10 · Minimal
- Est. fire insurance / yr
- $610 – $1,132
Heat risk 5/10 · Moderate
- Hot days now (above 96°F)
- 6 days/yr
- Hot days in 30 yrs
- 16 days/yr
Wind risk 1/10 · Minimal
- Chance of severe wind over 30 yrs
- —
Air-quality risk 1/10 · Minimal
- Unhealthy air days now
- 0 days/yr
- Unhealthy air days in 30 yrs
- 0 days/yr
Risk factors via First Street. Map © Google.
Why this score? — see what drove the B+ grade
The composite is a weighted blend of 9 inputs, each scored 0–100. Each bar is that input's sub-score; the figure is the points it added to the 100-point composite (weight × sub-score).
- Cash flow +30.0/30.0
- DSCR +10.0/10.0
- 1% rule +9.5/10.0
- Appreciation +9.0/10.0
- ARV discount +7.5/15.0
- Livability +3.4/5.0
- Rent growth +2.5/5.0
- Condition / age +2.5/5.0
- Schools +1.7/10.0
$55,000
🖨 Deal sheet 📄 Offer letter ✓ Due diligence
Listing remarks
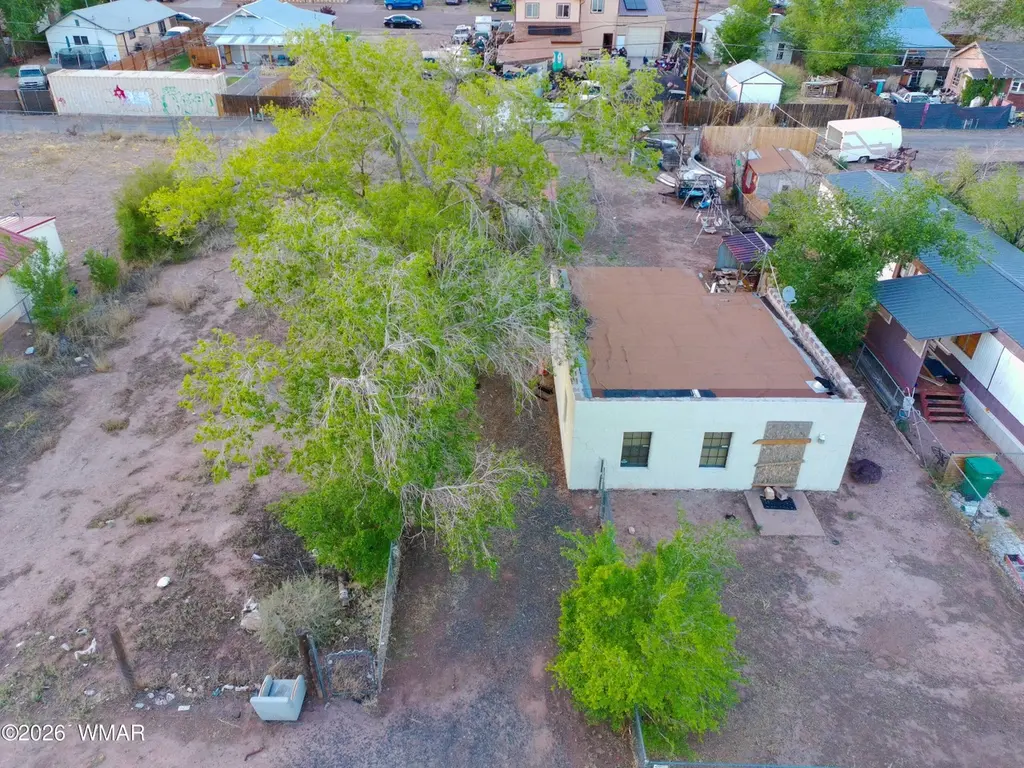
This unique property offers a rare opportunity with 2 lots both an empty, buildable lot and a gutted single-family home, providing the perfect foundation for your next project. Whether you're looking to owner occupy or explore investment potential, this property has both. Ideally located in the heart of downtown Holbrook, you'll enjoy convenient access to local amenities including the library, park & school. The central location adds to the appeal, making it a great option for homeowners and investors alike. The existing structure has already been taken down to its core, saving you time on demolition and giving you a true blank slate to bring your vision to life. In addition, the sepa
Key facts
- Blank slate
- Buildable lot
- Expansion potential
Tags
Property features AI
Finance
- Other: Approximate lot size 0.32 acres; Property type code A; Land lease: No; Directions: Navajo Blvd. to East onto E Florida to property on north side
- HOA & community: No HOA
Exterior
- Utilities: City water (metered by City of Holbrook); Public sewer; Water available; Sewer available; Power available
- Home design: Site-built property; Subdivision: Clark ADDN
- Construction: Slab foundation; Flat roof
- Exterior features: Chain link fence; Private adjoining property; City-maintained road access
Interior
- Flooring: Concrete
- Heating & cooling: No heating
- Interior features: Concrete floors; No fireplace
Neighborhood map
What this means for you Summary
Snapshot
- This is a 2-bed/1.0-bath single-family listed at $55k.
Deal economics
- At list price, monthly cash flow is $297 ($4k/yr) — positive.
- The deal already cash-flows at list — no discount required.
- Meets the 1% rule at list price ($800 rent vs $55k).
- Recommended offer: $53k (3.0% below list) — sets the bar for market timing.
Location & tenants
- Location reads 68/100 on livability (#57 in AZ) — a middle-class / working-renter tenant base. Strengths: cost of living A+, housing A+, health & safety A+; Watch: schools C-, employment D+, crime D-.
- Holbrook Unified District (4389) (town): math 16% / reading 25% proficiency, ranked #185 of 249 in AZ (top 74%) — low school quality limits family demand, transient renter base, plan for 1-2y turnover; 67% free/reduced lunch — lower-income household profile, screen leases tightly.
- Market conditions: 45 active listings in the ZIP; 1 comparable units currently listed for rent nearby; 485 units permitted in Navajo County in 2024 (11 in 5+ unit buildings).
Forward outlook
- In year one you build about $5k of equity ($380 loan paydown + $4k appreciation (8.0% local appreciation)).
- Navajo County population projected at -16% by 2050 — secular population decline; favor cash flow + early exit over multi-decade hold.
- At projected returns (8.0% appreciation + 3.0% rent growth), your $15k cash investment doubles in ~2 years — after that, you're playing with house money.
- By year 7, paydown + projected appreciation supports a ~$33k cash-out refi (75% LTV) — recoverable capital for the next deal without selling this one.
Negotiation context
- It's been on market 39 days — a 3% lower offer ($53k) is reasonable based on typical stale-listing flexibility.
- Current owner paid $37k; 49% above their basis — modest negotiation headroom, anchor on the comps not their cost.
Risks & watch-outs
- Watch-outs: built in 1958 — expect roof / HVAC / electrical / plumbing capex.
- Climate carrying-cost: extreme-heat days projected 6→16/yr by 2055 (HVAC capex compounding) — expect insurance premiums to compound above CPI over the hold.
Questions for the listing agent
- It's been on market 39 days. Have you received any prior offers? Is the seller open to a 3% concession, seller financing, or rate buy-down credit?
- Built in 1958 — when were the roof, HVAC, electrical panel, plumbing, and water heater last replaced?
- Is there a deadline driving the sale (1031 exchange, divorce, estate, relocation)? That informs how much negotiation room exists.
- Crime grade is D in this area — have there been break-ins, vandalism, or insurance claims at this property in the last 3 years? What carrier currently insures it and at what premium?
- What's the average days-on-market for RENTAL listings here right now (not sales)? A rising rental-DOM trend means longer vacancies and softer asking-rent achievability than the comps imply.
- What's the recent tenant-quality profile in this submarket — average credit score on applications, eviction rate, late-payment / NSF rate, and stable-employment percentage? A property-management company in the area should have these aggregated.
- How much new for-sale + rental construction is in the pipeline within 1–3 miles? Heavy new supply typically softens prices + rents 12–24 months out; constrained supply supports both.
Investment metrics
- 1% rule
- 1.45% ✓
- Cap rate
- 12.78%
- Cash-on-cash
- 23.17%
- DSCR
- 2.03
- GRM
- 5.7
CMA / ARV
No comps found within radius.
Projected returns pro-forma
8.03% appreciation · 3.0% rent growth · sell at horizon
- IRR
- 38.4%
- Equity multiple
- 3.71×
- Total profit
- $41,687
- Equity at exit
- $41,898
- IRR
- 34.2%
- Equity multiple
- 7.94×
- Total profit
- $106,848
- Equity at exit
- $83,274
Cash invested: $15,400 (down + closing). Projections, not guarantees.
Landlord ↔ Tenant lean methodology
- Overall (STATE)
- 87 Strongly Landlord-Friendly
- State Arizona
- 87 Strongly Landlord-Friendly · R+3
- County
- — inherits STATE
- City
- — inherits STATE
ZIP-level market 86025
- Home prices YoY
- 2.9%
- Active inventory
- 45
- Price-to-rent
- 5.7×
Monthly cashflow live
- Estimated rent
- $800 medium interval (Pro) →
- Mortgage (P&I)
- −$288
- Tax from tax record
- −$23 /mo · $279/yr
- Insurance
- −$23
- HOA
- −$0
- Vacancy / Maint / Mgmt
- −$168
- Net cashflow
- $297
Break-even live
UW: 25.0% down · 7.5% · 30yr · 1.5% tax · 5.0% vac · 8.0% maint · 8.0% mgmt
Financing live
Cash to close
- Down payment
- $13,750
- Closing costs
- $1,650
- Reserves months
- —
- Total cash needed
- —
Loan-product check · same deal, 3 products live
Conventional
25% down · 7.5% · 30yr
- Down + closing
- —
- Monthly P&I
- —
- Monthly cashflow
- —
- DSCR
- —
- Eligible?
- —
Personal DTI + credit; lowest rate.
DSCR
20% down · 8.5% · 30yr
- Down + closing
- —
- Monthly P&I
- —
- Monthly cashflow
- —
- DSCR
- —
- Eligible?
- —
No personal income docs; deal must DSCR.
Hard money
10% down · 12.0% · 12mo
- Down + closing
- —
- Monthly P&I
- —
- Monthly cashflow
- —
- DSCR
- —
- Eligible?
- —
Short-term bridge; refi at stabilization.
Rent comps 1 comps
| Address | Beds | Baths | Sqft | Rent | $/sqft | DOM | Units | Dist |
|---|---|---|---|---|---|---|---|---|
| 357 1st Ave Holbrook, AZ | 1.0 | 1.0 | 512 | $800 | $1.56 | 21d | 1 | 0.34mi |
Listing history 20 events
-
2026-06-19days on market $55,000 Active 39 DOM
-
2026-06-18days on market $55,000 Active 38 DOM
-
2026-06-17price $55,000 Active 37 DOM
-
2026-06-17days on market $59,000 Active 37 DOM
-
2026-06-16days on market $59,000 Active 36 DOM
-
2026-06-15days on market $59,000 Active 35 DOM
-
2026-06-14days on market $59,000 Active 33 DOM
-
2026-06-12days on market $59,000 Active 32 DOM
-
2026-06-09days on market $59,000 Active 29 DOM
-
2026-06-08days on market $59,000 Active 28 DOM
-
2026-06-07days on market $59,000 Active 27 DOM
-
2026-06-05days on market $59,000 Active 25 DOM
-
2026-06-04days on market $59,000 Active 23 DOM
-
2026-06-02days on market $59,000 Active 22 DOM
-
2026-06-01days on market $59,000 Active 21 DOM
-
2026-05-31days on market $59,000 Active 20 DOM
-
2026-05-31days on market $59,000 Active 19 DOM
-
2026-05-12$59,000 Active 791-char remark
-
2012-10-31soldstatus $37,000
-
2010-04-23soldstatus $22,000
ⓘ Source: listings_history table (triggers on properties + properties_extension) + one-shot
backfill from property_details.listing_events for pre-trigger history.
Tax reassessment forecast AZ · Resets to sale price
- Current annual tax
- $279 · $23/mo
- Projected year-2 tax
- $363 · $30/mo
- Expected delta
- +$84/yr (+$7/mo · 29.9%)
ⓘ Screening estimate from a state-policy table — verify with the county assessor before closing.
Climate risk First Street
- Flood 1/10 Low FEMA zone X · 0% chance over 30 yrs
- Wildfire 1/10 Low
- Heat 5/10 Major 6 d/yr ≥96°F today · 16 d/yr by 30 yrs out
- Wind 1/10 Low
- Air quality 1/10 Low 0 unhealthy d/yr today · 0 by 30 yrs out
Nearby sold comps map
Loading sold comps map…
Walkable amenities ~0.75 mi
Loading nearby amenities…
Taxation est. · year 1
- Rental income
- $9,600
- − Mortgage interest
- −$3,081
- − Property taxes
- −$279
- − Insurance
- −$275
- − Repairs & maintenance
- −$768
- − Management
- −$768
- − Depreciation
- −$1,600
- Taxable income
- $2,829
- Est. tax owed @ 24.0%
- −$679
- After-tax cash flow
- $2,890/yr
For passive investors: Depreciation is non-cash, so a rental often shows a tax loss while cash-flowing — sheltering income. Rental losses are passive: they offset passive income freely, and up to $25,000/yr can offset ordinary (W-2) income if you actively participate and your MAGI is under $100k (phasing out to $0 by $150k); unused losses carry forward. On sale, claimed depreciation is recaptured at up to 25%, and gains may owe capital-gains tax (a 1031 exchange can defer both). Figures are a year-1 estimate at your 24.0% rate — not tax advice; consult a CPA.
Schools (NCES district)
- District
- Holbrook Unified District (4389)
- NCES district ID
- 0403820
- Math proficiency
- 16% ▼ -13.00%
- Reading proficiency
- 25% ▼ -10.00%
- Median HH income
- $34,437
- Composite
- 16.81/100
- National rank
- #9153
- State rank
- #185 of 249 in AZ
Livability — Holbrook
- Score
- 68/100
- State rank
- #57
- US rank
- #9938
Category grades
Schools grade is shown separately in the Schools card above.
Census & demographics
- Census place
- Holbrook, AZ
- Population (ZIP)
- 5,189
Population outlook (Navajo County) Hauer SSP2
- Today (2025)
- 105,760 people
- By 2030
- 103,301 · -2.3%
- By 2040
- 97,070 · -8.2%
- By 2050
- 88,850 · -16.0%
- By 2075
- 65,180 · -38.4%
- By 2100
- 37,281 · -64.7%
Race, ethnicity, and origin ACS 2023
- Neighborhood character
- Highly diverse neighborhood (Simpson 0.81)
- Race & ethnicity
- Native American 33% White 33% Hispanic / Latino 29% Two or more races 7% Black 4%
- Hispanic origin (detail)
- Mexican 20% Puerto Rican 3%
- Common ancestry
- Lithuanian 4% Serbian 3% Slovak 2%
- Foreign-born
- 2% · Canada
- Languages at home
- 73% English-only · Spanish 11% Chinese 1% German/W. Germanic 1%
Political lean MEDSL · Navajo
- 2024 margin
- R (+17.2) · D 40.9% · R 58.1%
- 2008→2024 swing
- -5.5pp toward R · 2008: -11.7pp · 2024: -17.2pp
- All cycles
- 2024: R+17.2 2020: R+8.2 2016: R+7.9 2012: R+8.4 2008: R+11.7
Not yet ingested
- Civics
- —
Market trends
- HPI YoY
- ▲ 8.03%
- Current HPI
- 281.0415
- Rent YoY
- —
- Metro
- —
- State GDP YoY
- ▲ 4.54%
- F500 in state
- 20
Industry mix (Fortune 500 HQ in AZ)
| Industry | F500 HQs | Revenue |
|---|---|---|
| Technology | 2 | $13B |
|
||
| Mining / Metals | 1 | $23B |
|
||
| Environmental Services | 1 | $16B |
|
||
| Metals / Steel | 1 | $14B |
|
||
| Technology Distribution | 1 | $9B |
|
||
| Homebuilding | 1 | $8B |
|
||
Price history
+150.0% since first listed4 events — show timeline
- 2026-06-17 Price Changed $55,000 WMMLS
- 2026-05-12 Listed $59,000 WMMLS
- 2012-10-31 Sold (Public Records) $37,000 Public Records
- 2010-04-23 Sold (Public Records) $22,000 Public Records
Property tax history
+5.1%/yrLatest (2025): $279 · +5.0% YoY. Source: county tax records.
Cash-flow waterfall
monthlySold comps — $/sqft
last 12 mo · ≤1 miLoading sold comps…