 🏗️ New Construction
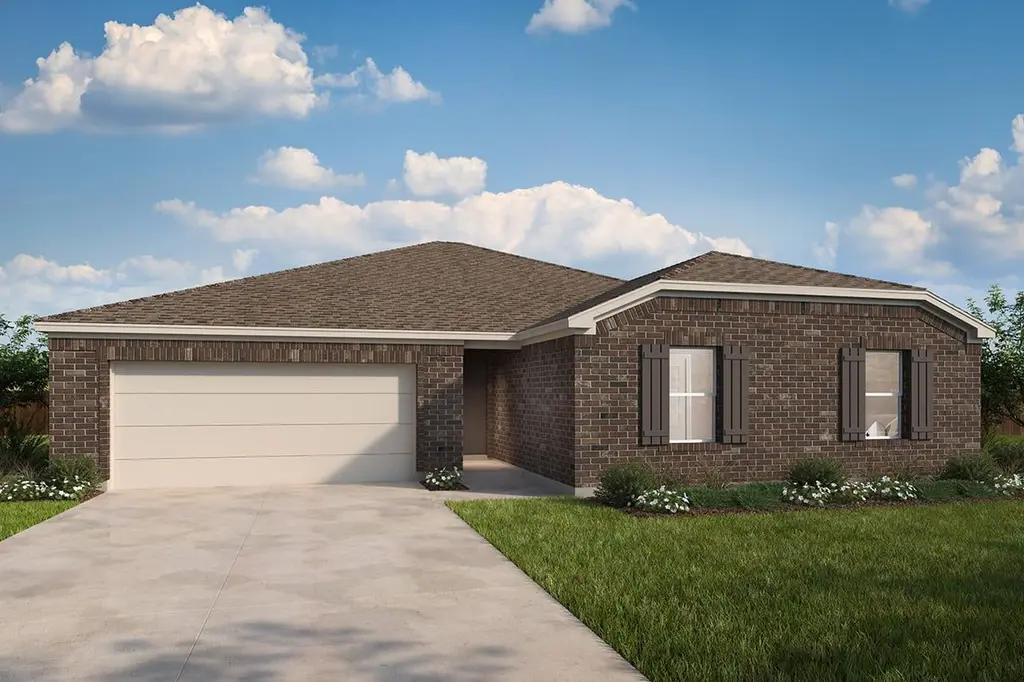
Plan 2062 Plan · Rosenberg, TX
Flood risk 3/10 · Minor
- FEMA flood zone
- X (unshaded)
- Chance of flooding over 30 yrs
- 0.17%
- Est. flood insurance / yr
- $507 – $1,088
Fire risk 3/10 · Minor
- Est. fire insurance / yr
- $1,222 – $2,270
Heat risk 9/10 · Severe
- Hot days now (above 110°F)
- 7 days/yr
- Hot days in 30 yrs
- 23 days/yr
Wind risk 9/10 · Severe
- Chance of severe wind over 30 yrs
- 99.0%
Air-quality risk 2/10 · Minimal
- Unhealthy air days now
- 1 days/yr
- Unhealthy air days in 30 yrs
- 1 days/yr
Risk factors via First Street. Map © Google.
Why this score? — see what drove the D+ grade
The composite is a weighted blend of 9 inputs, each scored 0–100. Each bar is that input's sub-score; the figure is the points it added to the 100-point composite (weight × sub-score).
- Cash flow +16.1/30.0
- ARV discount +7.5/15.0
- DSCR +5.0/10.0
- Schools +4.6/10.0
- 1% rule +4.4/10.0
- Condition / age +3.8/5.0
- Livability +3.1/5.0
- Rent growth +2.3/5.0
- Appreciation +0.0/10.0
$274,995
🖨 Deal sheet (PDF) 📄 Offer letter ✓ Due diligence
Listing remarks MLS
* Kitchen island * Den * Extra storage space * Walk-in closet at primary suite * Dual-sink vanity at primary bath * Smart thermostat * 5-panel interior doors * Granite kitchen countertops * Kitchen USB charging port * Low-E windows * Open floor plan * ENERGY STAR® certified home * Close to family friendly parks * Planned park * Commuter-friendly location * Planned pavilion * Close to popular restaurants * Great shopping nearby
Key facts
- Open floor plan
- Low-e windows
- Kitchen island
Tags
Neighborhood map
What this means for you Summary
Snapshot
- This is a 4-bed/2.0-bath single-family listed at $275k. Condition is rated good.
Deal economics
- At list price, monthly cash flow is $137 ($2k/yr) — positive.
- The deal already cash-flows at list — no discount required.
- To meet the 1% rule (rent ≥ 1% of price), the offer needs to be $249k (9.3% below list).
- Recommended offer: $249k (9.3% below list) — sets the bar for 1% rule.
- Cap rate 6.9% vs local median 3.4% in Rosenberg — top-decile yield for the area; either an underpriced asset or a hidden risk that comps aren't pricing in. Stress-test before assuming the spread holds.
Location & tenants
- Location reads 62/100 on livability (#922 in TX) — a middle-class / working-renter tenant base. Strengths: cost of living A+, housing A+, crime B; Watch: amenities F, commute F, health & safety F.
- Lamar CISD (suburban): math 50% / reading 53% proficiency, ranked #116 of 826 in TX (top 14%) — acceptable for families but not a draw, mixed tenant base, ~2y average lease.
- Zoned schools: Meyer El (math 25% / reading 22%, grade F, #3,247 of 4,322 statewide, top 76%, 704 students, 74% FRL); George J H (math 27% / reading 28%, grade F, #1,156 of 1,662 statewide, top 71%, 1,173 students, 81% FRL); B F Terry H S (math 34% / reading 41%, grade F, #888 of 1,632 statewide, top 55%, 1,739 students, 74% FRL) — zoned schools average 76% FRL vs 43% district-wide (34 pts higher); higher-poverty schools than district average — tighter screening recommended.
- Zoned-school proficiency averages 30% at this address vs 52% district-wide (-22 pts) — the specific schools serving this property underperform the Lamar CISD average; the district grade overstates school quality for this exact location.
- Market conditions: Rents soft (-1.0%/yr); 728 active listings in the ZIP; 3 comparable units currently listed for rent nearby; rentals at typical pace (median 15d on market — plan ~3-4 weeks tenant-placement turnaround); 12,093 units permitted in Fort Bend County in 2024 (815 in 5+ unit buildings).
- This rent runs 41% of the median local income ($73k/yr) — at the standard rent-burdened threshold; future hikes will face affordability resistance.
Forward outlook
- Local home prices are declining (-3.0%/yr); year-one equity from $2k of loan paydown is wiped out by about $8k of value loss. Plan a longer hold.
- Fort Bend County population projected at +75% by 2050 — long-run rental-demand tailwind backs the buy-and-hold thesis.
Negotiation context
- It's been on market 74 days — a 6% lower offer ($258k) is reasonable based on typical stale-listing flexibility.
Risks & watch-outs
- Climate carrying-cost: severe wind risk, 99% chance of damaging wind over 30y; extreme-heat days projected 7→23/yr by 2055 (HVAC capex compounding) — expect insurance premiums to compound above CPI over the hold.
Questions for the listing agent
- It's been on market 74 days. Have you received any prior offers? Is the seller open to a 9% concession, seller financing, or rate buy-down credit?
- Why hasn't it sold? Are there any deal-killer items the seller is aware of (foundation, flood, title, zoning, code violations)?
- Is there a deadline driving the sale (1031 exchange, divorce, estate, relocation)? That informs how much negotiation room exists.
- Schools are D-rated, which usually means shorter tenancies and higher turnover. Who's the typical renter profile here, and what's been the actual vacancy rate?
- The area grade is low — what's the realistic commute time and amenity access for the typical tenant pool here? Any planned neighborhood developments (good or bad) we should know about?
- What's the average days-on-market for RENTAL listings here right now (not sales)? A rising rental-DOM trend means longer vacancies and softer asking-rent achievability than the comps imply.
- What's the recent tenant-quality profile in this submarket — average credit score on applications, eviction rate, late-payment / NSF rate, and stable-employment percentage? A property-management company in the area should have these aggregated.
- How much new for-sale + rental construction is in the pipeline within 1–3 miles? Heavy new supply typically softens prices + rents 12–24 months out; constrained supply supports both.
Investment metrics
- 1% rule
- 0.94% ✗
- Cap rate
- 6.91%
- Cash-on-cash
- 2.21%
- DSCR
- 1.10
- GRM
- 8.9
CMA / ARV
- ARV (median comp)
- $265,212
- List price
- $274,995
- Delta
- 3.69%
- Verdict
- FAIR
- Comps
- 20 within 1.0 mi
Show comp detail 12 sales within ~0.75 mi
| Address | Dist | Beds/Ba | Sqft | Sold | Price | $/sf | Match |
|---|---|---|---|---|---|---|---|
| 2003 Beach Bluff Rd | 0.11mi | 3/2.5 (-1) | 2,027 (-2%) | 2mo | $275,000 | $136 | 84 |
| 4810 Seabourne Landing Dr | 0.51mi | 4/3.0 | 2,009 (-3%) | 8mo | $324,900 | $162 | 62 |
| 4911 Arbury Hill Ln | 0.42mi | 4/2.5 | 2,157 (+5%) | 13mo | $329,000 | $153 | 60 |
| 4711 Bartagrass Dr | 0.58mi | 4/3.0 | 2,021 (-2%) | 10mo | $335,000 | $166 | 57 |
| 4610 Monarch Bend Ln | 0.66mi | 3/2.0 (-1) | 1,928 (-6%) | 3mo | $309,000 | $160 | 51 |
| 4918 Jagged Cliff Ln | 0.51mi | 3/2.0 (-1) | 1,862 (-10%) | 6mo | $247,000 | $133 | 50 |
| 4622 Seabourne Landing Dr | 0.68mi | 3/2.0 (-1) | 1,915 (-7%) | 3mo | $299,900 | $157 | 49 |
| 4910 Pacific Ridge Ln Ln | 0.56mi | 3/2.0 (-1) | 1,882 (-9%) | 9mo | $285,000 | $151 | 47 |
| 1818 Cardinal Sky Way | 0.70mi | 4/2.0 | 2,251 (+9%) | 6mo | $306,000 | $136 | 47 |
| 2514 Golden Brandy Ln | 0.61mi | 4/2.0 | 1,842 (-11%) | 12mo | $267,000 | $145 | 44 |
| 2122 Bluegrass Dr | 0.51mi | 3/2.0 (-1) | 1,876 (-9%) | 19mo | $329,990 | $176 | 40 |
| 4703 Seabourne Landing Dr | 0.64mi | 3/2.0 (-1) | 1,915 (-7%) | 19mo | $324,999 | $170 | 38 |
Match score weights: distance 35% · size 25% · config 20% · recency 20%. Top-matched comps best support the ARV.
Projected returns pro-forma
-3.0% appreciation · 0.0% rent growth · sell at horizon
- IRR
- -16.2%
- Equity multiple
- 0.44×
- Total profit
- $-41,541
- Equity at exit
- $39,544
- IRR
- -14.4%
- Equity multiple
- 0.29×
- Total profit
- $-53,049
- Equity at exit
- $22,931
Cash invested: $74,259 (down + closing). Projections, not guarantees.
Landlord ↔ Tenant lean methodology
- Overall (STATE)
- 87 Strongly Landlord-Friendly
- State Texas
- 87 Strongly Landlord-Friendly · R+5
- County
- — inherits STATE
- City
- — inherits STATE
ZIP-level market 77471
- Home prices YoY
- -19.3%
- Rents YoY
- -1.0%
- Active inventory
- 728
- Price-to-rent
- 9.2×
Monthly cashflow live
- Estimated rent
- $2,493 medium interval (Pro) →
- Mortgage (P&I)
- −$1,391
- Tax est. 1.5%
- −$332 /mo · $3,978/yr
- Insurance
- −$111
- HOA
- −$0
- Vacancy / Maint / Mgmt
- −$524
- Net cashflow
- $137
Break-even live
Sensitivity live
| Price | -10% $320 | -5% $228 | +0% $137 | +5% $45 | +10% $-47 |
|---|---|---|---|---|---|
| Rent | -10% $-60 | -5% $38 | +0% $137 | +5% $235 | +10% $334 |
| Rate | -1.0pp $270 | -0.5pp $204 | base $137 | +0.5pp $68 | +1.0pp $-2 |
UW: 25.0% down · 7.5% · 30yr · 1.5% tax · 5.0% vac · 8.0% maint · 8.0% mgmt
Financing live
Cash to close
- Down payment
- $66,303
- Closing costs
- $7,956
- Reserves months
- —
- Total cash needed
- —
Loan-product check · same deal, 3 products live
Conventional
25% down · 7.5% · 30yr
- Down + closing
- —
- Monthly P&I
- —
- Monthly cashflow
- —
- DSCR
- —
- Eligible?
- —
Personal DTI + credit; lowest rate.
DSCR
20% down · 8.5% · 30yr
- Down + closing
- —
- Monthly P&I
- —
- Monthly cashflow
- —
- DSCR
- —
- Eligible?
- —
No personal income docs; deal must DSCR.
Hard money
10% down · 12.0% · 12mo
- Down + closing
- —
- Monthly P&I
- —
- Monthly cashflow
- —
- DSCR
- —
- Eligible?
- —
Short-term bridge; refi at stabilization.
Rent comps 3 comps
| Address | Beds | Baths | Sqft | Rent | $/sqft | DOM | Units | Dist |
|---|---|---|---|---|---|---|---|---|
| 5026 Manor Stone Ln Richmond, TX | 3.0 | 2.0 | 1557 | $1,781 | $1.14 | 14d | 1 | 0.34mi |
| 4516 Bartagrass Dr Richmond, TX | 4.0 | 2.0 | 2160 | $3,850 | $1.78 | 45d | 1 | 0.68mi |
| 930 Salado Slough Ln Rosenberg, TX | 4.0 | 2.5 | 2427 | $2,149 | $0.89 | 4d | 1 | 1.47mi |
Listing history 19 events
-
2026-06-21days on market $274,995 Active 74 DOM
-
2026-06-18days on market $274,995 Active 71 DOM
-
2026-06-17days on market $274,995 Active 70 DOM
-
2026-06-16days on market $274,995 Active 69 DOM
-
2026-06-15days on market $274,995 Active 68 DOM
-
2026-06-13days on market $274,995 Active 66 DOM
-
2026-06-10days on market $274,995 Active 62 DOM
-
2026-06-08days on market $274,995 Active 61 DOM
-
2026-06-07pricedays on market $274,995 Active 60 DOM
-
2026-06-04days on market $284,995 Active 57 DOM
-
2026-06-03days on market $284,995 Active 56 DOM
-
2026-06-02days on market $284,995 Active 55 DOM
-
2026-06-01days on market $284,995 Active 54 DOM
-
2026-05-31days on market $284,995 Active 53 DOM
-
2026-05-16price $284,995 469-char remark
Show marketing remark (469 chars)
* Kitchen island * Den * Extra storage space * Walk-in closet at primary suite * Dual-sink vanity at primary bath * Smart thermostat * 5-panel interior doors * Granite kitchen countertops * Kitchen USB charging port * Low-E windows * Open floor plan * ENERGY STAR® certified home * Close to family friendly parks * Planned park * Commuter-friendly location * Planned pavilion * Close to popular restaurants * Great shopping nearby
-
2026-05-12price $281,995 469-char remark
Show marketing remark (469 chars)
* Kitchen island * Den * Extra storage space * Walk-in closet at primary suite * Dual-sink vanity at primary bath * Smart thermostat * 5-panel interior doors * Granite kitchen countertops * Kitchen USB charging port * Low-E windows * Open floor plan * ENERGY STAR® certified home * Close to family friendly parks * Planned park * Commuter-friendly location * Planned pavilion * Close to popular restaurants * Great shopping nearby
-
2026-04-28price $289,995 469-char remark
Show marketing remark (469 chars)
* Kitchen island * Den * Extra storage space * Walk-in closet at primary suite * Dual-sink vanity at primary bath * Smart thermostat * 5-panel interior doors * Granite kitchen countertops * Kitchen USB charging port * Low-E windows * Open floor plan * ENERGY STAR® certified home * Close to family friendly parks * Planned park * Commuter-friendly location * Planned pavilion * Close to popular restaurants * Great shopping nearby
-
2026-04-15price $298,995 469-char remark
Show marketing remark (469 chars)
* Kitchen island * Den * Extra storage space * Walk-in closet at primary suite * Dual-sink vanity at primary bath * Smart thermostat * 5-panel interior doors * Granite kitchen countertops * Kitchen USB charging port * Low-E windows * Open floor plan * ENERGY STAR® certified home * Close to family friendly parks * Planned park * Commuter-friendly location * Planned pavilion * Close to popular restaurants * Great shopping nearby
-
2026-04-08$313,995 Active 469-char remark
Show marketing remark (469 chars)
* Kitchen island * Den * Extra storage space * Walk-in closet at primary suite * Dual-sink vanity at primary bath * Smart thermostat * 5-panel interior doors * Granite kitchen countertops * Kitchen USB charging port * Low-E windows * Open floor plan * ENERGY STAR® certified home * Close to family friendly parks * Planned park * Commuter-friendly location * Planned pavilion * Close to popular restaurants * Great shopping nearby
ⓘ Source: listings_history table (triggers on properties + properties_extension) + one-shot
backfill from property_details.listing_events for pre-trigger history.
Climate risk First Street
- Flood 3/10 Moderate FEMA zone X (unshaded) · 17% chance over 30 yrs
- Wildfire 3/10 Moderate
- Heat 9/10 Extreme 7 d/yr ≥110°F today · 23 d/yr by 30 yrs out
- Wind 9/10 Extreme 99% chance of damaging wind over 30 yrs
- Air quality 2/10 Low 1 unhealthy d/yr today · 1 by 30 yrs out
Nearby sold comps map
Loading sold comps map…
Walkable amenities ~0.75 mi
Loading nearby amenities…
Taxation est. · year 1
- Rental income
- $29,916
- − Mortgage interest
- −$14,856
- − Property taxes
- −$3,978
- − Insurance
- −$1,326
- − Repairs & maintenance
- −$2,393
- − Management
- −$2,393
- − Depreciation
- −$7,715
- Taxable loss
- −$2,746
- Est. tax savings @ 24.0%
- +$659
- After-tax cash flow
- $2,299/yr
For passive investors: Depreciation is non-cash, so a rental often shows a tax loss while cash-flowing — sheltering income. Rental losses are passive: they offset passive income freely, and up to $25,000/yr can offset ordinary (W-2) income if you actively participate and your MAGI is under $100k (phasing out to $0 by $150k); unused losses carry forward. On sale, claimed depreciation is recaptured at up to 25%, and gains may owe capital-gains tax (a 1031 exchange can defer both). Figures are a year-1 estimate at your 24.0% rate — not tax advice; consult a CPA.
Condition & rehab AI · 7 photos
This home is in good condition with a good exterior and interior. It has a good roof and flooring. The home is move-in ready with minor cosmetic updates that would increase its value.
Value-add opportunities
- Both Paint exterior — Enhances curb appeal and value
- Both Replace gutters — Improves drainage and aesthetics
- Both Replace light fixtures — Modernizes the home and improves energy efficiency
Renovation cost estimate screening
Value-add ROI direction
- Both Paint exterior — Enhances curb appeal and value ↑
- Both Replace gutters — Improves drainage and aesthetics ↑
- Both Replace light fixtures — Modernizes the home and improves energy efficiency ↑
ⓘ Cost ranges are severity-bucket heuristics (US national rule-of-thumb). Get contractor quotes + a written scope before underwriting a rehab budget.
Schools (NCES district)
- District
- Lamar CISD
- NCES district ID
- 4826580
- Math proficiency
- 50% ▼ -12.00%
- Reading proficiency
- 53% ▼ -4.00%
- Median HH income
- $75,213
- Composite
- 46.43/100
- National rank
- #2452
- State rank
- #116 of 826 in TX
Livability — Rosenberg
- Score
- 62/100
- State rank
- #922
- US rank
- #16414
Category grades
Schools grade is shown separately in the Schools card above.
Census & demographics
- County
- Fort Bend County · 836,777 people
- City population
- 115,151
- Metro
- Houston-The Woodlands-Sugar Land, TX
- Population (ZIP)
- 45,325
- Household income
- $73,186
- Rent vs Own
- Severe rent burden
- 1688.0
Population outlook (Fort Bend County) Hauer SSP2
- Today (2025)
- 1,004,526 people
- By 2030
- 1,153,104 · +14.8%
- By 2040
- 1,453,718 · +44.7%
- By 2050
- 1,753,781 · +74.6%
- By 2075
- 2,455,772 · +144.5%
- By 2100
- 2,930,528 · +191.7%
Race, ethnicity, and origin ACS 2023
- Neighborhood character
- Diverse neighborhood (Simpson 0.61)
- Race & ethnicity
- Hispanic / Latino 56% White 23% Two or more races 21% Black 12% Asian 7%
- Hispanic origin (detail)
- Mexican 46%
- Common ancestry
- Romanian 1% Lithuanian 1% Slovak 1%
- Foreign-born
- 18% · Canada, China, Vietnam
- Languages at home
- 57% English-only · Spanish 35% Tagalog/Filipino 2% Other Indo-European 1%
Political lean MEDSL · Fort Bend
- 2024 margin
- Toss-up / Even · D 49.5% · R 47.9% · Other 2.6%
- 2008→2024 swing
- +4.0pp toward D · 2008: -2.4pp · 2024: 1.6pp
- All cycles
- 2024: D+1.6 2020: D+10.6 2016: D+6.6 2012: R+6.8 2008: R+2.4
Not yet ingested
- Civics
- —
Market trends
- HPI YoY
- ▼ -74.06%
- Current HPI
- 309.5425
- Rent YoY
- ▼ -0.97%
- Metro
- Houston-The Woodlands-Sugar Land, TX
- State GDP YoY
- ▲ 3.95%
- F500 in state
- 110
Industry mix (Fortune 500 HQ in TX)
| Industry | F500 HQs | Revenue |
|---|---|---|
| Energy | 16 | $1,198B |
|
||
| Technology | 5 | $198B |
|
||
| Engineering / Construction | 4 | $72B |
|
||
| Energy Services | 3 | $60B |
|
||
| Utilities | 3 | $41B |
|
||
| Healthcare | 2 | $330B |
|
||
Price history
-9.2% since first listed5 events — show timeline
- 2026-05-16 Price Changed $284,995 Zillow
- 2026-05-12 Price Changed $281,995 Zillow
- 2026-04-28 Price Changed $289,995 Zillow
- 2026-04-15 Price Changed $298,995 Zillow
- 2026-04-08 Listed $313,995 Zillow
Cash-flow waterfall
monthlySold comps — $/sqft
last 12 mo · ≤1 miLoading sold comps…