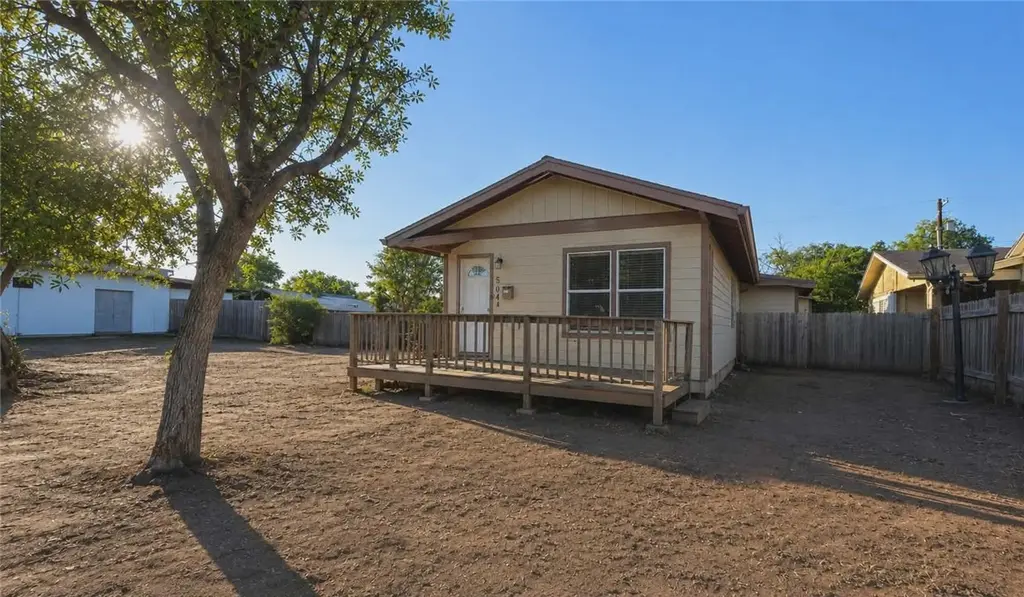
502 E Santa Gertrudis St · Kingsville, TX
Flood risk 1/10 · Minimal
- FEMA flood zone
- X (unshaded)
- Chance of flooding over 30 yrs
- 0.0%
- Est. flood insurance / yr
- $507 – $1,088
Fire risk 5/10 · Moderate
- Est. fire insurance / yr
- $1,222 – $2,270
Heat risk 9/10 · Severe
- Hot days now (above 111°F)
- 7 days/yr
- Hot days in 30 yrs
- 21 days/yr
Wind risk 8/10 · Major
- Chance of severe wind over 30 yrs
- 99.0%
Air-quality risk 1/10 · Minimal
- Unhealthy air days now
- 0 days/yr
- Unhealthy air days in 30 yrs
- 0 days/yr
Risk factors via First Street. Map © Google.
Why this score? — see what drove the C+ grade
The composite is a weighted blend of 9 inputs, each scored 0–100. Each bar is that input's sub-score; the figure is the points it added to the 100-point composite (weight × sub-score).
- Cash flow +28.2/30.0
- DSCR +10.0/10.0
- 1% rule +9.4/10.0
- Rent growth +4.3/5.0
- Livability +3.5/5.0
- ARV discount +2.5/15.0
- Condition / age +2.5/5.0
- Schools +1.5/10.0
- Appreciation +0.0/10.0
$68,000
🖨 Deal sheet (PDF) 📄 Offer letter ✓ Due diligence
Listing remarks
ocated at the corner of East Santa Gertrudis and 9th Street, this 2-bedroom, 2-bath investment property offers plenty of potential at an affordable price. Conveniently situated within walking distance to H-E-B, convenience stores, and other nearby amenities, the location makes it attractive for both investors and future tenants. The home features a large open-concept living, dining, and kitchen area, creating a spacious feel throughout the main living spaces. Enjoy relaxing on the oversized front porch while catching the South Texas breezes, or take advantage of the side-yard deck for additional outdoor space. The property also includes two separate carports for extra parking and convenienc
Key facts
- Corner location
- Side-yard deck
- 7,000 sq ft lot
Tags
Property features AI
Finance
- HOA & community: Short-term rentals allowed
Exterior
- Parking: Attached and detached covered parking with carport; Rear/side/off-street parking; Total of 4 parking spaces
- Security: Fencing: partial chain link and wood
- Utilities: Public water; Public sewer
- Home design: Single-story home; Frame construction with HardiPlank-type siding; Shingle roof; Pillar/post/pier foundation; Corner lot
- Construction: Built with frame construction and HardiPlank-type siding; Shingle roof; Pillar/post/pier foundation; Single story
- Exterior features: Deck; Open deck/patio
Interior
- Kitchen: Free-standing range; Range hood
- Bedrooms: Bedroom count not provided
- Flooring: Carpet; Vinyl
- Bathrooms: One full bathroom
- Heating & cooling: Central heating (electric); Central air conditioning
- Interior features: No notable interior features listed
- Laundry & utility: Washer hookup; Dryer hookup
Neighborhood map
What this means for you Summary
Snapshot
- This is a 2-bed/2.0-bath single-family listed at $68k.
Deal economics
- At list price, monthly cash flow is $215 ($3k/yr) — positive.
- The deal already cash-flows at list — no discount required.
- Meets the 1% rule at list price ($979 rent vs $68k).
- Recommended offer: $67k (1.5% below list) — sets the bar for market timing.
- Cap rate 10.1% vs local median 5.4% in Kingsville — top-decile yield for the area; either an underpriced asset or a hidden risk that comps aren't pricing in. Stress-test before assuming the spread holds.
Location & tenants
- Location reads 70/100 on livability (#364 in TX) — a middle-class / working-renter tenant base. Strengths: cost of living A+, housing A+, health & safety A+; Watch: schools D+, employment D, amenities F.
- Kingsville ISD (town): math 13% / reading 22% proficiency, ranked #800 of 826 in TX (top 97%) — low school quality limits family demand, transient renter base, plan for 1-2y turnover; 71% free/reduced lunch — lower-income household profile, screen leases tightly.
- Market conditions: Rents rising fast (+7.2%/yr); 216 active listings in the ZIP; 9 comparable units currently listed for rent nearby; rentals lingering (median 45d on market — plan ~5-8 weeks vacancy on turnover, expect pricing pressure); 89% of comp listings sitting > 30 days — soft ceiling on asking rent; 24 units permitted in Kleberg County in 2024 (0 in 5+ unit buildings).
Forward outlook
- Local home prices are declining (-3.0%/yr); year-one equity from $470 of loan paydown is wiped out by about $2k of value loss. Plan a longer hold.
- Kleberg County population projected at +9% by 2050 — modest demand growth; plan on rents tracking national, not racing it.
- At projected returns (-3.0% appreciation + 7.2% rent growth), your $19k cash investment doubles in ~7 years — after that, you're playing with house money.
Negotiation context
- It's been on market 25 days — a 2% lower offer ($67k) is reasonable based on typical stale-listing flexibility.
Risks & watch-outs
- Watch-outs: property tax is 3.1% of price; built in 1945 — expect roof / HVAC / electrical / plumbing capex.
- Climate carrying-cost: severe wind risk, 99% chance of damaging wind over 30y; moderate wildfire risk; extreme-heat days projected 7→21/yr by 2055 (HVAC capex compounding) — expect insurance premiums to compound above CPI over the hold.
Questions for the listing agent
- Built in 1945 — when were the roof, HVAC, electrical panel, plumbing, and water heater last replaced?
- Property tax is high relative to price — has the assessment been appealed recently, and will the sale trigger a re-assessment?
- Is there a deadline driving the sale (1031 exchange, divorce, estate, relocation)? That informs how much negotiation room exists.
- Schools are D-rated, which usually means shorter tenancies and higher turnover. Who's the typical renter profile here, and what's been the actual vacancy rate?
- What's the average days-on-market for RENTAL listings here right now (not sales)? A rising rental-DOM trend means longer vacancies and softer asking-rent achievability than the comps imply.
- What's the recent tenant-quality profile in this submarket — average credit score on applications, eviction rate, late-payment / NSF rate, and stable-employment percentage? A property-management company in the area should have these aggregated.
- How much new for-sale + rental construction is in the pipeline within 1–3 miles? Heavy new supply typically softens prices + rents 12–24 months out; constrained supply supports both.
Investment metrics
- 1% rule
- 1.44% ✓
- Cap rate
- 10.09%
- Cash-on-cash
- 13.54%
- DSCR
- 1.60
- GRM
- 5.8
CMA / ARV
- ARV (on-the-fly)
- $61,256
- Comps found
- 11
Show comp detail 11 sales within ~0.75 mi
| Address | Dist | Beds/Ba | Sqft | Sold | Price | $/sf | Match |
|---|---|---|---|---|---|---|---|
| 630 E B Ave | 0.31mi | 2/1.0 | 900 (-9%) | 1mo | $46,800 | $52 | 66 |
| 327 E B Ave | 0.27mi | 3/1.0 (+1) | 1,056 (+7%) | 4mo | $70,000 | $66 | 64 |
| 602 E Ella Ave | 0.11mi | 2/1.0 | 920 (-7%) | 23mo | $40,000 | $43 | 60 |
| 901 E Yoakum Ave | 0.51mi | 3/1.0 (+1) | 1,008 (+2%) | 9mo | $62,000 | $62 | 56 |
| 202 W Ave D | 0.58mi | 2/1.0 | 1,036 (+5%) | 8mo | $64,500 | $62 | 54 |
| 811 E B Ave | 0.37mi | 3/1.0 (+1) | 880 (-11%) | 6mo | $65,000 | $74 | 50 |
| 815 E Santa Gertrudis | 0.29mi | 3/1.0 (+1) | 1,074 (+9%) | 19mo | $38,000 | $35 | 47 |
| 215 W Alice Ave | 0.45mi | 1/1.0 (-1) | 912 (-8%) | 23mo | $53,000 | $58 | 38 |
| 518 W A Ave | 0.72mi | 2/1.0 | 880 (-11%) | 11mo | $88,999 | $101 | 35 |
| 722 E Yoakum Ave | 0.41mi | 3/3.0 (+1) | 1,109 (+12%) | 23mo | $169,900 | $153 | 32 |
| 928 W Avenue I | 0.66mi | 3/2.0 (+1) | 1,132 (+15%) | 12mo | $180,000 | $159 | 30 |
Match score weights: distance 35% · size 25% · config 20% · recency 20%. Top-matched comps best support the ARV.
Projected returns pro-forma
-3.0% appreciation · 7.18% rent growth · sell at horizon
- IRR
- 8.9%
- Equity multiple
- 1.37×
- Total profit
- $7,029
- Equity at exit
- $10,139
- IRR
- 21.7%
- Equity multiple
- 3.27×
- Total profit
- $43,225
- Equity at exit
- $5,879
Cash invested: $19,040 (down + closing). Projections, not guarantees.
Landlord ↔ Tenant lean methodology
- Overall (STATE)
- 87 Strongly Landlord-Friendly
- State Texas
- 87 Strongly Landlord-Friendly · R+5
- County
- — inherits STATE
- City
- — inherits STATE
ZIP-level market 78363
- Rents YoY
- 7.2%
- Active inventory
- 216
- Price-to-rent
- 5.8×
Monthly cashflow live
- Estimated rent
- $979 high interval (Pro) →
- Mortgage (P&I)
- −$357
- Tax from tax record
- −$174 /mo · $2,085/yr
- Insurance
- −$28
- HOA
- −$0
- Vacancy / Maint / Mgmt
- −$206
- Net cashflow
- $215
Break-even live
Sensitivity live
| Price | -10% $253 | -5% $234 | +0% $215 | +5% $196 | +10% $176 |
|---|---|---|---|---|---|
| Rent | -10% $138 | -5% $176 | +0% $215 | +5% $254 | +10% $292 |
| Rate | -1.0pp $249 | -0.5pp $232 | base $215 | +0.5pp $197 | +1.0pp $179 |
UW: 25.0% down · 7.5% · 30yr · 1.5% tax · 5.0% vac · 8.0% maint · 8.0% mgmt
Financing live
Cash to close
- Down payment
- $17,000
- Closing costs
- $2,040
- Reserves months
- —
- Total cash needed
- —
Loan-product check · same deal, 3 products live
Conventional
25% down · 7.5% · 30yr
- Down + closing
- —
- Monthly P&I
- —
- Monthly cashflow
- —
- DSCR
- —
- Eligible?
- —
Personal DTI + credit; lowest rate.
DSCR
20% down · 8.5% · 30yr
- Down + closing
- —
- Monthly P&I
- —
- Monthly cashflow
- —
- DSCR
- —
- Eligible?
- —
No personal income docs; deal must DSCR.
Hard money
10% down · 12.0% · 12mo
- Down + closing
- —
- Monthly P&I
- —
- Monthly cashflow
- —
- DSCR
- —
- Eligible?
- —
Short-term bridge; refi at stabilization.
Rent comps 9 comps
| Address | Beds | Baths | Sqft | Rent | $/sqft | DOM | Units | Dist |
|---|---|---|---|---|---|---|---|---|
| 200 W Yoakum Ave Kingsville, TX | 1.0 | 1.0 | 700 | $563 | $0.80 | 44d | 1 | 0.52mi |
| 732 W Richard Ave Apt 1 Kingsville, TX | 1.0 | 1.0 | 800 | $750 | $0.94 | 44d | 1 | 0.90mi |
| 908 E Doddridge Ave Kingsville, TX | 3.0 | 1.0 | 1100 | $850 | $0.77 | 44d | 1 | 0.97mi |
| 910 E Doddridge Ave Unit 1 Kingsville, TX | 2.0 | 1.0 | 585 | $650 | $1.11 | 44d | 1 | 0.97mi |
| 704 W Corral Ave Unit 301 Kingsville, TX | 1.0 | 1.0 | 693 | $775 | $1.12 | 44d | 1 | 1.00mi |
| 704 W Corral Ave Unit 503 Kingsville, TX | 2.0 | 1.0 | 935 | $995 | $1.06 | 44d | 1 | 1.00mi |
| 704 W Corral Ave Unit 402 Kingsville, TX | 2.0 | 1.0 | 935 | $895 | $0.96 | 44d | 1 | 1.00mi |
| 704 W Corral Ave Kingsville, TX | 2.0 | 1.0 | 935 | $865 | $0.93 | 44d | 1 | 1.02mi |
| 704 W Corral Ave Kingsville, TX | 1.0–2.0 | 1.0 | 814 | $995 | $1.22 | 3d | 7 | 1.02mi |
Listing history 18 events
-
2026-06-19days on market $68,000 Active 25 DOM
-
2026-06-18days on market $68,000 Active 24 DOM
-
2026-06-17days on market $68,000 Active 23 DOM
-
2026-06-16days on market $68,000 Active 22 DOM
-
2026-06-15days on market $68,000 Active 21 DOM
-
2026-06-14days on market $68,000 Active 19 DOM
-
2026-06-12days on market $68,000 Active 18 DOM
-
2026-06-09days on market $68,000 Active 15 DOM
-
2026-06-08days on market $68,000 Active 14 DOM
-
2026-06-07days on market $68,000 Active 13 DOM
-
2026-06-05days on market $68,000 Active 10 DOM
-
2026-06-03days on market $68,000 Active 9 DOM
-
2026-06-02days on market $68,000 Active 8 DOM
-
2026-06-01days on market $68,000 Active 7 DOM
-
2026-05-31days on market $68,000 Active 6 DOM
-
2026-05-30days on market $68,000 Active 5 DOM
-
2026-05-24$68,000 Active
-
2004-11-30soldstatus
ⓘ Source: listings_history table (triggers on properties + properties_extension) + one-shot
backfill from property_details.listing_events for pre-trigger history.
Tax reassessment forecast TX · Resets to sale price
- Current annual tax
- $2,085 · $174/mo
- Projected year-2 tax
- $2,085 · $174/mo
- Expected delta
- $0/yr ($0/mo · 0.0%)
ⓘ Screening estimate from a state-policy table — verify with the county assessor before closing.
Climate risk First Street
- Flood 1/10 Low FEMA zone X (unshaded) · 0% chance over 30 yrs
- Wildfire 5/10 Major
- Heat 9/10 Extreme 7 d/yr ≥111°F today · 21 d/yr by 30 yrs out
- Wind 8/10 Severe 99% chance of damaging wind over 30 yrs
- Air quality 1/10 Low 0 unhealthy d/yr today · 0 by 30 yrs out
Nearby sold comps map
Loading sold comps map…
Walkable amenities ~0.75 mi
Loading nearby amenities…
Taxation est. · year 1
- Rental income
- $11,751
- − Mortgage interest
- −$3,809
- − Property taxes
- −$2,085
- − Insurance
- −$340
- − Repairs & maintenance
- −$940
- − Management
- −$940
- − Depreciation
- −$1,978
- Taxable income
- $1,658
- Est. tax owed @ 24.0%
- −$398
- After-tax cash flow
- $2,181/yr
For passive investors: Depreciation is non-cash, so a rental often shows a tax loss while cash-flowing — sheltering income. Rental losses are passive: they offset passive income freely, and up to $25,000/yr can offset ordinary (W-2) income if you actively participate and your MAGI is under $100k (phasing out to $0 by $150k); unused losses carry forward. On sale, claimed depreciation is recaptured at up to 25%, and gains may owe capital-gains tax (a 1031 exchange can defer both). Figures are a year-1 estimate at your 24.0% rate — not tax advice; consult a CPA.
Schools (NCES district)
- District
- Kingsville ISD
- NCES district ID
- 4825680
- Math proficiency
- 13% ▼ -22.00%
- Reading proficiency
- 22% ▼ -7.00%
- Median HH income
- $36,308
- Composite
- 14.5/100
- National rank
- #9425
- State rank
- #800 of 826 in TX
Livability — Kingsville
- Score
- 70/100
- State rank
- #364
- US rank
- #7787
Category grades
Schools grade is shown separately in the Schools card above.
Census & demographics
- Census place
- Kingsville, TX
- County
- Kleberg County · 28,920 people
- City population
- 28,920
- Metro
- Kingsville, TX
- Population (ZIP)
- 28,920
- Household income
- $60,574
- Rent vs Own
- Severe rent burden
- 1663.0
Population outlook (Kleberg County) Hauer SSP2
- Today (2025)
- 31,615 people
- By 2030
- 32,054 · +1.4%
- By 2040
- 33,008 · +4.4%
- By 2050
- 34,536 · +9.2%
- By 2075
- 40,931 · +29.5%
- By 2100
- 46,001 · +45.5%
Race, ethnicity, and origin ACS 2023
- Neighborhood character
- Predominantly Hispanic (72%)
- Race & ethnicity
- Hispanic / Latino 72% Two or more races 36% White 20% Black 3% Asian 1% Native American 1%
- Hispanic origin (detail)
- Mexican 67%
- Common ancestry
- Italian 2% Slovak 1% Portuguese 1%
- Foreign-born
- 7% · Canada, China
- Languages at home
- 65% English-only · Spanish 32% Other Indo-European 1%
Political lean MEDSL · Kleberg
- 2024 margin
- R (+12.7) · D 43.3% · R 56.1%
- 2008→2024 swing
- -20.0pp toward R · 2008: 7.2pp · 2024: -12.7pp
- All cycles
- 2024: R+12.7 2020: R+1.7 2016: D+3.7 2012: D+7.8 2008: D+7.2
Not yet ingested
- Civics
- —
Market trends
- HPI YoY
- ▼ -87.12%
- Current HPI
- 147.6473
- Rent YoY
- ▲ 7.18%
- Metro
- Kingsville, TX
- State GDP YoY
- ▲ 3.95%
- F500 in state
- 110
Industry mix (Fortune 500 HQ in TX)
| Industry | F500 HQs | Revenue |
|---|---|---|
| Energy | 16 | $1,198B |
|
||
| Technology | 5 | $198B |
|
||
| Engineering / Construction | 4 | $72B |
|
||
| Energy Services | 3 | $60B |
|
||
| Utilities | 3 | $41B |
|
||
| Healthcare | 2 | $330B |
|
||
Price history
2 events — show timeline
- 2026-05-24 Listed $68,000 CBMLS
- 2004-11-30 Sold (Public Records) — Public Records
Property tax history
+9.5%/yrLatest (2025): $2,085 · +19.7% YoY. Source: county tax records.
Cash-flow waterfall
monthlySold comps — $/sqft
last 12 mo · ≤1 miLoading sold comps…