760 Wiggins Lake Dr #206 · Naples Park, FL
Flood risk 9/10 · Severe
- FEMA flood zone
- X (shaded)
- Chance of flooding over 30 yrs
- 0.99%
- Est. flood insurance / yr
- $507 – $1,088
Fire risk 3/10 · Minor
- Est. fire insurance / yr
- $947 – $1,759
Heat risk 10/10 · Severe
- Hot days now (above 107°F)
- 7 days/yr
- Hot days in 30 yrs
- 30 days/yr
Wind risk 10/10 · Severe
- Chance of severe wind over 30 yrs
- 99.0%
Air-quality risk 2/10 · Minimal
- Unhealthy air days now
- 1 days/yr
- Unhealthy air days in 30 yrs
- 1 days/yr
Risk factors via First Street. Map © Google.
Why this score? — see what drove the B grade
The composite is a weighted blend of 9 inputs, each scored 0–100. Each bar is that input's sub-score; the figure is the points it added to the 100-point composite (weight × sub-score).
- Cash flow +30.0/30.0
- 1% rule +10.0/10.0
- DSCR +10.0/10.0
- ARV discount +7.5/15.0
- Schools +5.0/10.0
- Livability +3.2/5.0
- Condition / age +2.5/5.0
- Rent growth +2.2/5.0
- Appreciation +0.0/10.0
$349,900
🖨 Deal sheet 📄 Offer letter ✓ Due diligence
Listing remarks
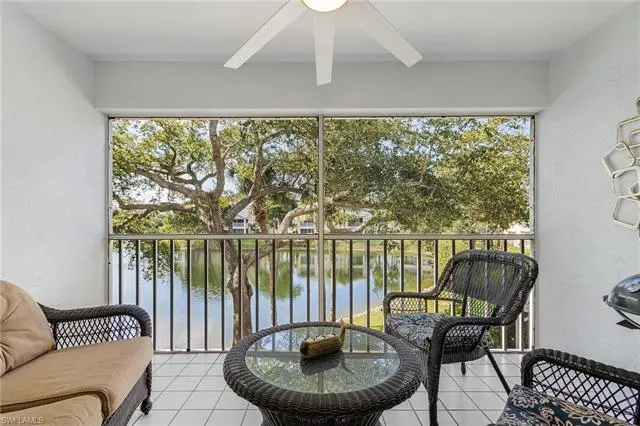
Exceptional value West of 41! Rare 3-bedroom upper CORNER residence with vaulted ceilings and peaceful Lake views!! Stunning 3-bedroom, 2-bathroom upper corner unit in the sought-after Wiggins Lakes & Preserves community located just minutes from the pristine beaches of Southwest Florida, this residence blends comfort, style, and convenience. Step inside to find vaulted ceilings that create a bright, airy feel. The updated kitchen and bathrooms feature gorgeous countertops, modern appliances, custom tile work, and granite vanities. Freshly painted throughout, the home also boasts a spacious laundry room with a brand-new washer and dryer, plus a new AC system and water heater—all
Key facts
- Lake views
- Modern appliances
- Custom tile work
Tags
Property features AI
Other
- Possession: Possession at closing; may be subject to lease
- Multi-unit & location: 2 units per floor; 12 units in building; 212 units in complex; Building number 12, unit 206; Section 16, lot/unit 206; Subdivision/Development: WIGGINS LAKES AND PRESERVES; Source of lot dimensions: Architectural plans; Deeded restrictions: no commercial, no motorcycles, no RVs; Has waterfront (lake)
Finance
- HOA & community: Mandatory HOA with professional management; Annual HOA fee of $8,508; One-time fee of $150; HOA covers irrigation water, lawn/land maintenance, legal/accounting, management, pest control (exterior and interior), recreation facilities, reserves, street lights, street maintenance, trash removal, and water; Community amenities include community pool, community room, library, bike storage, extra storage, internet access, pickleball, tennis court, underground utilities, streetlights, and vehicle wash area; Community type: Condo/Hotel, non-gated, tennis community
Exterior
- Parking: 2 assigned paved parking spaces; Detached 1-car carport
- Security: Entry keypad
- Utilities: Central water; Central sewer; Central electric power
- Home design: Residential property; Low-rise building (1–3 stories); Corner/end unit; Rear exposure faces south
- Construction: Concrete block construction; Stucco exterior; Shingle roof; Single-hung windows; Built in 1993
- Exterior features: Pond; Automatic sprinkler system; Storage; Tennis court; Water display; Across from waterfront; Corner lot; Lake view; Irrigation from lake/canal
Interior
- Kitchen: Dishwasher; Garbage disposal; Microwave; Range; Self-cleaning oven; Refrigerator/freezer; Refrigerator/ice maker; Grill (other)
- Bedrooms: 3 bedrooms
- Flooring: Tile
- Bathrooms: 2 full bathrooms; Master bath with dual sinks and multiple shower heads (shower only)
- Heating & cooling: Central electric heat; Central electric cooling; Ceiling fans
- Interior features: Bar; Built-in cabinets; French doors; High-speed internet available; Smoke detectors; Vaulted ceiling; Walk-in closet; Window coverings; Breakfast bar; Den (study); Guest bath; Guest room; Home office; Laundry in residence; Screened lanai/porch; Great room floor plan; Split bedrooms floor plan; Furnished negotiable
- Laundry & utility: Washer; Dryer
Neighborhood map
What this means for you Summary
Snapshot
- This is a 3-bed/2.0-bath condo listed at $350k.
Deal economics
- At list price, monthly cash flow is $1k ($15k/yr) — positive.
- The deal already cash-flows at list — no discount required.
- Meets the 1% rule at list price ($5k rent vs $350k).
- Recommended offer: $345k (1.5% below list) — sets the bar for market timing.
Location & tenants
- Location reads 64/100 on livability (#696 in FL) — a middle-class / working-renter tenant base. Strengths: crime A+, housing A-, employment B+; Watch: health & safety D, amenities F, commute F.
- Collier (suburban): math 60% / reading 56% proficiency, ranked #16 of 73 in FL (top 22%) — acceptable for families but not a draw, mixed tenant base, ~2y average lease.
- Zoned schools: Naples Park Elementary School (math 67% / reading 57%, grade B, #608 of 2,144 statewide, top 29%, 395 students, 48% FRL); Gulf Coast High School (math 57% / reading 68%, grade B-, #93 of 667 statewide, top 14%, 2,447 students, 20% FRL) — zoned schools average 34% FRL vs 55% district-wide (21 pts lower); this property's tenant base skews higher-income than the district average.
- Market conditions: Rents soft (-1.1%/yr); 595 active listings in the ZIP; 40 comparable units currently listed for rent nearby; rentals at typical pace (median 23d on market — plan ~3-4 weeks tenant-placement turnaround); solid renter incomes; 3,520 units permitted in Collier County in 2024 (959 in 5+ unit buildings).
- At $5,354/mo this rent would consume 66% of the median local household income ($98k/yr) (locally 1006% of renters already pay >50% of income on rent) — very limited rent-growth headroom before tenants either downsize or default.
Forward outlook
- Local home prices are declining (-3.0%/yr); year-one equity from $2k of loan paydown is wiped out by about $10k of value loss. Plan a longer hold.
- Collier County population projected at +30% by 2050 — long-run rental-demand tailwind backs the buy-and-hold thesis.
Negotiation context
- It's been on market 30 days — a 2% lower offer ($345k) is reasonable based on typical stale-listing flexibility.
- 9 sale attempts since 8y ago; this cycle's ask is 13358% above the opening price — seller raised mid-cycle; expect resistance to lowballs.
- Current owner paid $236k; 48% above their basis — modest negotiation headroom, anchor on the comps not their cost.
Risks & watch-outs
- Watch-outs: flood insurance adds $66/mo.
- Climate carrying-cost: severe flood risk; severe wind risk, 99% chance of damaging wind over 30y; extreme-heat days projected 7→30/yr by 2055 (HVAC capex compounding) — expect insurance premiums to compound above CPI over the hold.
Questions for the listing agent
- What's the actual annual flood-insurance premium (NFIP or private), and is the property in a SFHA with mandatory coverage?
- What does the HOA fee cover, when was the last increase, and are there any pending special assessments or reserve-fund shortfalls?
- Any open or pending special assessments — roof, HVAC, plumbing, elevator, façade? What's the per-unit balance and payoff schedule, and is the seller paying it off at close or rolling it to the buyer?
- Is there a deadline driving the sale (1031 exchange, divorce, estate, relocation)? That informs how much negotiation room exists.
- Schools are F-rated, which usually means shorter tenancies and higher turnover. Who's the typical renter profile here, and what's been the actual vacancy rate?
- What's the average days-on-market for RENTAL listings here right now (not sales)? A rising rental-DOM trend means longer vacancies and softer asking-rent achievability than the comps imply.
- What's the recent tenant-quality profile in this submarket — average credit score on applications, eviction rate, late-payment / NSF rate, and stable-employment percentage? A property-management company in the area should have these aggregated.
- How much new apartment / multifamily construction is in the pipeline within 1–3 miles? Heavy new supply (>2% of stock underway) typically softens rents 12–24 months out; light construction supports rent growth.
Investment metrics
- 1% rule
- 1.53% ✓
- Cap rate
- 10.76%
- Cash-on-cash
- 15.96%
- DSCR
- 1.71
- GRM
- 5.4
CMA / ARV
No comps found within radius.
Projected returns pro-forma
-3.0% appreciation · 0.0% rent growth · sell at horizon
- IRR
- 1.9%
- Equity multiple
- 1.07×
- Total profit
- $6,807
- Equity at exit
- $52,171
- IRR
- 7.7%
- Equity multiple
- 1.49×
- Total profit
- $48,472
- Equity at exit
- $30,253
Cash invested: $97,972 (down + closing). Projections, not guarantees.
Landlord ↔ Tenant lean methodology
- Overall (STATE)
- 87 Strongly Landlord-Friendly
- State Florida
- 87 Strongly Landlord-Friendly · R+3
- County
- — inherits STATE
- City
- — inherits STATE
ZIP-level market 34110
- Rents YoY
- -1.1%
- Active inventory
- 595
- Price-to-rent
- 5.4×
Monthly cashflow live
- Estimated rent
- $5,354 high interval (Pro) →
- Mortgage (P&I)
- −$1,835
- Tax from tax record
- −$237 /mo · $2,843/yr
- Insurance
- −$146
- Flood insurance flood zone
- −$66 /mo · $798/yr
- HOA
- −$709
- Vacancy / Maint / Mgmt
- −$1,124
- Net cashflow
- $1,237
Break-even live
UW: 25.0% down · 7.5% · 30yr · 1.5% tax · 5.0% vac · 8.0% maint · 8.0% mgmt
Financing live
Cash to close
- Down payment
- $87,475
- Closing costs
- $10,497
- Reserves months
- —
- Total cash needed
- —
Loan-product check · same deal, 3 products live
Conventional
25% down · 7.5% · 30yr
- Down + closing
- —
- Monthly P&I
- —
- Monthly cashflow
- —
- DSCR
- —
- Eligible?
- —
Personal DTI + credit; lowest rate.
DSCR
20% down · 8.5% · 30yr
- Down + closing
- —
- Monthly P&I
- —
- Monthly cashflow
- —
- DSCR
- —
- Eligible?
- —
No personal income docs; deal must DSCR.
Hard money
10% down · 12.0% · 12mo
- Down + closing
- —
- Monthly P&I
- —
- Monthly cashflow
- —
- DSCR
- —
- Eligible?
- —
Short-term bridge; refi at stabilization.
Rent comps 40 comps
| Address | Beds | Baths | Sqft | Rent | $/sqft | DOM | Units | Dist |
|---|---|---|---|---|---|---|---|---|
| 760 Wiggins Lake Dr #205 Naples, FL | 2.0 | 2.0 | 1179 | $5,500 | $4.66 | 23d | 1 | 0.02mi |
| 752 Wiggins Lake Dr #102 Naples, FL | 2.0 | 2.0 | 1402 | $2,375 | $1.69 | 21d | 1 | 0.04mi |
| 757 Wiggins Lake Dr #106 Naples, FL | 3.0 | 2.0 | 1374 | $6,000 | $4.37 | 23d | 1 | 0.04mi |
| 757 Wiggins Lake Dr #106 Naples, FL | 3.0 | 2.0 | 1374 | $6,000 | $4.37 | 13d | 1 | 0.04mi |
| 437 Wiggins Lake Ct #201 Naples, FL | 2.0 | 2.0 | 1283 | $4,500 | $3.51 | 23d | 1 | 0.07mi |
| 774 Wiggins Lake Dr #106 Naples, FL | 3.0 | 2.0 | 1374 | $6,500 | $4.73 | 23d | 1 | 0.10mi |
| 651 Wiggins Lake Dr #102 Naples, FL | 2.0 | 2.0 | 1487 | $6,500 | $4.37 | 23d | 1 | 0.14mi |
| 1337 Center Ln Naples, FL | 3.0 | 2.0 | 1500 | $4,300 | $2.87 | 23d | 1 | 0.20mi |
| 1296 Grand Canal Dr Naples, FL | 3.0 | 2.0 | 1614 | $8,000 | $4.96 | 23d | 1 | 0.24mi |
| 1284 Rainbow Ct Naples, FL | 2.0 | 2.0 | 1572 | $4,200 | $2.67 | 21d | 1 | 0.28mi |
| 1282 Belaire Ct Naples, FL | 3.0 | 3.5 | 1495 | $9,500 | $6.35 | 23d | 1 | 0.29mi |
| 480 Bermuda Cove Way Unit 1-104 Naples, FL | 2.0 | 2.0 | 1372 | $4,250 | $3.10 | 23d | 1 | 0.34mi |
| 425 Cove Tower Dr #902 Naples, FL | 2.0 | 2.0 | 1854 | $9,400 | $5.07 | 23d | 1 | 0.37mi |
| 430 Cove Tower Dr #302 Naples, FL | 3.0 | 2.0 | 1623 | $6,500 | $4.00 | 23d | 1 | 0.37mi |
| 430 Cove Tower Dr #1202 Naples, FL | 3.0 | 2.0 | 1519 | $7,800 | $5.13 | 23d | 1 | 0.37mi |
| 420 Cove Tower Dr #802 Naples, FL | 3.0 | 2.0 | 1621 | $4,750 | $2.93 | 23d | 1 | 0.43mi |
| 784 Carrick Bend Cir #101 Naples, FL | 3.0 | 2.0 | 1515 | $3,500 | $2.31 | 23d | 1 | 0.44mi |
| 360 Horse Creek Dr Naples, FL | 2.0 | 2.0 | 1589 | $5,250 | $3.30 | 13d | 4 | 0.47mi |
| 817 Carrick Bend Cir #101 Naples, FL | 3.0 | 2.0 | 1660 | $5,995 | $3.61 | 13d | 1 | 0.48mi |
| 340 Horse Creek Dr #304 Naples, FL | 2.0 | 2.0 | 1326 | $2,950 | $2.22 | 23d | 1 | 0.51mi |
| 975 Tarpon Cove Dr #204 Naples, FL | 3.0 | 2.0 | 1340 | $5,500 | $4.10 | 13d | 1 | 0.53mi |
| 320 Horse Creek Dr #105 Naples, FL | 2.0 | 2.0 | 1326 | $5,600 | $4.22 | 23d | 1 | 0.54mi |
| 300 Horse Creek Dr #408 Naples, FL | 2.0 | 2.0 | 1434 | $5,500 | $3.84 | 23d | 1 | 0.58mi |
| 1025 Tarpon Cove Dr #203 Naples, FL | 2.0 | 2.0 | 1225 | $5,500 | $4.49 | 13d | 1 | 0.63mi |
| 1120 Sarah Jean Cir Unit B205 Naples, FL | 3.0 | 2.0 | 1370 | $2,300 | $1.68 | 13d | 1 | 0.63mi |
| 1150 Yesica Ann Cir Unit A205 Naples, FL | 2.0 | 2.0 | 1300 | $6,000 | $4.62 | 13d | 1 | 0.70mi |
| 12945 Vanderbilt Dr Naples, FL | 2.0 | 2.0 | 1301 | $5,250 | $4.04 | 23d | 2 | 0.72mi |
| 13105 Vanderbilt Dr #808 Naples, FL | 2.0 | 2.0 | 1390 | $5,500 | $3.96 | 21d | 1 | 0.74mi |
| 13105 Vanderbilt Dr #808 Naples, FL | 2.0 | 2.0 | 1390 | $5,500 | $3.96 | 13d | 1 | 0.74mi |
| 13105 Vanderbilt Dr Naples, FL | 2.0 | 2.0 | 1390 | $5,450 | $3.92 | 23d | 2 | 0.74mi |
| 1190 Yesica Ann Cir Unit B101 Naples, FL | 2.0 | 2.0 | 1245 | $2,500 | $2.01 | 13d | 1 | 0.75mi |
| 953 Bunker Hill Dr Naples, FL | 2.0 | 2.0 | 1100 | $3,200 | $2.91 | 13d | 1 | 0.77mi |
| 1290 Yesica Ann Cir Unit G-105 Naples, FL | 2.0 | 2.0 | 1168 | $5,500 | $4.71 | 13d | 1 | 0.80mi |
| 1290 Yesica Ann Cir Unit G203 Naples, FL | 2.0 | 2.0 | 1245 | $6,000 | $4.82 | 13d | 1 | 0.80mi |
| 1245 Imperial Dr Naples, FL | 3.0 | 3.0 | 1848 | $13,000 | $7.03 | 23d | 1 | 0.88mi |
| 526 Lake Louise Cir Unit 4-403 Naples, FL | 3.0 | 2.0 | 1740 | $6,500 | $3.74 | 23d | 1 | 0.93mi |
| 513 Lake Louise Cir #202 Naples, FL | 2.0 | 2.0 | 1444 | $5,300 | $3.67 | 23d | 1 | 0.99mi |
| 1130 Turtle Creek Blvd Naples, FL | 1.0–2.0 | 1.0–2.0 | 800 | $2,145 | $2.68 | 13d | 22 | 1.00mi |
| 1351 Park Lake Dr Unit 14R Naples, FL | 2.0 | 2.0 | 1400 | $2,200 | $1.57 | 13d | 1 | 1.04mi |
| 505 Lake Louise Cir #101 Naples, FL | 2.0 | 2.0 | 1444 | $5,500 | $3.81 | 23d | 1 | 1.06mi |
HOA detail condo
- Monthly dues
- $709 · $8,508/yr
- Likely covers
- water
- Assessments
- None detected in remarks — confirm with the listing agent.
Listing history 38 events
-
2026-06-18days on market $349,900 Active 30 DOM
-
2026-06-17days on market $349,900 Active 29 DOM
-
2026-06-16days on market $349,900 Active 28 DOM
-
2026-06-15days on market $349,900 Active 27 DOM
-
2026-06-14days on market $349,900 Active 25 DOM
-
2026-06-10days on market $349,900 Active 22 DOM
-
2026-06-09days on market $349,900 Active 21 DOM
-
2026-06-08days on market $349,900 Active 20 DOM
-
2026-06-07days on market $349,900 Active 19 DOM
-
2026-06-03days on market $349,900 Active 15 DOM
-
2026-06-02days on market $349,900 Active 14 DOM
-
2026-06-01days on market $349,900 Active 13 DOM
-
2026-05-31days on market $349,900 Active 12 DOM
-
2026-05-30days on market $349,900 Active 11 DOM
-
2026-05-20$2,600
-
2026-05-20historical $2,600
-
2026-05-19$2,600
-
2026-05-19historical $6,800
-
2026-05-19$349,900 Active
-
2026-05-08historical
-
2026-05-01price $355,500
-
2026-04-21$6,800
-
2026-04-15price $365,000
-
2026-03-06price $379,900
-
2025-08-09$385,900 Active
-
2024-12-26historical
-
2024-11-11$435,000 Active
-
2024-07-04historical $6,000
-
2024-06-05$6,000
-
2022-11-21historical
-
2022-11-15$469,000 Active
-
2018-12-28soldstatus $236,000
-
2018-12-27soldstatus $236,000 Sold
-
2018-11-21status Pending With Contingencies
-
2018-11-14price $245,000
-
2018-09-24$249,900 Active
-
2004-05-19soldstatus $165,000
-
1993-03-04soldstatus $103,900
ⓘ Source: listings_history table (triggers on properties + properties_extension) + one-shot
backfill from property_details.listing_events for pre-trigger history.
Tax reassessment forecast FL · Resets to sale price
- Current annual tax
- $2,843 · $237/mo
- Projected year-2 tax
- $2,904 · $242/mo
- Expected delta
- +$62/yr (+$5/mo · 2.2%)
ⓘ Screening estimate from a state-policy table — verify with the county assessor before closing.
Climate risk First Street
- Flood 9/10 Extreme FEMA zone X (shaded) · 99% chance over 30 yrs
- Wildfire 3/10 Moderate
- Heat 10/10 Extreme 7 d/yr ≥107°F today · 30 d/yr by 30 yrs out
- Wind 10/10 Extreme 99% chance of damaging wind over 30 yrs
- Air quality 2/10 Low 1 unhealthy d/yr today · 1 by 30 yrs out
Nearby sold comps map
Loading sold comps map…
Walkable amenities ~0.75 mi
Loading nearby amenities…
Taxation est. · year 1
- Rental income
- $64,248
- − Mortgage interest
- −$19,600
- − Property taxes
- −$2,843
- − Insurance
- −$2,547
- − Repairs & maintenance
- −$5,140
- − Management
- −$5,140
- − HOA
- −$8,508
- − Depreciation
- −$10,179
- Taxable income
- $10,292
- Est. tax owed @ 24.0%
- −$2,470
- After-tax cash flow
- $12,370/yr
For passive investors: Depreciation is non-cash, so a rental often shows a tax loss while cash-flowing — sheltering income. Rental losses are passive: they offset passive income freely, and up to $25,000/yr can offset ordinary (W-2) income if you actively participate and your MAGI is under $100k (phasing out to $0 by $150k); unused losses carry forward. On sale, claimed depreciation is recaptured at up to 25%, and gains may owe capital-gains tax (a 1031 exchange can defer both). Figures are a year-1 estimate at your 24.0% rate — not tax advice; consult a CPA.
Schools (NCES district)
- District
- Collier
- NCES district ID
- 1200330
- Math proficiency
- 60% ▼ -4.00%
- Reading proficiency
- 56% ▼ -2.00%
- Median HH income
- $58,275
- Composite
- 50.23/100
- National rank
- #1892
- State rank
- #16 of 73 in FL
Livability — Naples Park
- Score
- 64/100
- State rank
- #696
- US rank
- #14564
Category grades
Schools grade is shown separately in the Schools card above.
Census & demographics
- County
- Collier County · 396,295 people
- City population
- 64,727
- Metro
- Naples-Marco Island, FL
- Population (ZIP)
- 25,630
- Household income
- $97,564
- Rent vs Own
- Severe rent burden
- 1006.0
Population outlook (Collier County) Hauer SSP2
- Today (2025)
- 420,858 people
- By 2030
- 450,054 · +6.9%
- By 2040
- 502,232 · +19.3%
- By 2050
- 544,932 · +29.5%
- By 2075
- 627,203 · +49.0%
- By 2100
- 659,015 · +56.6%
Race, ethnicity, and origin ACS 2023
- Neighborhood character
- Predominantly White (84%)
- Race & ethnicity
- White 84% Hispanic / Latino 10% Two or more races 9% Asian 2% Black 1%
- Hispanic origin (detail)
- Mexican 2% Puerto Rican 1% Cuban 3%
- Common ancestry
- Romanian 4% Lithuanian 3% Slovak 2%
- Foreign-born
- 11% · Canada, South Korea
- Languages at home
- 87% English-only · Spanish 7% Other Indo-European 3% French/Haitian/Cajun 1%
Political lean MEDSL · Collier
- 2024 margin
- Solid R (+33.1) · D 33.1% · R 66.2%
- 2008→2024 swing
- -10.6pp toward R · 2008: -22.5pp · 2024: -33.1pp
- All cycles
- 2024: R+33.1 2020: R+24.7 2016: R+26.0 2012: R+30.1 2008: R+22.5
Not yet ingested
- Civics
- —
Market trends
- HPI YoY
- ▼ -172.68%
- Current HPI
- 267.4644
- Rent YoY
- ▼ -1.06%
- Metro
- Naples-Marco Island, FL
- State GDP YoY
- ▲ 3.28%
- F500 in state
- 36
Industry mix (Fortune 500 HQ in FL)
| Industry | F500 HQs | Revenue |
|---|---|---|
| Industrial Technology | 2 | $29B |
|
||
| Insurance | 2 | $17B |
|
||
| Retail | 1 | $60B |
|
||
| Technology Distribution | 1 | $58B |
|
||
| Homebuilding | 1 | $35B |
|
||
| Technology Manufacturing | 1 | $35B |
|
||
Price history
-97.5% since first listed24 events — show timeline
- 2026-05-20 Listed for Rent $2,600 FGCMLS
- 2026-05-20 Rental Removed $2,600 NAPLESMLS
- 2026-05-19 Listed for Rent $2,600 NAPLESMLS
- 2026-05-19 Rental Removed $6,800 NAPLESMLS
- 2026-05-19 Listed $349,900 NAPLESMLS
- 2026-05-08 Listing Removed — NAPLESMLS
- 2026-05-01 Price Changed $355,500 NAPLESMLS
- 2026-04-21 Listed for Rent $6,800 NAPLESMLS
- 2026-04-15 Price Changed $365,000 NAPLESMLS
- 2026-03-06 Price Changed $379,900 NAPLESMLS
- 2025-08-09 Listed $385,900 NAPLESMLS
- 2024-12-26 Listing Removed — NAPLESMLS
- 2024-11-11 Listed $435,000 NAPLESMLS
- 2024-07-04 Rental Removed $6,000 NAPLESMLS
- 2024-06-05 Listed for Rent $6,000 NAPLESMLS
- 2022-11-21 Listing Removed — NAPLESMLS
- 2022-11-15 Listed $469,000 NAPLESMLS
- 2018-12-28 Sold (Public Records) $236,000 Public Records
- 2018-12-27 Sold (MLS) $236,000 NAPLESMLS
- 2018-11-21 Pending — NAPLESMLS
- 2018-11-14 Price Changed $245,000 NAPLESMLS
- 2018-09-24 Listed $249,900 NAPLESMLS
- 2004-05-19 Sold (Public Records) $165,000 Public Records
- 1993-03-04 Sold (Public Records) $103,900 Public Records
Property tax history
+5.7%/yrLatest (2025): $2,843 · +0.7% YoY. Source: county tax records.
Cash-flow waterfall
monthlySold comps — $/sqft
last 12 mo · ≤1 miLoading sold comps…