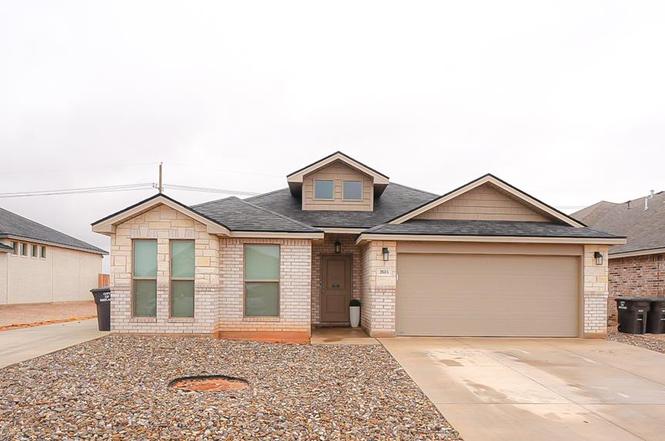
2615 Hazel Ln · Midland, TX
Flood risk 1/10 · Minimal
- FEMA flood zone
- —
- Chance of flooding over 30 yrs
- 0.0%
- Est. flood insurance / yr
- —
Fire risk 3/10 · Minor
- Est. fire insurance / yr
- $1,222 – $2,270
Heat risk 6/10 · Moderate
- Hot days now (above 102°F)
- 7 days/yr
- Hot days in 30 yrs
- 22 days/yr
Wind risk 3/10 · Minor
- Chance of severe wind over 30 yrs
- 6.0%
Air-quality risk 1/10 · Minimal
- Unhealthy air days now
- 0 days/yr
- Unhealthy air days in 30 yrs
- 0 days/yr
Risk factors via First Street. Map © Google.
Why this score? — see what drove the D- grade
The composite is a weighted blend of 9 inputs, each scored 0–100. Each bar is that input's sub-score; the figure is the points it added to the 100-point composite (weight × sub-score).
- Cash flow +11.9/30.0
- ARV discount +7.5/15.0
- Livability +4.0/5.0
- DSCR +3.5/10.0
- 1% rule +3.4/10.0
- Schools +3.2/10.0
- Rent growth +3.1/5.0
- Condition / age +2.5/5.0
- Appreciation +0.0/10.0
$350,000
🖨 Deal sheet (PDF) 📄 Offer letter ✓ Due diligence
Listing remarks
STEP IN TO THIS STUNNING HOME. DRENCHED IN NEUTRAL TONES THIS HOME IS PERFECT FOR PERSONALIZATION WITH EAZE. THIS 4 BEDROOM 2 BATH HOME FEATURES AN OPEN FLOOR PLAN WITH OVERSIZED KITCHEN ISLAND READY TO ENTERTAIN. NOT TO MENTION THE BEDROOM FLOORPLAN IS PERFECTLY BALANCED FOR ANY USE. MASTER BEDROOM IS SEQUESTERED FOR SERENE COMFORT, SECONDARY BEDROOMS ARE IN SEPERATE CORRIDOR AND GUEST SUITE CAN ALSO BE USED AS AN OFFICE WHICH GIVES THIS PROPERTY ENHANCED VERSATILITY. DONT FORGET TO MENTION THE NEIGHBORHOOD PARK AND SCHOOL BEING BUILT ONLY BLOCKS AWAY. NOTE: ADDITIONAL PARKING PAD
Key facts
- Open floor plan
- Neighborhood park
- 7,405 sq ft lot
Tags
Neighborhood map
What this means for you Summary
Snapshot
- This is a 4-bed/2.0-bath single-family listed at $350k.
Deal economics
- At list price, monthly cash flow is $-88 ($-1k/yr) — negative.
- To cash-flow at today's rent, offer at most $334k (4.4% below list).
- To meet the 1% rule (rent ≥ 1% of price), the offer needs to be $295k (15.6% below list).
- Recommended offer: $295k (15.6% below list) — sets the bar for 1% rule.
- Cap rate 6.0% vs local median 4.7% in Midland — meaningfully above typical; check what's discounted (condition, days-on-market, listing class) to confirm the premium yield is real.
Location & tenants
- Location reads 79/100 on livability (#57 in TX, #2,192 nationally) — a middle-class / working-renter tenant base. Strengths: employment A+, housing A+, health & safety A+; Watch: crime C-, commute D+, amenities D.
- Midland ISD (urban): math 34% / reading 36% proficiency, ranked #477 of 826 in TX (top 58%) — families likely to look elsewhere, expect single-tenant / working-renter base with shorter leases.
- Zoned schools: General Tommy Franks El (math 43% / reading 46%, grade F, #1,155 of 4,322 statewide, top 29%, 825 students, 38% FRL); Goddard J H (math 23% / reading 32%, grade F, #1,156 of 1,662 statewide, top 71%, 1,024 students, 58% FRL, charter); Midland H S (math 37% / reading 7%, grade F, #1,366 of 1,632 statewide, top 84%, 2,492 students, 44% FRL) — zoned schools at 47% FRL track the district average.
- Market conditions: Rents rising (+2.6%/yr); 452 active listings in the ZIP; 25 comparable units currently listed for rent nearby; rentals at typical pace (median 23d on market — plan ~3-4 weeks tenant-placement turnaround); 44% of comp listings sitting > 30 days — soft ceiling on asking rent; solid renter incomes; 1,504 units permitted in Midland County in 2024 (0 in 5+ unit buildings).
- This rent runs 34% of the median local income ($105k/yr) — at the standard rent-burdened threshold; future hikes will face affordability resistance.
Forward outlook
- Local home prices are declining (-3.0%/yr); year-one equity from $2k of loan paydown is wiped out by about $10k of value loss. Plan a longer hold.
- Midland County population projected at +83% by 2050 — long-run rental-demand tailwind backs the buy-and-hold thesis.
Negotiation context
- It's been on market 22 days — a 2% lower offer ($345k) is reasonable based on typical stale-listing flexibility.
Risks & watch-outs
- Climate carrying-cost: extreme-heat days projected 7→22/yr by 2055 (HVAC capex compounding) — expect insurance premiums to compound above CPI over the hold.
Questions for the listing agent
- What do current leases actually rent for vs. the listed asking? Can we see a recent rent roll and the last 12 months of T-12 income?
- What does the HOA fee cover, when was the last increase, and are there any pending special assessments or reserve-fund shortfalls?
- Is there a deadline driving the sale (1031 exchange, divorce, estate, relocation)? That informs how much negotiation room exists.
- The area grade is low — what's the realistic commute time and amenity access for the typical tenant pool here? Any planned neighborhood developments (good or bad) we should know about?
- What's the average days-on-market for RENTAL listings here right now (not sales)? A rising rental-DOM trend means longer vacancies and softer asking-rent achievability than the comps imply.
- What's the recent tenant-quality profile in this submarket — average credit score on applications, eviction rate, late-payment / NSF rate, and stable-employment percentage? A property-management company in the area should have these aggregated.
- How much new for-sale + rental construction is in the pipeline within 1–3 miles? Heavy new supply typically softens prices + rents 12–24 months out; constrained supply supports both.
Investment metrics
- 1% rule
- 0.84% ✗
- Cap rate
- 5.99%
- Cash-on-cash
- -1.08%
- DSCR
- 0.95
- GRM
- 9.9
CMA / ARV
No comps found within radius.
Projected returns pro-forma
-3.0% appreciation · 2.56% rent growth · sell at horizon
- IRR
- -18.6%
- Equity multiple
- 0.35×
- Total profit
- $-63,585
- Equity at exit
- $52,186
- IRR
- -11.8%
- Equity multiple
- 0.31×
- Total profit
- $-67,705
- Equity at exit
- $30,262
Cash invested: $98,000 (down + closing). Projections, not guarantees.
Landlord ↔ Tenant lean methodology
- Overall (STATE)
- 87 Strongly Landlord-Friendly
- State Texas
- 87 Strongly Landlord-Friendly · R+5
- County
- — inherits STATE
- City
- — inherits STATE
ZIP-level market 79705
- Rents YoY
- 2.6%
- Active inventory
- 452
- Price-to-rent
- 9.9×
Monthly cashflow live
- Estimated rent
- $2,952 high interval (Pro) →
- Mortgage (P&I)
- −$1,835
- Tax from tax record
- −$417 /mo · $5,008/yr
- Insurance
- −$146
- HOA
- −$22
- Vacancy / Maint / Mgmt
- −$620
- Net cashflow
- $-88
Break-even live
Sensitivity live
| Price | -10% $110 | -5% $11 | +0% $-88 | +5% $-187 | +10% $-286 |
|---|---|---|---|---|---|
| Rent | -10% $-321 | -5% $-205 | +0% $-88 | +5% $28 | +10% $145 |
| Rate | -1.0pp $88 | -0.5pp $1 | base $-88 | +0.5pp $-179 | +1.0pp $-271 |
UW: 25.0% down · 7.5% · 30yr · 1.5% tax · 5.0% vac · 8.0% maint · 8.0% mgmt
Financing live
Cash to close
- Down payment
- $87,500
- Closing costs
- $10,500
- Reserves months
- —
- Total cash needed
- —
Loan-product check · same deal, 3 products live
Conventional
25% down · 7.5% · 30yr
- Down + closing
- —
- Monthly P&I
- —
- Monthly cashflow
- —
- DSCR
- —
- Eligible?
- —
Personal DTI + credit; lowest rate.
DSCR
20% down · 8.5% · 30yr
- Down + closing
- —
- Monthly P&I
- —
- Monthly cashflow
- —
- DSCR
- —
- Eligible?
- —
No personal income docs; deal must DSCR.
Hard money
10% down · 12.0% · 12mo
- Down + closing
- —
- Monthly P&I
- —
- Monthly cashflow
- —
- DSCR
- —
- Eligible?
- —
Short-term bridge; refi at stabilization.
Rent comps 25 comps
| Address | Beds | Baths | Sqft | Rent | $/sqft | DOM | Units | Dist |
|---|---|---|---|---|---|---|---|---|
| 2702 Southwest St Midland, TX | 3.0 | 2.0 | 1844 | $2,500 | $1.36 | 45d | 1 | 0.26mi |
| 2405 Bastrop Ave Midland, TX | 4.0 | 3.0 | 2561 | $3,800 | $1.48 | 15d | 1 | 0.27mi |
| 2409 Husk St Midland, TX | 3.0 | 2.0 | 1927 | $2,800 | $1.45 | 15d | 1 | 0.31mi |
| 2409 Husk St Unit 1 Midland, TX | 3.0 | 2.0 | 1800 | $3,000 | $1.67 | 15d | 1 | 0.31mi |
| 6735 Draw Ct Midland, TX | 4.0 | 2.0 | 2050 | $2,500 | $1.22 | 45d | 1 | 0.32mi |
| 2703 Ranch Ave Midland, TX | 3.0 | 2.0 | 1658 | $2,350 | $1.42 | 23d | 1 | 0.39mi |
| 6914 Outlaw Ct Midland, TX | 4.0 | 2.0 | 2123 | $3,250 | $1.53 | 15d | 1 | 0.46mi |
| 6801 Baron Dr Midland, TX | 4.0 | 2.0 | 2058 | $3,150 | $1.53 | 15d | 1 | 0.63mi |
| 2060 Acacia Ln Midland, TX | 3.0 | 2.0 | 2050 | $3,100 | $1.51 | 15d | 1 | 0.80mi |
| 1909 Rattler Ln Midland, TX | 4.0 | 3.0 | 2577 | $3,300 | $1.28 | 45d | 1 | 0.83mi |
| 1801 Chuck Wagon Midland, TX | 4.0 | 2.5 | 2300 | $3,100 | $1.35 | 15d | 1 | 0.93mi |
| 3701 Timberwolf Trl Midland, TX | 3.0 | 3.0 | 2873 | $6,000 | $2.09 | 45d | 1 | 0.96mi |
| 6109 Buckthorn Dr Midland, TX | 4.0 | 2.0 | 1655 | $2,900 | $1.75 | 23d | 1 | 0.98mi |
| 1708 Rattler Ln Midland, TX | 3.0 | 2.0 | 1694 | $2,550 | $1.51 | 45d | 1 | 1.08mi |
| 5920 Woodpecker Way Midland, TX | 3.0 | 2.0 | 1669 | $3,800 | $2.28 | 45d | 1 | 1.15mi |
| 2944 Hidalgo Ave Midland, TX | 3.0 | 2.0 | 1689 | $3,800 | $2.25 | 45d | 1 | 1.21mi |
| 1508 Rattler Ln Midland, TX | 3.0 | 2.0 | 1578 | $2,250 | $1.43 | 15d | 1 | 1.24mi |
| 6011 Purtis Creek Dr Midland, TX | 4.0 | 2.0 | 1722 | $2,900 | $1.68 | 45d | 1 | 1.25mi |
| 1501 Wrangler Ln Midland, TX | 3.0 | 2.0 | 1960 | $2,750 | $1.40 | 15d | 1 | 1.28mi |
| 6706 Yellow Rose Ct Midland, TX | 3.0 | 2.0 | 1819 | $2,800 | $1.54 | 45d | 1 | 1.30mi |
| 1315 Yellow Rose Ct Midland, TX | 3.0 | 2.0 | 1600 | $2,600 | $1.62 | 15d | 1 | 1.31mi |
| 2409 Open Range Ln Midland, TX | 4.0 | 3.0 | 2660 | $3,800 | $1.43 | 45d | 1 | 1.36mi |
| 1416 Bajada St Midland, TX | 4.0 | 2.0 | 1933 | $3,150 | $1.63 | 15d | 1 | 1.45mi |
| 1408 Bajada St Midland, TX | 3.0 | 2.0 | 1633 | $2,599 | $1.59 | 45d | 1 | 1.47mi |
| 1405 Bajada St Midland, TX | 3.0 | 2.0 | 1633 | $2,950 | $1.81 | 15d | 1 | 1.49mi |
HOA detail
- Monthly dues
- $22 · $264/yr
Listing history 3 events
-
2025-02-23status Pending
-
2025-02-11historical Active Under Contract
-
2025-02-01$350,000 Active
ⓘ Source: listings_history table (triggers on properties + properties_extension) + one-shot
backfill from property_details.listing_events for pre-trigger history.
Tax reassessment forecast TX · Resets to sale price
- Current annual tax
- $5,008 · $417/mo
- Projected year-2 tax
- $6,405 · $534/mo
- Expected delta
- +$1,397/yr (+$116/mo · 27.9%)
ⓘ Screening estimate from a state-policy table — verify with the county assessor before closing.
Climate risk First Street
- Flood 1/10 Low 0% chance over 30 yrs
- Wildfire 3/10 Moderate
- Heat 6/10 Major 7 d/yr ≥102°F today · 22 d/yr by 30 yrs out
- Wind 3/10 Moderate 6% chance of damaging wind over 30 yrs
- Air quality 1/10 Low 0 unhealthy d/yr today · 0 by 30 yrs out
Nearby sold comps map
Loading sold comps map…
Walkable amenities ~0.75 mi
Loading nearby amenities…
Taxation est. · year 1
- Rental income
- $35,429
- − Mortgage interest
- −$19,605
- − Property taxes
- −$5,008
- − Insurance
- −$1,750
- − Repairs & maintenance
- −$2,834
- − Management
- −$2,834
- − HOA
- −$264
- − Depreciation
- −$10,182
- Taxable loss
- −$7,048
- Est. tax savings @ 24.0%
- +$1,692
- After-tax cash flow
- $634/yr
For passive investors: Depreciation is non-cash, so a rental often shows a tax loss while cash-flowing — sheltering income. Rental losses are passive: they offset passive income freely, and up to $25,000/yr can offset ordinary (W-2) income if you actively participate and your MAGI is under $100k (phasing out to $0 by $150k); unused losses carry forward. On sale, claimed depreciation is recaptured at up to 25%, and gains may owe capital-gains tax (a 1031 exchange can defer both). Figures are a year-1 estimate at your 24.0% rate — not tax advice; consult a CPA.
Schools (NCES district)
- District
- Midland ISD
- NCES district ID
- 4830570
- Math proficiency
- 34% ▼ -7.00%
- Reading proficiency
- 36% ▬ 0.00%
- Median HH income
- $63,457
- Composite
- 31.63/100
- National rank
- #5938
- State rank
- #477 of 826 in TX
Livability — Midland
- Score
- 79/100
- State rank
- #57
- US rank
- #2192
Category grades
Schools grade is shown separately in the Schools card above.
Census & demographics
- Census place
- Midland, TX
- County
- Midland County · 168,494 people
- City population
- 168,494
- Metro
- Midland, TX
- Population (ZIP)
- 46,653
- Household income
- $105,310
- Rent vs Own
- Severe rent burden
- 1557.0
Population outlook (Midland County) Hauer SSP2
- Today (2025)
- 220,895 people
- By 2030
- 253,667 · +14.8%
- By 2040
- 325,498 · +47.4%
- By 2050
- 404,168 · +83.0%
- By 2075
- 609,802 · +176.1%
- By 2100
- 760,172 · +244.1%
Race, ethnicity, and origin ACS 2023
- Neighborhood character
- Diverse neighborhood (Simpson 0.60)
- Race & ethnicity
- White 46% Hispanic / Latino 43% Two or more races 20% Black 8%
- Hispanic origin (detail)
- Mexican 35%
- Common ancestry
- Slovak 1% Lithuanian 1% Serbian 1%
- Foreign-born
- 10% · Canada, Jamaica
- Languages at home
- 72% English-only · Spanish 24% Arabic 1%
Political lean MEDSL · Midland
- 2024 margin
- Solid R (+60.5) · D 19.3% · R 79.8%
- 2008→2024 swing
- -3.3pp toward R · 2008: -57.3pp · 2024: -60.5pp
- All cycles
- 2024: R+60.5 2020: R+56.6 2016: R+55.2 2012: R+61.5 2008: R+57.3
Not yet ingested
- Civics
- —
Market trends
- HPI YoY
- ▼ -300.44%
- Current HPI
- 207.2904
- Rent YoY
- ▲ 2.56%
- Metro
- Midland, TX
- State GDP YoY
- ▲ 3.95%
- F500 in state
- 110
Industry mix (Fortune 500 HQ in TX)
| Industry | F500 HQs | Revenue |
|---|---|---|
| Energy | 16 | $1,198B |
|
||
| Technology | 5 | $198B |
|
||
| Engineering / Construction | 4 | $72B |
|
||
| Energy Services | 3 | $60B |
|
||
| Utilities | 3 | $41B |
|
||
| Healthcare | 2 | $330B |
|
||
Price history
3 events — show timeline
- 2025-02-23 Pending — PBBOR
- 2025-02-11 Contingent — PBBOR
- 2025-02-01 Listed $350,000 PBBOR
Property tax history
+120.2%/yrLatest (2025): $5,008 · -3.4% YoY. Source: county tax records.
Cash-flow waterfall
monthlySold comps — $/sqft
last 12 mo · ≤1 miLoading sold comps…