12044 Royal Rd Spc 4 · Winter Gardens, CA
Flood risk 1/10 · Minimal
- FEMA flood zone
- X (unshaded)
- Chance of flooding over 30 yrs
- 0.0%
- Est. flood insurance / yr
- $507 – $1,088
Fire risk 5/10 · Moderate
- Est. fire insurance / yr
- $659 – $1,223
Heat risk 5/10 · Moderate
- Hot days now (above 98°F)
- 5 days/yr
- Hot days in 30 yrs
- 14 days/yr
Wind risk 1/10 · Minimal
- Chance of severe wind over 30 yrs
- —
Air-quality risk 4/10 · Minor
- Unhealthy air days now
- 6 days/yr
- Unhealthy air days in 30 yrs
- 7 days/yr
Risk factors via First Street. Map © Google.
Why this score? — see what drove the B+ grade
The composite is a weighted blend of 9 inputs, each scored 0–100. Each bar is that input's sub-score; the figure is the points it added to the 100-point composite (weight × sub-score).
- Cash flow +30.0/30.0
- ARV discount +15.0/15.0
- 1% rule +10.0/10.0
- DSCR +10.0/10.0
- Schools +4.4/10.0
- Livability +3.1/5.0
- Condition / age +2.5/5.0
- Rent growth +2.3/5.0
- Appreciation +0.0/10.0
$150,000
🖨 Deal sheet 📄 Offer letter ✓ Due diligence
Listing remarks MLS
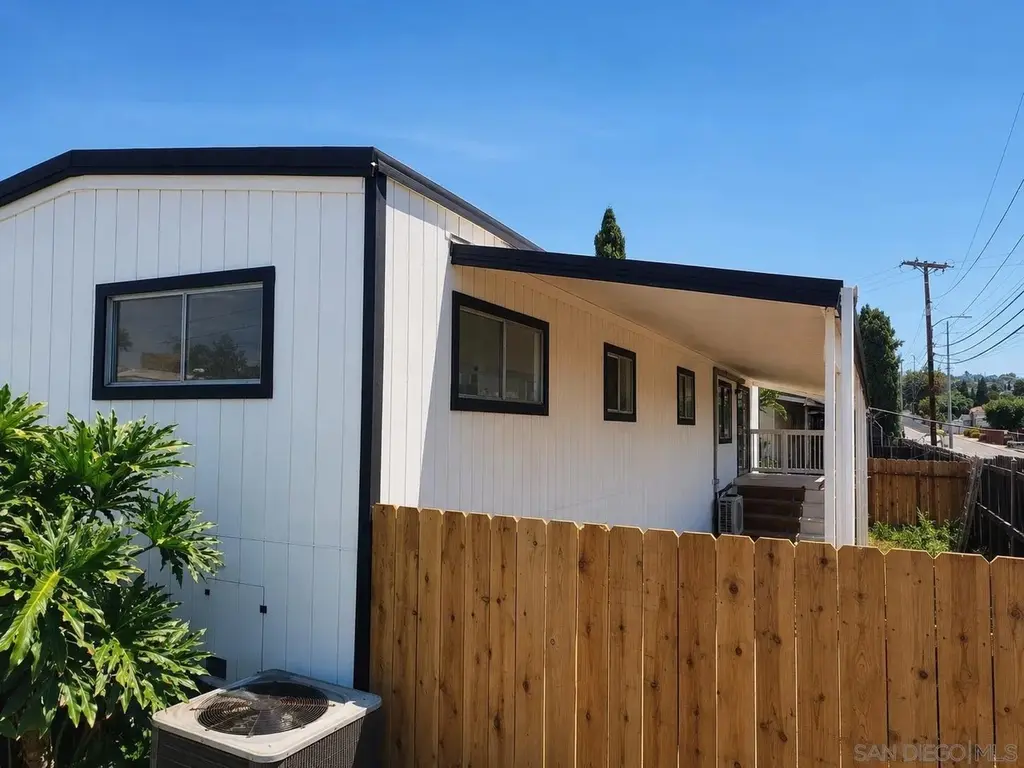
This could be your Retro Dollhouse! It's the perfect project just looking for your talent and imagination to bring out all of its potential, or it's ready to enjoy as is. It has a fantastic floor plan including a large open living space with mini-split HVAC, indoor laundry, 3 bedrooms, 2 full baths, and even a walk-in closet in the master bedroom. Outside, you'll find a fenced-in yard with a private front porch and patio, a large garden box, 3 sheds, and covered parking. Located in a convenient and hidden area of the all-age park, the home is near the pool, clubhouse, guest parking, and entryway. Come take a look!
Key facts
- 7.75 acre lot
- 3 parking spots
- Community pool
Property features AI
Finance
- HOA & community: Common-interest community; Community pool
Exterior
- Parking: Tandem parking for 3 vehicles
- Utilities: Sewer connected
- Home design: Single-story mobile home; Residential property in a common-interest community; Located in Westward Ho Manor subdivision
- Construction: Vertical siding construction; Built as a single-story structure
- Exterior features: Full wood fencing; Community pool
Interior
- Kitchen: Gas cooktop
- Bedrooms: 3 possible bedrooms
- Bathrooms: 2 full bathrooms
- Heating & cooling: Electric heating; Wall/window air conditioning
- Interior features: Gas cooktop; Wall/window air conditioning
Neighborhood map
What this means for you Summary
Snapshot
- This is a 3-bed/2.0-bath manufactured listed at $150k.
Deal economics
- At list price, monthly cash flow is $1k ($15k/yr) — positive.
- The deal already cash-flows at list — no discount required.
- Meets the 1% rule at list price ($3k rent vs $150k).
- Cap rate 16.0% vs local median 2.7% in Winter Gardens — top-decile yield for the area; either an underpriced asset or a hidden risk that comps aren't pricing in. Stress-test before assuming the spread holds.
Location & tenants
- Location reads 61/100 on livability (#515 in CA) — a middle-class / working-renter tenant base. Strengths: commute A+, employment A-, housing A-; Watch: schools C-, crime D-, amenities F.
- Lakeside Union Elementary (suburban): math 41% / reading 52% proficiency, ranked #480 of 1,400 in CA (top 34%) — families likely to look elsewhere, expect single-tenant / working-renter base with shorter leases.
- Market conditions: Rents soft (-0.8%/yr); 238 active listings in the ZIP; 20 comparable units currently listed for rent nearby; rentals leasing fast (median 2d on market — plan ~1-2 weeks tenant-placement turnaround); 11,759 units permitted in San Diego County in 2024 (7,244 in 5+ unit buildings).
- At $2,847/mo this rent would consume 46% of the median local household income ($74k/yr) (locally 4178% of renters already pay >50% of income on rent) — very limited rent-growth headroom before tenants either downsize or default.
Forward outlook
- Local home prices are declining (-3.0%/yr); year-one equity from $1k of loan paydown is wiped out by about $4k of value loss. Plan a longer hold.
- San Diego County population projected at +20% by 2050 — long-run rental-demand tailwind backs the buy-and-hold thesis.
- At projected returns (-3.0% appreciation + 0.0% rent growth), your $42k cash investment doubles in ~4 years — after that, you're playing with house money.
Negotiation context
- Only 5 days on market — expect competitive offers; lowballing is unlikely to land.
- 3 sale attempts since 3y ago with the ask held roughly flat each time — persistent listings suggest the price (not the market) is what's stuck; bring a comps-based counter.
- Current owner paid $100k; list at $150k implies a 50% gain — meaningful room to come down on a strong offer.
Risks & watch-outs
- Climate carrying-cost: moderate wildfire risk; extreme-heat days projected 5→14/yr by 2055 (HVAC capex compounding) — expect insurance premiums to compound above CPI over the hold.
Questions for the listing agent
- Built in 1966 — when were the roof, HVAC, electrical panel, plumbing, and water heater last replaced?
- Is there a deadline driving the sale (1031 exchange, divorce, estate, relocation)? That informs how much negotiation room exists.
- Crime grade is D in this area — have there been break-ins, vandalism, or insurance claims at this property in the last 3 years? What carrier currently insures it and at what premium?
- What's the average days-on-market for RENTAL listings here right now (not sales)? A rising rental-DOM trend means longer vacancies and softer asking-rent achievability than the comps imply.
- What's the recent tenant-quality profile in this submarket — average credit score on applications, eviction rate, late-payment / NSF rate, and stable-employment percentage? A property-management company in the area should have these aggregated.
- How much new for-sale + rental construction is in the pipeline within 1–3 miles? Heavy new supply typically softens prices + rents 12–24 months out; constrained supply supports both.
Investment metrics
- 1% rule
- 1.90% ✓
- Cap rate
- 15.99%
- Cash-on-cash
- 34.64%
- DSCR
- 2.54
- GRM
- 4.4
CMA / ARV
- ARV (on-the-fly)
- $209,760
- Comps found
- 12
Show comp detail 12 sales within ~0.75 mi
| Address | Dist | Beds/Ba | Sqft | Sold | Price | $/sf | Match |
|---|---|---|---|---|---|---|---|
| 1351 Pepper Dr #18 | 0.38mi | 2/2.0 (-1) | 1,140 (0%) | 3mo | $184,000 | $161 | 75 |
| 12044 Royal Rd #63 | 0.00mi | 3/2.0 | 1,000 (-12%) | 5mo | $257,321 | $257 | 75 |
| 1351 Pepper Dr Spc 62 | 0.38mi | 2/2.0 (-1) | 1,056 (-7%) | 2mo | $226,900 | $215 | 63 |
| 1351 Pepper Dr #26 | 0.38mi | 2/2.0 (-1) | 1,200 (+5%) | 10mo | $160,000 | $133 | 61 |
| 12250 Vista Del Cajon Rd Spc 25 | 0.36mi | 2/2.0 (-1) | 1,275 (+12%) | 1mo | $235,000 | $184 | 58 |
| 1315 Pepper Dr #72 | 0.37mi | 2/2.0 (-1) | 1,220 (+7%) | 10mo | $194,000 | $159 | 57 |
| 12250 Vista Del Cajon Rd Spc 45 | 0.36mi | 3/2.0 | 1,248 (+10%) | 14mo | $183,000 | $147 | 56 |
| 12250 Vista Del Cajon Rd #17 | 0.39mi | 3/2.0 | 1,248 (+10%) | 14mo | $275,000 | $220 | 54 |
| 1315 Pepper Dr Spc 35 | 0.32mi | 4/2.0 (+1) | 1,248 (+10%) | 17mo | $290,000 | $232 | 50 |
| 1351 Pepper Dr Spc 40 | 0.38mi | 2/2.0 (-1) | 1,056 (-7%) | 20mo | $171,000 | $162 | 49 |
| 1120 Pepper Dr Spc 5 | 0.55mi | 2/2.0 (-1) | 1,200 (+5%) | 18mo | $140,000 | $117 | 46 |
| 8661 Winter Gardens Blvd #58 | 0.71mi | 2/2.0 (-1) | 1,080 (-5%) | 12mo | $265,000 | $245 | 43 |
Match score weights: distance 35% · size 25% · config 20% · recency 20%. Top-matched comps best support the ARV.
Projected returns pro-forma
-3.0% appreciation · 0.0% rent growth · sell at horizon
- IRR
- 26.7%
- Equity multiple
- 2.06×
- Total profit
- $44,617
- Equity at exit
- $22,365
- IRR
- 32.4%
- Equity multiple
- 3.53×
- Total profit
- $106,220
- Equity at exit
- $12,969
Cash invested: $42,000 (down + closing). Projections, not guarantees.
Landlord ↔ Tenant lean methodology
- Overall (STATE)
- 18 Strongly Tenant-Friendly
- State California
- 18 Strongly Tenant-Friendly · D+13
- County
- — inherits STATE
- City
- — inherits STATE
ZIP-level market 92021
- Rents YoY
- -0.8%
- Active inventory
- 238
- Price-to-rent
- 4.4×
Monthly cashflow live
- Estimated rent
- $2,847 high interval (Pro) →
- Mortgage (P&I)
- −$787
- Tax est. 1.5%
- −$188 /mo · $2,250/yr
- Insurance
- −$62
- HOA
- −$0
- Vacancy / Maint / Mgmt
- −$598
- Net cashflow
- $1,212
Break-even live
UW: 25.0% down · 7.5% · 30yr · 1.5% tax · 5.0% vac · 8.0% maint · 8.0% mgmt
Financing live
Cash to close
- Down payment
- $37,500
- Closing costs
- $4,500
- Reserves months
- —
- Total cash needed
- —
Loan-product check · same deal, 3 products live
Conventional
25% down · 7.5% · 30yr
- Down + closing
- —
- Monthly P&I
- —
- Monthly cashflow
- —
- DSCR
- —
- Eligible?
- —
Personal DTI + credit; lowest rate.
DSCR
20% down · 8.5% · 30yr
- Down + closing
- —
- Monthly P&I
- —
- Monthly cashflow
- —
- DSCR
- —
- Eligible?
- —
No personal income docs; deal must DSCR.
Hard money
10% down · 12.0% · 12mo
- Down + closing
- —
- Monthly P&I
- —
- Monthly cashflow
- —
- DSCR
- —
- Eligible?
- —
Short-term bridge; refi at stabilization.
Rent comps 20 comps
| Address | Beds | Baths | Sqft | Rent | $/sqft | DOM | Units | Dist |
|---|---|---|---|---|---|---|---|---|
| 8031 Winter Gardens Blvd El Cajon, CA | 3.0 | 2.0 | 1124 | $2,995 | $2.66 | 2d | 1 | 0.09mi |
| 8424 Pueblo Rd Unit 8424 Lakeside, CA | 3.0 | 1.0 | 1000 | $2,750 | $2.75 | 2d | 1 | 0.36mi |
| 12171 Winter Gardens Dr Lakeside, CA | 2.0 | 1.0 | 862 | $2,500 | $2.90 | 2d | 1 | 0.43mi |
| 1221 Oro St El Cajon, CA | 2.0 | 1.5 | 1020 | $2,575 | $2.52 | 2d | 1 | 0.95mi |
| 1696 Buckeye Dr El Cajon, CA | 3.0 | 1.0 | 942 | $2,900 | $3.08 | 2d | 1 | 1.03mi |
| 2000 E Main St El Cajon, CA | 3.0 | 1.5–2.5 | 1165 | $3,300 | $2.83 | 2d | 1 | 1.04mi |
| 1430 Diamond Ln El Cajon, CA | 2.0 | 1.0 | 863 | $2,695 | $3.12 | 2d | 1 | 1.06mi |
| 1314 5 D Dr Unit 1318 El Cajon, CA | 3.0 | 1.0 | 960 | $2,600 | $2.71 | 24d | 1 | 1.11mi |
| 1365 Broadway El Cajon, CA | 3.0 | 2.0 | 1000 | $3,478 | $3.48 | 2d | 1 | 1.15mi |
| 745 E Bradley Ave Unit 46 El Cajon, CA | 3.0 | 1.0 | 806 | $2,298 | $2.85 | 24d | 1 | 1.19mi |
| 1219 Denver Ln Unit 1465013P El Cajon, CA | 3.0 | 2.5 | 1194 | $8,558 | $7.17 | 21d | 1 | 1.27mi |
| 816 Oro St El Cajon, CA | 3.0 | 1.0 | 1235 | $3,400 | $2.75 | 2d | 1 | 1.35mi |
| 1294 N Mollison Ave El Cajon, CA | 1.0–2.0 | 1.0 | 750 | $2,128 | $2.84 | 2d | 8 | 1.37mi |
| 425 E Bradley Ave El Cajon, CA | 1.0–2.0 | 1.0 | 771 | $2,350 | $3.05 | 2d | 13 | 1.37mi |
| 360 E Bradley Ave El Cajon, CA | 3.0 | 2.0 | 1116 | $2,934 | $2.63 | 2d | 3 | 1.39mi |
| 1171 Marline Ave Unit 1171-A El Cajon, CA | 3.0 | 1.5 | 1141 | $3,100 | $2.72 | 2d | 1 | 1.42mi |
| 1050 Peach Ave El Cajon, CA | 2.0 | 2.0 | 850 | $3,460 | $4.07 | 5d | 1 | 1.43mi |
| 1038 Peach Ave El Cajon, CA | 2.0 | 1.5 | 850 | $1,978 | $2.33 | 2d | 4 | 1.45mi |
| 1005 N Mollison Ave El Cajon, CA | 2.0 | 1.0 | 750 | $2,195 | $2.93 | 2d | 1 | 1.47mi |
| 310 E Bradley Ave El Cajon, CA | 1.0–2.0 | 1.0 | 664 | $2,050 | $3.09 | 2d | 1 | 1.49mi |
Listing history 6 events
-
2026-06-18days on market $150,000 Active 5 DOM
-
2026-06-17days on market $150,000 Active 4 DOM
-
2026-06-16days on market $150,000 Active 3 DOM
-
2026-06-15days on market $150,000 Active 2 DOM
-
2026-06-13remarks 551-char remark
-
2026-06-13$150,000 Active 1 DOM
ⓘ Source: listings_history table (triggers on properties + properties_extension) + one-shot
backfill from property_details.listing_events for pre-trigger history.
Climate risk First Street
- Flood 1/10 Low FEMA zone X (unshaded) · 0% chance over 30 yrs
- Wildfire 5/10 Major
- Heat 5/10 Major 5 d/yr ≥98°F today · 14 d/yr by 30 yrs out
- Wind 1/10 Low
- Air quality 4/10 Moderate 6 unhealthy d/yr today · 7 by 30 yrs out
Nearby sold comps map
Loading sold comps map…
Walkable amenities ~0.75 mi
Loading nearby amenities…
Taxation est. · year 1
- Rental income
- $34,164
- − Mortgage interest
- −$8,402
- − Property taxes
- −$2,250
- − Insurance
- −$750
- − Repairs & maintenance
- −$2,733
- − Management
- −$2,733
- − Depreciation
- −$4,364
- Taxable income
- $12,931
- Est. tax owed @ 24.0%
- −$3,104
- After-tax cash flow
- $11,446/yr
For passive investors: Depreciation is non-cash, so a rental often shows a tax loss while cash-flowing — sheltering income. Rental losses are passive: they offset passive income freely, and up to $25,000/yr can offset ordinary (W-2) income if you actively participate and your MAGI is under $100k (phasing out to $0 by $150k); unused losses carry forward. On sale, claimed depreciation is recaptured at up to 25%, and gains may owe capital-gains tax (a 1031 exchange can defer both). Figures are a year-1 estimate at your 24.0% rate — not tax advice; consult a CPA.
Schools (NCES district)
- District
- Lakeside Union Elementary
- NCES district ID
- 0620790
- Math proficiency
- 41% ▬ 0.00%
- Reading proficiency
- 52% ▼ -1.00%
- Median HH income
- $65,574
- Composite
- 43.51/100
- National rank
- #6453
- State rank
- #480 of 1400 in CA
Livability — Winter Gardens
- Score
- 61/100
- State rank
- #515
- US rank
- #17448
Category grades
Schools grade is shown separately in the Schools card above.
Census & demographics
- Census place
- Winter Gardens, CA
- County
- San Diego County · 3,178,799 people
- Metro
- San Diego-Chula Vista-Carlsbad, CA
- Population (ZIP)
- 70,501
- Household income
- $74,013
- Rent vs Own
- Severe rent burden
- 4178.0
Population outlook (San Diego County) Hauer SSP2
- Today (2025)
- 3,678,185 people
- By 2030
- 3,856,546 · +4.8%
- By 2040
- 4,171,407 · +13.4%
- By 2050
- 4,421,607 · +20.2%
- By 2075
- 4,831,599 · +31.4%
- By 2100
- 4,832,502 · +31.4%
Race, ethnicity, and origin ACS 2023
- Neighborhood character
- Diverse neighborhood (Simpson 0.62)
- Race & ethnicity
- White 54% Hispanic / Latino 28% Two or more races 14% Black 6% Asian 5% Native American 2%
- Hispanic origin (detail)
- Mexican 24%
- Common ancestry
- Arab 6% Italian 2% Lithuanian 2%
- Foreign-born
- 22% · Canada
- Languages at home
- 65% English-only · Spanish 18% Arabic 7% Other Indo-European 3%
Political lean MEDSL · San Diego
- 2024 margin
- D (+16.8) · D 56.9% · R 40.1% · Other 2.9%
- 2008→2024 swing
- +6.6pp toward D · 2008: 10.2pp · 2024: 16.8pp
- All cycles
- 2024: D+16.8 2020: D+22.8 2016: D+17.8 2012: D+5.1 2008: D+10.2
Not yet ingested
- Civics
- —
Market trends
- HPI YoY
- ▼ -654.88%
- Current HPI
- 335.0617
- Rent YoY
- ▼ -0.83%
- Metro
- San Diego-Chula Vista-Carlsbad, CA
- State GDP YoY
- ▲ 3.21%
- F500 in state
- 116
Industry mix (Fortune 500 HQ in CA)
| Industry | F500 HQs | Revenue |
|---|---|---|
| Technology | 27 | $1,492B |
|
||
| Financial Services | 3 | $174B |
|
||
| Retail | 3 | $44B |
|
||
| Insurance | 3 | $26B |
|
||
| Media / Entertainment | 2 | $115B |
|
||
| Pharmaceuticals / Biotech | 2 | $62B |
|
||
Price history
+50.0% since first listed7 events — show timeline
- 2026-06-12 Listed $150,000 SDMLS
- 2026-03-16 Listing Removed — SDMLS
- 2026-02-18 Listed $99,000 SDMLS
- 2023-07-14 Sold (MLS) $100,000 CRMLS
- 2023-07-12 Pending — CRMLS
- 2023-06-21 Contingent — CRMLS
- 2023-05-09 Listed $99,997 CRMLS
Property tax history
+3.7%/yrLatest (2013): $203 · +3.9% YoY. Source: county tax records.
Cash-flow waterfall
monthlySold comps — $/sqft
last 12 mo · ≤1 miLoading sold comps…