 Duplex
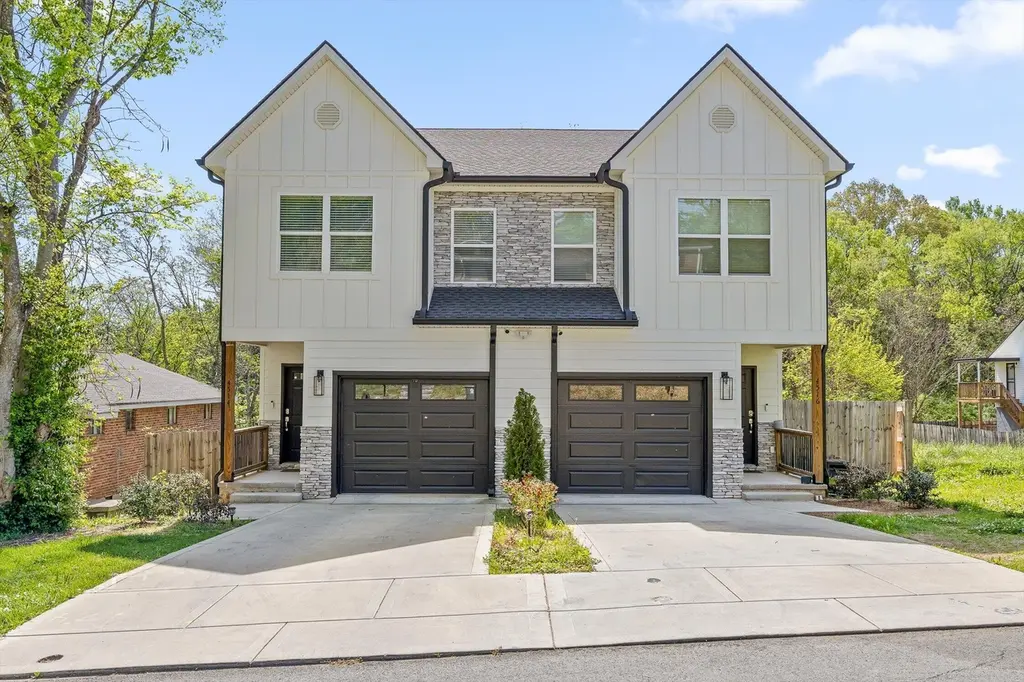
4514/ 4516 Oakland Ave · Chattanooga, TN
Flood risk 4/10 · Minor
- FEMA flood zone
- X (unshaded)
- Chance of flooding over 30 yrs
- 0.22%
- Est. flood insurance / yr
- $507 – $1,088
Fire risk 4/10 · Minor
- Est. fire insurance / yr
- $949 – $1,763
Heat risk 6/10 · Moderate
- Hot days now (above 106°F)
- 7 days/yr
- Hot days in 30 yrs
- 21 days/yr
Wind risk 4/10 · Minor
- Chance of severe wind over 30 yrs
- 11.0%
Air-quality risk 3/10 · Minor
- Unhealthy air days now
- 2 days/yr
- Unhealthy air days in 30 yrs
- 2 days/yr
Risk factors via First Street. Map © Google.
Why this score? — see what drove the F grade
The composite is a weighted blend of 9 inputs, each scored 0–100. Each bar is that input's sub-score; the figure is the points it added to the 100-point composite (weight × sub-score).
- ARV discount +7.5/15.0
- Appreciation +5.7/10.0
- Cash flow +4.6/30.0
- Livability +3.9/5.0
- Schools +2.7/10.0
- Rent growth +2.5/5.0
- Condition / age +2.5/5.0
- 1% rule +0.0/10.0
- DSCR +0.0/10.0
$585,000
🖨 Deal sheet 📄 Offer letter ✓ Due diligence
Multi-family units
County records classify this as Multi-Family (2-4 Unit). Listing-text estimate: 2 units. confirmed
Listing remarks
Turnkey income-producing duplex averaging $6,631/month in gross revenue. Built in 2023, this newer-construction townhome duplex offers two spacious 3BR/2.5BA units loaded with modern finishes: granite countertops, stainless appliances, large kitchen islands, LVP flooring, covered back decks, and 1-car garages. Unit 1 is stabilized on a 2-year lease at $2,500/month. Unit 2 is a high-performing furnished short-term vacation rental (STVR) generating over $4,100/month gross -- furnishings negotiable. Both units feature professionally landscaped, fenced backyard spaces and carry EPB Smart Build certification for energy efficiency. Can be delivered furnished for a true plug-and-play investment. L
Key facts
- 6,098 sq ft lot
- 2 garage spots
- Built 2023
Neighborhood map
What this means for you Summary
Snapshot
- This is a 2 × 3.0-bed/2.5-bath units multifamily listed at $585k.
Deal economics
- At list price, monthly cash flow is $-1k ($-18k/yr) — negative. Per door: $-738/mo.
- To cash-flow at today's rent, offer at most $324k (44.6% below list).
- To meet the 1% rule (rent ≥ 1% of price), the offer needs to be $260k (55.6% below list).
- Recommended offer: $260k (55.6% below list) — sets the bar for 1% rule.
Location & tenants
- Location reads 78/100 on livability (#3 in TN, #2,582 nationally) — a middle-class / working-renter tenant base. Strengths: amenities A+, commute A+, cost of living A+; Watch: employment D+, crime F.
- Hamilton County (urban): math 31% / reading 31% proficiency, ranked #42 of 139 in TN (top 30%) — families likely to look elsewhere, expect single-tenant / working-renter base with shorter leases.
- Zoned schools: Orchard Knob Middle (math 5% / reading 6%, grade F, #291 of 333 statewide, top 88%, 334 students, 0% FRL) — zoned schools average 0% FRL vs 52% district-wide (52 pts lower); this property's tenant base skews higher-income than the district average.
- Zoned-school proficiency averages 6% at this address vs 31% district-wide (-26 pts) — the specific schools serving this property underperform the Hamilton County average; the district grade overstates school quality for this exact location.
- Market conditions: 61 active listings in the ZIP; lower-income renter base — watch delinquency; 2,133 units permitted in Hamilton County in 2024 (405 in 5+ unit buildings).
- At $2,597/mo this rent would consume 109% of the median local household income ($29k/yr) (locally 406% of renters already pay >50% of income on rent) — very limited rent-growth headroom before tenants either downsize or default.
Forward outlook
- In year one you build about $12k of equity ($4k loan paydown + $8k appreciation (1.3% local appreciation)).
- Hamilton County population projected at +23% by 2050 — long-run rental-demand tailwind backs the buy-and-hold thesis.
- By year 4, paydown + projected appreciation supports a ~$42k cash-out refi (75% LTV) — recoverable capital for the next deal without selling this one.
Negotiation context
- Only 4 days on market — expect competitive offers; lowballing is unlikely to land.
- 4 sale attempts since 3y ago with the ask held roughly flat each time — persistent listings suggest the price (not the market) is what's stuck; bring a comps-based counter.
Risks & watch-outs
- Climate carrying-cost: extreme-heat days projected 7→21/yr by 2055 (HVAC capex compounding) — expect insurance premiums to compound above CPI over the hold.
Questions for the listing agent
- What do current leases actually rent for vs. the listed asking? Can we see a recent rent roll and the last 12 months of T-12 income?
- Can we see the unit-by-unit rent roll, current vacancy, and any below-market leases? What's the average tenancy length?
- What capital expenditures (roof, boiler, parking lot, exteriors) have been made in the last 5 years, and what's planned in the next 2?
- Is there a deadline driving the sale (1031 exchange, divorce, estate, relocation)? That informs how much negotiation room exists.
- Schools are F-rated, which usually means shorter tenancies and higher turnover. Who's the typical renter profile here, and what's been the actual vacancy rate?
- Crime grade is F in this area — have there been break-ins, vandalism, or insurance claims at this property in the last 3 years? What carrier currently insures it and at what premium?
- The area grade is low — what's the realistic commute time and amenity access for the typical tenant pool here? Any planned neighborhood developments (good or bad) we should know about?
- What's the average days-on-market for RENTAL listings here right now (not sales)? A rising rental-DOM trend means longer vacancies and softer asking-rent achievability than the comps imply.
- What's the recent tenant-quality profile in this submarket — average credit score on applications, eviction rate, late-payment / NSF rate, and stable-employment percentage? A property-management company in the area should have these aggregated.
- How much new apartment / multifamily construction is in the pipeline within 1–3 miles? Heavy new supply (>2% of stock underway) typically softens rents 12–24 months out; light construction supports rent growth.
Investment metrics
- 1% rule
- 0.44% ✗
- Cap rate
- 3.27%
- Cash-on-cash
- -10.81%
- DSCR
- 0.52
- GRM
- 18.8
CMA / ARV
No comps found within radius.
Projected returns pro-forma
1.33% appreciation · 3.0% rent growth · sell at horizon
- IRR
- -8.7%
- Equity multiple
- 0.55×
- Total profit
- $-73,746
- Equity at exit
- $209,928
- IRR
- -3.1%
- Equity multiple
- 0.61×
- Total profit
- $-64,552
- Equity at exit
- $287,055
Cash invested: $163,800 (down + closing). Projections, not guarantees.
Landlord ↔ Tenant lean methodology
- Overall (STATE)
- 87 Strongly Landlord-Friendly
- State Tennessee
- 87 Strongly Landlord-Friendly · R+13
- County
- — inherits STATE
- City
- — inherits STATE
ZIP-level market 37410
- Home prices YoY
- 0.6%
- Active inventory
- 61
- Price-to-rent
- 37.5×
Monthly cashflow live
- Estimated rent
- $2,597 high interval (Pro) →
- Mortgage (P&I)
- −$3,068
- Tax from tax record
- −$216 /mo · $2,594/yr
- Insurance
- −$244
- HOA
- −$0
- Vacancy / Maint / Mgmt
- −$545
- Net cashflow
- $-1,476
Break-even live
2-unit breakdown (identical units grouped — click to expand)
| Units | Beds | Baths | Est. rent |
|---|---|---|---|
| 2× units | 3.0 | 2.5 | $2,598 |
| #1 | 3.0 | 2.5 | $1,299 |
| #2 | 3.0 | 2.5 | $1,299 |
| Total (2 units) | $2,597 | ||
UW: 25.0% down · 7.5% · 30yr · 1.5% tax · 5.0% vac · 8.0% maint · 8.0% mgmt
Financing live
Cash to close
- Down payment
- $146,250
- Closing costs
- $17,550
- Reserves months
- —
- Total cash needed
- —
Loan-product check · same deal, 3 products live
Conventional
25% down · 7.5% · 30yr
- Down + closing
- —
- Monthly P&I
- —
- Monthly cashflow
- —
- DSCR
- —
- Eligible?
- —
Personal DTI + credit; lowest rate.
DSCR
20% down · 8.5% · 30yr
- Down + closing
- —
- Monthly P&I
- —
- Monthly cashflow
- —
- DSCR
- —
- Eligible?
- —
No personal income docs; deal must DSCR.
Hard money
10% down · 12.0% · 12mo
- Down + closing
- —
- Monthly P&I
- —
- Monthly cashflow
- —
- DSCR
- —
- Eligible?
- —
Short-term bridge; refi at stabilization.
Listing history 17 events
-
2026-04-11status Pending
-
2026-04-07$585,000 Active
-
2024-01-19soldstatus $525,000
-
2023-12-14historical Active Under Contract
-
2023-12-14historical $2,300
-
2023-12-14historical
-
2023-12-11price $550,000
-
2023-11-15price $575,000
-
2023-11-11$2,300
-
2023-11-02price $299,000
-
2023-11-02price $595,000
-
2023-11-02price $299,000
-
2023-10-18price $625,000
-
2023-10-04$365,000 Active
-
2023-10-04$675,000 Active
-
2023-05-26price $365,000
-
2022-03-29soldstatus $1,200,000
ⓘ Source: listings_history table (triggers on properties + properties_extension) + one-shot
backfill from property_details.listing_events for pre-trigger history.
Tax reassessment forecast TN · Resets to sale price
- Current annual tax
- $2,594 · $216/mo
- Projected year-2 tax
- $4,154 · $346/mo
- Expected delta
- +$1,559/yr (+$130/mo · 60.1%)
ⓘ Screening estimate from a state-policy table — verify with the county assessor before closing.
Climate risk First Street
- Flood 4/10 Moderate FEMA zone X (unshaded) · 22% chance over 30 yrs
- Wildfire 4/10 Moderate
- Heat 6/10 Major 7 d/yr ≥106°F today · 21 d/yr by 30 yrs out
- Wind 4/10 Moderate 11% chance of damaging wind over 30 yrs
- Air quality 3/10 Moderate 2 unhealthy d/yr today · 2 by 30 yrs out
Nearby sold comps map
Loading sold comps map…
Walkable amenities ~0.75 mi
Loading nearby amenities…
Taxation est. · year 1
- Rental income
- $31,164
- − Mortgage interest
- −$32,769
- − Property taxes
- −$2,594
- − Insurance
- −$2,925
- − Repairs & maintenance
- −$2,493
- − Management
- −$2,493
- − Depreciation
- −$17,018
- Taxable loss
- −$29,129
- Est. tax savings @ 24.0%
- +$6,991
- After-tax cash flow
- $-10,722/yr
For passive investors: Depreciation is non-cash, so a rental often shows a tax loss while cash-flowing — sheltering income. Rental losses are passive: they offset passive income freely, and up to $25,000/yr can offset ordinary (W-2) income if you actively participate and your MAGI is under $100k (phasing out to $0 by $150k); unused losses carry forward. On sale, claimed depreciation is recaptured at up to 25%, and gains may owe capital-gains tax (a 1031 exchange can defer both). Figures are a year-1 estimate at your 24.0% rate — not tax advice; consult a CPA.
Schools (NCES district)
- District
- Hamilton County
- NCES district ID
- 4701590
- Math proficiency
- 31% ▼ -10.00%
- Reading proficiency
- 31% ▼ -3.00%
- Median HH income
- $47,456
- Composite
- 26.8/100
- National rank
- #7122
- State rank
- #42 of 139 in TN
Livability — Chattanooga
- Score
- 78/100
- State rank
- #3
- US rank
- #2582
Category grades
Schools grade is shown separately in the Schools card above.
Census & demographics
- Census place
- Chattanooga, TN
- County
- Hamilton County · 312,777 people
- City population
- 131,999
- Metro
- Chattanooga, TN-GA
- Population (ZIP)
- 4,129
- Household income
- $28,708
- Rent vs Own
- Severe rent burden
- 406.0
Population outlook (Hamilton County) Hauer SSP2
- Today (2025)
- 393,784 people
- By 2030
- 412,983 · +4.9%
- By 2040
- 449,502 · +14.1%
- By 2050
- 484,341 · +23.0%
- By 2075
- 565,746 · +43.7%
- By 2100
- 618,394 · +57.0%
Race, ethnicity, and origin ACS 2023
- Neighborhood character
- Predominantly Black (81%)
- Race & ethnicity
- Black 81% Two or more races 10% White 8% Hispanic / Latino 7%
- Hispanic origin (detail)
- Mexican 2%
- Common ancestry
- Scotch-Irish 1%
- Foreign-born
- 6% · Canada
- Languages at home
- 94% English-only · Spanish 6%
Political lean MEDSL · Hamilton
- 2024 margin
- R (+13.1) · D 42.7% · R 55.7% · Other 1.6%
- 2008→2024 swing
- -1.2pp toward R · 2008: -11.8pp · 2024: -13.1pp
- All cycles
- 2024: R+13.1 2020: R+9.7 2016: R+16.6 2012: R+14.8 2008: R+11.8
Not yet ingested
- Civics
- —
Market trends
- HPI YoY
- ▲ 1.33%
- Current HPI
- 228.3522
- Rent YoY
- —
- Metro
- Chattanooga, TN-GA
- State GDP YoY
- ▲ 2.78%
- F500 in state
- 22
Industry mix (Fortune 500 HQ in TN)
| Industry | F500 HQs | Revenue |
|---|---|---|
| Healthcare | 3 | $91B |
|
||
| Retail | 3 | $72B |
|
||
| Transportation / Logistics | 1 | $88B |
|
||
| Paper / Packaging | 1 | $19B |
|
||
| Insurance | 1 | $13B |
|
||
| Energy | 1 | $12B |
|
||
Price history
-51.2% since first listed17 events — show timeline
- 2026-04-11 Pending — GCAR
- 2026-04-07 Listed $585,000 GCAR
- 2024-01-19 Sold (Public Records) $525,000 Public Records
- 2023-12-14 Contingent — REALTRACS as Distributed by MLS Grid
- 2023-12-14 Rental Removed $2,300 APPFOLIO
- 2023-12-14 Listing Removed — REALTRACS as Distributed by MLS Grid
- 2023-12-11 Price Changed $550,000 REALTRACS as Distributed by MLS Grid
- 2023-11-15 Price Changed $575,000 REALTRACS as Distributed by MLS Grid
- 2023-11-11 Listed for Rent $2,300 APPFOLIO
- 2023-11-02 Price Changed $299,000 GCAR
- 2023-11-02 Price Changed $595,000 REALTRACS as Distributed by MLS Grid
- 2023-11-02 Price Changed $299,000 REALTRACS as Distributed by MLS Grid
- 2023-10-18 Price Changed $625,000 REALTRACS as Distributed by MLS Grid
- 2023-10-04 Listed $675,000 REALTRACS as Distributed by MLS Grid
- 2023-10-04 Listed $365,000 REALTRACS as Distributed by MLS Grid
- 2023-05-26 Price Changed $365,000 GCAR
- 2022-03-29 Sold (Public Records) $1,200,000 Public Records
Property tax history
+84.5%/yrLatest (2025): $2,594 · -5.6% YoY. Source: county tax records.
Cash-flow waterfall
monthlySold comps — $/sqft
last 12 mo · ≤1 miLoading sold comps…