 Multi-family
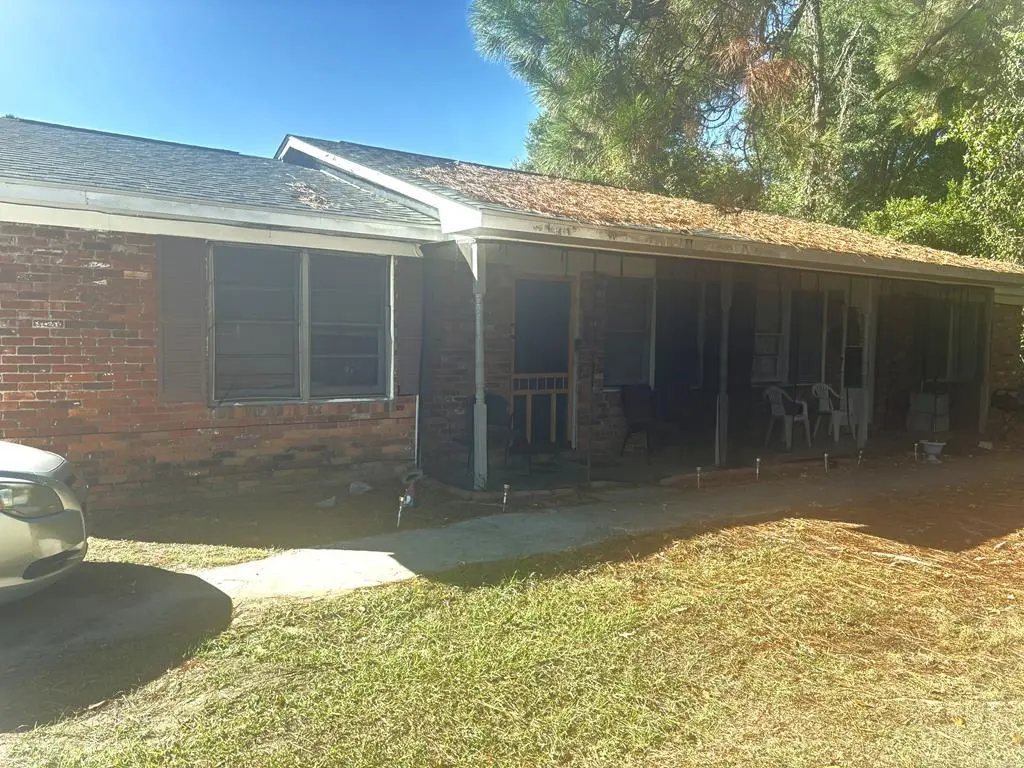
939 Pembrook Dr · Columbus, GA
Flood risk 1/10 · Minimal
- FEMA flood zone
- X (unshaded)
- Chance of flooding over 30 yrs
- 0.0%
- Est. flood insurance / yr
- $507 – $1,088
Fire risk 1/10 · Minimal
- Est. fire insurance / yr
- $963 – $1,789
Heat risk 8/10 · Major
- Hot days now (above 107°F)
- 7 days/yr
- Hot days in 30 yrs
- 20 days/yr
Wind risk 6/10 · Moderate
- Chance of severe wind over 30 yrs
- 76.0%
Air-quality risk 4/10 · Minor
- Unhealthy air days now
- 5 days/yr
- Unhealthy air days in 30 yrs
- 6 days/yr
Risk factors via First Street. Map © Google.
Why this score? — see what drove the B- grade
The composite is a weighted blend of 9 inputs, each scored 0–100. Each bar is that input's sub-score; the figure is the points it added to the 100-point composite (weight × sub-score).
- Cash flow +30.0/30.0
- DSCR +10.0/10.0
- 1% rule +9.3/10.0
- ARV discount +7.5/15.0
- Rent growth +3.7/5.0
- Livability +3.2/5.0
- Condition / age +2.5/5.0
- Schools +2.2/10.0
- Appreciation +0.0/10.0
$129,900
🖨 Deal sheet 📄 Offer letter ✓ Due diligence
Multi-family units
County records classify this as Multi-Family (2-4 Unit). Listing-text estimate: 1 unit. estimate disagrees with records
Listing remarks MLS
Great investment opportunity with two occupied units. Each unit has two bedrooms and a bathroom. The stoves and refrigerators to stay. Roof is two years old. Water heater in one unit is two years old.
Key facts
- 7,500 sq ft lot
- Listed 239 days
Neighborhood map
What this means for you Summary
Snapshot
- This is a 4-bed/2.0-bath multifamily listed at $130k.
Deal economics
- At list price, monthly cash flow is $567 ($7k/yr) — positive.
- The deal already cash-flows at list — no discount required.
- Meets the 1% rule at list price ($2k rent vs $130k).
- Recommended offer: $114k (12.0% below list) — sets the bar for market timing.
- Cap rate 11.5% vs local median 4.7% in Columbus — top-decile yield for the area; either an underpriced asset or a hidden risk that comps aren't pricing in. Stress-test before assuming the spread holds.
Location & tenants
- Location reads 64/100 on livability (#254 in GA) — a middle-class / working-renter tenant base. Strengths: cost of living A+, housing A+, health & safety B; Watch: amenities D+, schools F, crime F.
- Muscogee County (urban): math 21% / reading 30% proficiency, ranked #120 of 174 in GA (top 69%) — low school quality limits family demand, transient renter base, plan for 1-2y turnover; 61% free/reduced lunch — lower-income household profile, screen leases tightly.
- Market conditions: Rents rising fast (+4.8%/yr); 256 active listings in the ZIP; 32 comparable units currently listed for rent nearby; rentals at typical pace (median 21d on market — plan ~3-4 weeks tenant-placement turnaround); 291 units permitted in Muscogee County in 2024 (30 in 5+ unit buildings).
- This rent runs 41% of the median local income ($54k/yr) — at the standard rent-burdened threshold; future hikes will face affordability resistance.
Forward outlook
- Local home prices are declining (-3.0%/yr); year-one equity from $898 of loan paydown is wiped out by about $4k of value loss. Plan a longer hold.
- Muscogee County population projected at +15% by 2050 — modest demand growth; plan on rents tracking national, not racing it.
- At projected returns (-3.0% appreciation + 4.8% rent growth), your $36k cash investment doubles in ~6 years — after that, you're playing with house money.
Negotiation context
- It's been on market 239 days — a 12% lower offer ($114k) is reasonable based on typical stale-listing flexibility.
- 2 sale attempts since 6y ago with the ask held roughly flat each time — persistent listings suggest the price (not the market) is what's stuck; bring a comps-based counter.
- Current owner paid $68k; list at $130k implies a 92% gain — meaningful room to come down on a strong offer.
Risks & watch-outs
- Climate carrying-cost: major wind risk, 76% chance of damaging wind over 30y; extreme-heat days projected 7→20/yr by 2055 (HVAC capex compounding) — expect insurance premiums to compound above CPI over the hold.
Questions for the listing agent
- It's been on market 239 days. Have you received any prior offers? Is the seller open to a 12% concession, seller financing, or rate buy-down credit?
- Built in 1967 — when were the roof, HVAC, electrical panel, plumbing, and water heater last replaced?
- Why hasn't it sold? Are there any deal-killer items the seller is aware of (foundation, flood, title, zoning, code violations)?
- Is there a deadline driving the sale (1031 exchange, divorce, estate, relocation)? That informs how much negotiation room exists.
- Schools are F-rated, which usually means shorter tenancies and higher turnover. Who's the typical renter profile here, and what's been the actual vacancy rate?
- Crime grade is F in this area — have there been break-ins, vandalism, or insurance claims at this property in the last 3 years? What carrier currently insures it and at what premium?
- What's the average days-on-market for RENTAL listings here right now (not sales)? A rising rental-DOM trend means longer vacancies and softer asking-rent achievability than the comps imply.
- What's the recent tenant-quality profile in this submarket — average credit score on applications, eviction rate, late-payment / NSF rate, and stable-employment percentage? A property-management company in the area should have these aggregated.
- How much new apartment / multifamily construction is in the pipeline within 1–3 miles? Heavy new supply (>2% of stock underway) typically softens rents 12–24 months out; light construction supports rent growth.
Investment metrics
- 1% rule
- 1.43% ✓
- Cap rate
- 11.53%
- Cash-on-cash
- 18.71%
- DSCR
- 1.83
- GRM
- 5.8
CMA / ARV
- ARV (median comp)
- $79,288
- List price
- $129,900
- Delta
- 63.83%
- Verdict
- OVERPRICED
- Comps
- 11 within 2.0 mi
Projected returns pro-forma
-3.0% appreciation · 4.82% rent growth · sell at horizon
- IRR
- 12.5%
- Equity multiple
- 1.51×
- Total profit
- $18,546
- Equity at exit
- $19,369
- IRR
- 22.8%
- Equity multiple
- 3.13×
- Total profit
- $77,468
- Equity at exit
- $11,231
Cash invested: $36,372 (down + closing). Projections, not guarantees.
Landlord ↔ Tenant lean methodology
- Overall (STATE)
- 90 Strongly Landlord-Friendly
- State Georgia
- 90 Strongly Landlord-Friendly · R+3
- County
- — inherits STATE
- City
- — inherits STATE
ZIP-level market 31907
- Rents YoY
- 4.8%
- Active inventory
- 256
- Price-to-rent
- 11.7×
Monthly cashflow live
- Estimated rent
- $1,852 medium interval (Pro) →
- Mortgage (P&I)
- −$681
- Tax from tax record
- −$161 /mo · $1,928/yr
- Insurance
- −$54
- HOA
- −$0
- Vacancy / Maint / Mgmt
- −$389
- Net cashflow
- $567
Break-even live
2-unit breakdown (identical units grouped — click to expand)
| Units | Beds | Baths | Est. rent |
|---|---|---|---|
| 2× units | 2 | 1 | $1,852 |
| #1 | 2 | 1 | $926 |
| #2 | 2 | 1 | $926 |
| Total (2 units) | $1,852 | ||
UW: 25.0% down · 7.5% · 30yr · 1.5% tax · 5.0% vac · 8.0% maint · 8.0% mgmt
Financing live
Cash to close
- Down payment
- $32,475
- Closing costs
- $3,897
- Reserves months
- —
- Total cash needed
- —
Loan-product check · same deal, 3 products live
Conventional
25% down · 7.5% · 30yr
- Down + closing
- —
- Monthly P&I
- —
- Monthly cashflow
- —
- DSCR
- —
- Eligible?
- —
Personal DTI + credit; lowest rate.
DSCR
20% down · 8.5% · 30yr
- Down + closing
- —
- Monthly P&I
- —
- Monthly cashflow
- —
- DSCR
- —
- Eligible?
- —
No personal income docs; deal must DSCR.
Hard money
10% down · 12.0% · 12mo
- Down + closing
- —
- Monthly P&I
- —
- Monthly cashflow
- —
- DSCR
- —
- Eligible?
- —
Short-term bridge; refi at stabilization.
Rent comps 32 comps
| Address | Beds | Baths | Sqft | Rent | $/sqft | DOM | Units | Dist |
|---|---|---|---|---|---|---|---|---|
| 920 Rosewood Dr Columbus, GA | 4.0 | 1.0 | 1325 | $1,350 | $1.02 | 20d | 1 | 0.36mi |
| 3911 Steam Mill Rd Columbus, GA | 1.0–3.0 | 1.0–2.0 | 959 | $1,200 | $1.25 | 13d | 12 | 0.48mi |
| 3503 Ruben St Columbus, GA | 4.0 | 1.0 | 1054 | $1,100 | $1.04 | 13d | 1 | 0.61mi |
| 3775 Steam Mill Rd Columbus, GA | 3.0 | 2.0 | 1613 | $2,100 | $1.30 | 43d | 1 | 0.62mi |
| 800 Goodson Dr Columbus, GA | 4.0 | 1.0 | 1012 | $1,225 | $1.21 | 20d | 1 | 0.73mi |
| 3309 10th St Columbus, GA | 3.0 | 1.0 | 1080 | $950 | $0.88 | 43d | 1 | 0.84mi |
| 1507 Celia Dr Columbus, GA | 3.0 | 1.0 | 1000 | $1,050 | $1.05 | 13d | 1 | 0.86mi |
| 1537 Celia Dr Columbus, GA | 3.0 | 1.0 | 1139 | $975 | $0.86 | 20d | 1 | 0.89mi |
| 1400 Boxwood Blvd Columbus, GA | 2.0–3.0 | 2.0 | 1262 | $1,355 | $1.07 | 13d | 6 | 0.89mi |
| 3128 Carver St Columbus, GA | 3.0 | 1.0 | 988 | $925 | $0.94 | 20d | 1 | 0.96mi |
| 3128 Carver St Columbus, GA | 3.0 | 1.0 | 988 | $1,000 | $1.01 | 43d | 1 | 0.96mi |
| 3122 Baldwin St Columbus, GA | 5.0 | 2.0 | 1780 | $1,500 | $0.84 | 20d | 1 | 1.00mi |
| 527 Englewood Dr Columbus, GA | 3.0 | 2.0 | 1469 | $1,450 | $0.99 | 13d | 1 | 1.01mi |
| 441 Braselman Ave Columbus, GA | 3.0 | 1.5 | 1150 | $1,250 | $1.09 | 43d | 1 | 1.03mi |
| 1719 Celia Dr Columbus, GA | 3.0 | 2.0 | 1249 | $1,100 | $0.88 | 43d | 1 | 1.03mi |
| 1917 Watkins Dr Columbus, GA | 3.0 | 1.0 | 1323 | $1,200 | $0.91 | 43d | 1 | 1.08mi |
| 3552 Irwin Way Columbus, GA | 4.0 | 2.0 | 1536 | $1,725 | $1.12 | 13d | 1 | 1.12mi |
| 2944 10th St Columbus, GA | 3.0 | 1.0 | 1550 | $925 | $0.60 | 13d | 1 | 1.14mi |
| 1519 Baker St Columbus, GA | 3.0 | 1.0 | 1088 | $1,150 | $1.06 | 20d | 1 | 1.20mi |
| 1502 Baker St Columbus, GA | 4.0 | 2.5 | 1225 | $1,300 | $1.06 | 13d | 1 | 1.21mi |
| 4970 Gardiner Dr Columbus, GA | 3.0 | 2.0 | 1412 | $1,400 | $0.99 | 43d | 1 | 1.30mi |
| 4135 Forrest Rd Columbus, GA | 3.0 | 2.0 | 912 | $1,375 | $1.51 | 13d | 1 | 1.31mi |
| 2834 Mimosa St Columbus, GA | 3.0 | 1.5 | 1257 | $1,100 | $0.88 | 43d | 1 | 1.34mi |
| 2801 Fern St Columbus, GA | 3.0 | 1.0 | 1100 | $975 | $0.89 | 43d | 1 | 1.38mi |
| 2750 Mimosa St Columbus, GA | 3.0 | 1.5 | 1357 | $1,250 | $0.92 | 13d | 1 | 1.38mi |
| 407 Ocean Ave Columbus, GA | 3.0 | 2.0 | 1319 | $1,595 | $1.21 | 43d | 1 | 1.40mi |
| 2728 9th St Columbus, GA | 3.0 | 1.0 | 880 | $865 | $0.98 | 43d | 1 | 1.40mi |
| 4832 Wellborn Dr Columbus, GA | 3.0 | 2.0 | 1000 | $1,300 | $1.30 | 13d | 1 | 1.43mi |
| 4313 Sims St Columbus, GA | 4.0 | 1.5 | 1309 | $1,400 | $1.07 | 13d | 1 | 1.44mi |
| 4265 Adams St Columbus, GA | 3.0 | 1.0 | 1054 | $995 | $0.94 | 43d | 1 | 1.45mi |
| 419 Mount Pleasant Dr Columbus, GA | 3.0 | 1.5 | 1225 | $950 | $0.78 | 13d | 1 | 1.47mi |
| 564 Chesterfield Ave Columbus, GA | 3.0 | 2.0 | 1230 | $1,100 | $0.89 | 20d | 1 | 1.49mi |
Listing history 22 events
-
2026-06-18days on market $129,900 Active 239 DOM
-
2026-06-17days on market $129,900 Active 238 DOM
-
2026-06-16days on market $129,900 Active 237 DOM
-
2026-06-15days on market $129,900 Active 236 DOM
-
2026-06-14days on market $129,900 Active 234 DOM
-
2026-06-13days on market $129,900 Active 233 DOM
-
2026-06-10days on market $129,900 Active 231 DOM
-
2026-06-09days on market $129,900 Active 230 DOM
-
2026-06-08days on market $129,900 Active 229 DOM
-
2026-06-07days on market $129,900 Active 228 DOM
-
2026-06-05days on market $129,900 Active 225 DOM
-
2026-06-03days on market $129,900 Active 224 DOM
-
2026-06-02days on market $129,900 Active 223 DOM
-
2026-06-01days on market $129,900 Active 222 DOM
-
2026-05-31days on market $129,900 Active 221 DOM
-
2026-05-30days on market $129,900 Active 220 DOM
-
2025-10-22$129,900 Active 200-char remark
Show marketing remark (200 chars)
Great investment opportunity with two occupied units. Each unit has two bedrooms and a bathroom. The stoves and refrigerators to stay. Roof is two years old. Water heater in one unit is two years old.
-
2022-04-14price $695
-
2020-07-14soldstatus $67,800
-
2020-07-13soldstatus $67,750 290-char remark
Show marketing remark (290 chars)
Gross Rent $990 per month. Great cash flow property. Two wonderful long term tenants. New one year leases on unit 1 as of 5/14/2020. Each unit is 2/1. Unit 1 has been freshly updated with new carpet, paint and repairs. The building is all brick with attached exterior storage/laundry rooms.
-
2020-05-14$69,500 290-char remark
Show marketing remark (290 chars)
Gross Rent $990 per month. Great cash flow property. Two wonderful long term tenants. New one year leases on unit 1 as of 5/14/2020. Each unit is 2/1. Unit 1 has been freshly updated with new carpet, paint and repairs. The building is all brick with attached exterior storage/laundry rooms.
-
2017-08-31soldstatus $55,000
ⓘ Source: listings_history table (triggers on properties + properties_extension) + one-shot
backfill from property_details.listing_events for pre-trigger history.
Tax reassessment forecast GA · Resets to sale price
- Current annual tax
- $1,928 · $161/mo
- Projected year-2 tax
- $1,928 · $161/mo
- Expected delta
- $0/yr ($0/mo · 0.0%)
ⓘ Screening estimate from a state-policy table — verify with the county assessor before closing.
Climate risk First Street
- Flood 1/10 Low FEMA zone X (unshaded) · 0% chance over 30 yrs
- Wildfire 1/10 Low
- Heat 8/10 Severe 7 d/yr ≥107°F today · 20 d/yr by 30 yrs out
- Wind 6/10 Major 76% chance of damaging wind over 30 yrs
- Air quality 4/10 Moderate 5 unhealthy d/yr today · 6 by 30 yrs out
Nearby sold comps map
Loading sold comps map…
Walkable amenities ~0.75 mi
Loading nearby amenities…
Taxation est. · year 1
- Rental income
- $22,224
- − Mortgage interest
- −$7,276
- − Property taxes
- −$1,928
- − Insurance
- −$650
- − Repairs & maintenance
- −$1,778
- − Management
- −$1,778
- − Depreciation
- −$3,779
- Taxable income
- $5,035
- Est. tax owed @ 24.0%
- −$1,208
- After-tax cash flow
- $5,596/yr
For passive investors: Depreciation is non-cash, so a rental often shows a tax loss while cash-flowing — sheltering income. Rental losses are passive: they offset passive income freely, and up to $25,000/yr can offset ordinary (W-2) income if you actively participate and your MAGI is under $100k (phasing out to $0 by $150k); unused losses carry forward. On sale, claimed depreciation is recaptured at up to 25%, and gains may owe capital-gains tax (a 1031 exchange can defer both). Figures are a year-1 estimate at your 24.0% rate — not tax advice; consult a CPA.
Schools (NCES district)
- District
- Muscogee County
- NCES district ID
- 1303870
- Math proficiency
- 21% ▼ -11.00%
- Reading proficiency
- 30% ▼ -7.00%
- Median HH income
- $41,176
- Composite
- 21.6/100
- National rank
- #8297
- State rank
- #120 of 174 in GA
Livability — Columbus
- Score
- 64/100
- State rank
- #254
- US rank
- #14102
Category grades
Schools grade is shown separately in the Schools card above.
Census & demographics
- Census place
- Columbus, GA
- County
- Muscogee County · 180,764 people
- City population
- 180,764
- Metro
- Columbus, GA-AL
- Population (ZIP)
- 59,110
- Household income
- $54,453
- Rent vs Own
- Severe rent burden
- 2138.0
Population outlook (Muscogee County) Hauer SSP2
- Today (2025)
- 216,729 people
- By 2030
- 224,504 · +3.6%
- By 2040
- 238,318 · +10.0%
- By 2050
- 249,027 · +14.9%
- By 2075
- 264,862 · +22.2%
- By 2100
- 254,786 · +17.6%
Race, ethnicity, and origin ACS 2023
- Neighborhood character
- Majority Black (64%)
- Race & ethnicity
- Black 64% White 22% Two or more races 8% Hispanic / Latino 6% Asian 1%
- Hispanic origin (detail)
- Mexican 2% Puerto Rican 2%
- Common ancestry
- Italian 1% Slovak 1%
- Foreign-born
- 4% · Canada, South Korea
- Languages at home
- 95% English-only · Spanish 3%
Political lean MEDSL · Muscogee
- 2024 margin
- Strong D (+23.4) · D 61.4% · R 38.0%
- 2008→2024 swing
- +3.7pp toward D · 2008: 19.7pp · 2024: 23.4pp
- All cycles
- 2024: D+23.4 2020: D+24.0 2016: D+18.6 2012: D+21.3 2008: D+19.7
Not yet ingested
- Civics
- —
Market trends
- HPI YoY
- ▼ -125.88%
- Current HPI
- 151.74
- Rent YoY
- ▲ 4.82%
- Metro
- Columbus, GA-AL
- State GDP YoY
- ▲ 2.66%
- F500 in state
- 28
Industry mix (Fortune 500 HQ in GA)
| Industry | F500 HQs | Revenue |
|---|---|---|
| Paper / Packaging | 2 | $29B |
|
||
| Retail | 1 | $160B |
|
||
| Transportation / Logistics | 1 | $91B |
|
||
| Airlines | 1 | $62B |
|
||
| Consumer Goods | 1 | $47B |
|
||
| Utilities | 1 | $25B |
|
||
Price history
+136.2% since first listed6 events — show timeline
- 2025-10-22 Listed $129,900 CBOR
- 2022-04-14 Price Changed $695 RENT.
- 2020-07-14 Sold (Public Records) $67,800 Public Records
- 2020-07-13 Sold (MLS) $67,750 CBOR
- 2020-05-14 Listed $69,500 CBOR
- 2017-08-31 Sold (Public Records) $55,000 Public Records
Property tax history
+8.8%/yrLatest (2025): $1,928 · +0.0% YoY. Source: county tax records.
Cash-flow waterfall
monthlySold comps — $/sqft
last 12 mo · ≤1 miLoading sold comps…