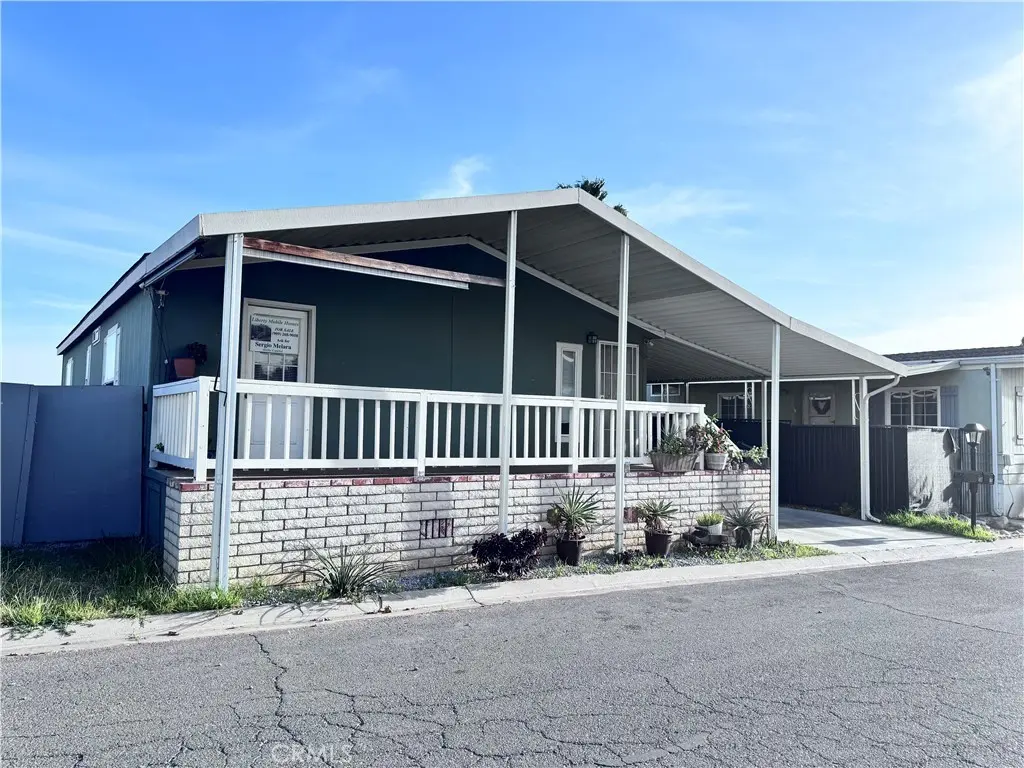
6130 Camino Real #307 · Jurupa Valley, CA
Flood risk 1/10 · Minimal
- FEMA flood zone
- X (unshaded)
- Chance of flooding over 30 yrs
- 0.0%
- Est. flood insurance / yr
- $507 – $1,088
Fire risk 4/10 · Minor
- Est. fire insurance / yr
- $659 – $1,223
Heat risk 8/10 · Major
- Hot days now (above 103°F)
- 7 days/yr
- Hot days in 30 yrs
- 20 days/yr
Wind risk 1/10 · Minimal
- Chance of severe wind over 30 yrs
- —
Air-quality risk 10/10 · Severe
- Unhealthy air days now
- 27 days/yr
- Unhealthy air days in 30 yrs
- 32 days/yr
Risk factors via First Street. Map © Google.
Why this score? — see what drove the C+ grade
The composite is a weighted blend of 9 inputs, each scored 0–100. Each bar is that input's sub-score; the figure is the points it added to the 100-point composite (weight × sub-score).
- Cash flow +30.0/30.0
- 1% rule +10.0/10.0
- DSCR +10.0/10.0
- Schools +3.1/10.0
- Rent growth +2.8/5.0
- Livability +2.5/5.0
- Condition / age +2.5/5.0
- ARV discount +0.3/15.0
- Appreciation +0.0/10.0
$179,900
🖨 Deal sheet (PDF) 📄 Offer letter ✓ Due diligence
Listing remarks
This 3 Bedroom 2 baths, Manufactured home is in move-in condition!!! This home offers an extra bonus room that can possibly be used as a 4th Bdrm. The ample leaving room leads you to the dinning area then into the cozy kitchen. The Kitchen is updated with newer Cabinets, Stainless Steel Gas Stove and Built-in Microwave oven. The flooring has been updated to water proof Custom Ash colored Laminates throughout the common areas including the bonus room (office room), the guest and the Master bathrooms. All bedrooms have warm carpet flooring and this home has an inside Laundry area covered by 6 panel doors. The driveway can easily fit up to 3 cars. The community offers a Basketball court, a Cl
Key facts
- Inside laundry area
- Updated kitchen
- Water proof flooring
Tags
Property features AI
Finance
- Other: Park name: Jurupa Hills Cascade; Property listed as double body (multi-unit/mobile type)
- Financial info: Land lease of $1,350
- HOA & community: Community features include curbs and street lighting; Located in the Jurupa Hills Cascade park (land lease community)
Exterior
- Parking: Tandem covered parking; Carport; Street parking
- Utilities: District/public water; Private sewer
- Home design: Single-story property; Mobile home remains on site; Mobile dimensions approximately 46' by 25'
- Construction: Year built per builder
- Exterior features: In-ground community pool; Cul-de-sac location; Paved streets
Interior
- Bathrooms: 2 full bathrooms
- Heating & cooling: Central furnace heating
- Interior features: Ground-level entry; One-story home; Entry on the ground level
- Laundry & utility: Washer hookup; Gas dryer hookup; Laundry area in closet
Neighborhood map
What this means for you Summary
Snapshot
- This is a 3-bed/2.0-bath manufactured listed at $180k.
Deal economics
- At list price, monthly cash flow is $1k ($13k/yr) — positive.
- The deal already cash-flows at list — no discount required.
- Meets the 1% rule at list price ($3k rent vs $180k).
- Recommended offer: $175k (3.0% below list) — sets the bar for market timing.
- Cap rate 13.7% vs local median 2.9% in Jurupa Valley — top-decile yield for the area; either an underpriced asset or a hidden risk that comps aren't pricing in. Stress-test before assuming the spread holds.
Location & tenants
- Location reads 49/100 on livability (#1,170 in CA) — a working-class tenant base; expect higher turnover. Strengths: housing A+, employment A-; Watch: schools F, amenities F, commute F.
- Jurupa Unified (suburban): math 25% / reading 38% proficiency, ranked #953 of 1,400 in CA (top 68%) — families likely to look elsewhere, expect single-tenant / working-renter base with shorter leases; 64% free/reduced lunch — lower-income household profile, screen leases tightly.
- Market conditions: Rents rising (+1.3%/yr); 202 active listings in the ZIP; 1 comparable units currently listed for rent nearby; solid renter incomes; 9,195 units permitted in Riverside County in 2024 (1,512 in 5+ unit buildings).
- This rent runs 35% of the median local income ($95k/yr) — at the standard rent-burdened threshold; future hikes will face affordability resistance.
Forward outlook
- Local home prices are declining (-3.0%/yr); year-one equity from $1k of loan paydown is wiped out by about $5k of value loss. Plan a longer hold.
- Riverside County population projected at +22% by 2050 — long-run rental-demand tailwind backs the buy-and-hold thesis.
- At projected returns (-3.0% appreciation + 1.3% rent growth), your $50k cash investment doubles in ~5 years — after that, you're playing with house money.
Negotiation context
- It's been on market 55 days — a 3% lower offer ($175k) is reasonable based on typical stale-listing flexibility.
Risks & watch-outs
- Climate carrying-cost: extreme-heat days projected 7→20/yr by 2055 (HVAC capex compounding) — expect insurance premiums to compound above CPI over the hold.
Questions for the listing agent
- It's been on market 55 days. Have you received any prior offers? Is the seller open to a 3% concession, seller financing, or rate buy-down credit?
- Is there a deadline driving the sale (1031 exchange, divorce, estate, relocation)? That informs how much negotiation room exists.
- Schools are F-rated, which usually means shorter tenancies and higher turnover. Who's the typical renter profile here, and what's been the actual vacancy rate?
- What's the average days-on-market for RENTAL listings here right now (not sales)? A rising rental-DOM trend means longer vacancies and softer asking-rent achievability than the comps imply.
- What's the recent tenant-quality profile in this submarket — average credit score on applications, eviction rate, late-payment / NSF rate, and stable-employment percentage? A property-management company in the area should have these aggregated.
- How much new for-sale + rental construction is in the pipeline within 1–3 miles? Heavy new supply typically softens prices + rents 12–24 months out; constrained supply supports both.
Investment metrics
- 1% rule
- 1.53% ✓
- Cap rate
- 13.70%
- Cash-on-cash
- 26.45%
- DSCR
- 2.18
- GRM
- 5.4
CMA / ARV
- ARV (median comp)
- $155,000
- List price
- $179,900
- Delta
- 16.06%
- Verdict
- OVERPRICED
- Comps
- 11 within 1.0 mi
Show comp detail 12 sales within ~0.75 mi
| Address | Dist | Beds/Ba | Sqft | Sold | Price | $/sf | Match |
|---|---|---|---|---|---|---|---|
| 6130 Camino Real #238 | 0.09mi | 3/2.0 | 1,196 (+2%) | 2mo | $190,000 | $159 | 91 |
| 6130 Camino Real #97 | 0.00mi | 2/2.0 (-1) | 1,152 (-2%) | 11mo | $120,000 | $104 | 84 |
| 6130 Camino Real #47 | 0.16mi | 3/2.0 | 1,176 (+0%) | 11mo | $145,000 | $123 | 83 |
| 6130 Camino Real #130 | 0.00mi | 3/2.0 | 1,248 (+7%) | 9mo | $135,000 | $108 | 82 |
| 6130 Camino Real #126 | 0.00mi | 3/2.0 | 1,040 (-11%) | 2mo | $155,000 | $149 | 80 |
| 6130 Camino Real #251 | 0.00mi | 3/2.0 | 1,296 (+11%) | 5mo | $132,000 | $102 | 78 |
| 6130 Camino Real #95 | 0.00mi | 4/2.0 (+1) | 1,320 (+13%) | 3mo | $166,800 | $126 | 71 |
| 6130 Camino Real #112 | 0.12mi | 2/2.0 (-1) | 1,040 (-11%) | 1mo | $149,000 | $143 | 70 |
| 6130 Camino Real #230 | 0.16mi | 3/2.0 | 1,250 (+7%) | 14mo | $170,000 | $136 | 69 |
| 6130 Camino Real #244 | 0.00mi | 2/2.0 (-1) | 1,344 (+15%) | 13mo | $120,000 | $89 | 59 |
| 6130 Camino Real #253 | 0.08mi | 3/2.0 | 1,344 (+15%) | 15mo | $165,000 | $123 | 59 |
| 6130 Camino Real #181 | 0.08mi | 3/2.0 | 1,344 (+15%) | 15mo | $155,000 | $115 | 59 |
Match score weights: distance 35% · size 25% · config 20% · recency 20%. Top-matched comps best support the ARV.
Projected returns pro-forma
-3.0% appreciation · 1.31% rent growth · sell at horizon
- IRR
- 18.4%
- Equity multiple
- 1.73×
- Total profit
- $36,879
- Equity at exit
- $26,824
- IRR
- 25.7%
- Equity multiple
- 3.08×
- Total profit
- $104,613
- Equity at exit
- $15,554
Cash invested: $50,372 (down + closing). Projections, not guarantees.
Landlord ↔ Tenant lean methodology
- Overall (STATE)
- 18 Strongly Tenant-Friendly
- State California
- 18 Strongly Tenant-Friendly · D+13
- County
- — inherits STATE
- City
- — inherits STATE
ZIP-level market 92509
- Rents YoY
- 1.3%
- Active inventory
- 202
- Price-to-rent
- 5.4×
Monthly cashflow live
- Estimated rent
- $2,754 medium interval (Pro) →
- Mortgage (P&I)
- −$943
- Tax from tax record
- −$47 /mo · $566/yr
- Insurance
- −$75
- HOA
- −$0
- Vacancy / Maint / Mgmt
- −$578
- Net cashflow
- $1,110
Break-even live
Sensitivity live
| Price | -10% $1,212 | -5% $1,161 | +0% $1,110 | +5% $1,059 | +10% $1,008 |
|---|---|---|---|---|---|
| Rent | -10% $893 | -5% $1,001 | +0% $1,110 | +5% $1,219 | +10% $1,328 |
| Rate | -1.0pp $1,201 | -0.5pp $1,156 | base $1,110 | +0.5pp $1,063 | +1.0pp $1,016 |
UW: 25.0% down · 7.5% · 30yr · 1.5% tax · 5.0% vac · 8.0% maint · 8.0% mgmt
Financing live
Cash to close
- Down payment
- $44,975
- Closing costs
- $5,397
- Reserves months
- —
- Total cash needed
- —
Loan-product check · same deal, 3 products live
Conventional
25% down · 7.5% · 30yr
- Down + closing
- —
- Monthly P&I
- —
- Monthly cashflow
- —
- DSCR
- —
- Eligible?
- —
Personal DTI + credit; lowest rate.
DSCR
20% down · 8.5% · 30yr
- Down + closing
- —
- Monthly P&I
- —
- Monthly cashflow
- —
- DSCR
- —
- Eligible?
- —
No personal income docs; deal must DSCR.
Hard money
10% down · 12.0% · 12mo
- Down + closing
- —
- Monthly P&I
- —
- Monthly cashflow
- —
- DSCR
- —
- Eligible?
- —
Short-term bridge; refi at stabilization.
Rent comps 1 comps
| Address | Beds | Baths | Sqft | Rent | $/sqft | DOM | Units | Dist |
|---|---|---|---|---|---|---|---|---|
| 6322 Brian Cir Jurupa Valley, CA | 3.0 | 2.0 | 1177 | $2,800 | $2.38 | 44d | 1 | 0.46mi |
Listing history 16 events
-
2026-06-18days on market $179,900 Active 55 DOM
-
2026-06-17days on market $179,900 Active 54 DOM
-
2026-06-16days on market $179,900 Active 53 DOM
-
2026-06-15days on market $179,900 Active 52 DOM
-
2026-06-13days on market $179,900 Active 50 DOM
-
2026-06-13days on market $179,900 Active 49 DOM
-
2026-06-09days on market $179,900 Active 46 DOM
-
2026-06-08days on market $179,900 Active 45 DOM
-
2026-06-07days on market $179,900 Active 44 DOM
-
2026-06-04days on market $179,900 Active 41 DOM
-
2026-06-03days on market $179,900 Active 40 DOM
-
2026-06-02days on market $179,900 Active 39 DOM
-
2026-06-01days on market $179,900 Active 38 DOM
-
2026-05-31days on market $179,900 Active 37 DOM
-
2026-05-14price $189,900 736-char remark
-
2026-04-24$195,000 Active 736-char remark
ⓘ Source: listings_history table (triggers on properties + properties_extension) + one-shot
backfill from property_details.listing_events for pre-trigger history.
Tax reassessment forecast CA · Resets to sale price
- Current annual tax
- $566 · $47/mo
- Projected year-2 tax
- $1,367 · $114/mo
- Expected delta
- +$801/yr (+$67/mo · 141.6%)
ⓘ Screening estimate from a state-policy table — verify with the county assessor before closing.
Climate risk First Street
- Flood 1/10 Low FEMA zone X (unshaded) · 0% chance over 30 yrs
- Wildfire 4/10 Moderate
- Heat 8/10 Severe 7 d/yr ≥103°F today · 20 d/yr by 30 yrs out
- Wind 1/10 Low
- Air quality 10/10 Extreme 27 unhealthy d/yr today · 32 by 30 yrs out
Nearby sold comps map
Loading sold comps map…
Walkable amenities ~0.75 mi
Loading nearby amenities…
Taxation est. · year 1
- Rental income
- $33,048
- − Mortgage interest
- −$10,077
- − Property taxes
- −$566
- − Insurance
- −$900
- − Repairs & maintenance
- −$2,644
- − Management
- −$2,644
- − Depreciation
- −$5,233
- Taxable income
- $10,984
- Est. tax owed @ 24.0%
- −$2,636
- After-tax cash flow
- $10,685/yr
For passive investors: Depreciation is non-cash, so a rental often shows a tax loss while cash-flowing — sheltering income. Rental losses are passive: they offset passive income freely, and up to $25,000/yr can offset ordinary (W-2) income if you actively participate and your MAGI is under $100k (phasing out to $0 by $150k); unused losses carry forward. On sale, claimed depreciation is recaptured at up to 25%, and gains may owe capital-gains tax (a 1031 exchange can defer both). Figures are a year-1 estimate at your 24.0% rate — not tax advice; consult a CPA.
Schools (NCES district)
- District
- Jurupa Unified
- NCES district ID
- 0619260
- Math proficiency
- 25% ▲ 2.00%
- Reading proficiency
- 38% ▲ 2.00%
- Median HH income
- $58,100
- Composite
- 30.97/100
- National rank
- #11327
- State rank
- #953 of 1400 in CA
Livability — Jurupa Valley
- Score
- 49/100
- State rank
- #1170
- US rank
- #25915
Category grades
Schools grade is shown separately in the Schools card above.
Census & demographics
- Census place
- Jurupa Valley, CA
- County
- Riverside County · 2,287,001 people
- City population
- 119,165
- Metro
- Riverside-San Bernardino-Ontario, CA
- Population (ZIP)
- 81,182
- Household income
- $95,355
- Rent vs Own
- Severe rent burden
- 1694.0
Population outlook (Riverside County) Hauer SSP2
- Today (2025)
- 2,664,475 people
- By 2030
- 2,802,692 · +5.2%
- By 2040
- 3,050,904 · +14.5%
- By 2050
- 3,256,783 · +22.2%
- By 2075
- 3,655,058 · +37.2%
- By 2100
- 3,766,594 · +41.4%
Race, ethnicity, and origin ACS 2023
- Neighborhood character
- Predominantly Hispanic (74%)
- Race & ethnicity
- Hispanic / Latino 74% White 17% Two or more races 16% Black 4% Asian 4% Native American 1%
- Hispanic origin (detail)
- Mexican 67%
- Common ancestry
- Lithuanian 1%
- Foreign-born
- 28% · Canada, China, Vietnam
- Languages at home
- 42% English-only · Spanish 54% Other Indo-European 1% Tagalog/Filipino 1%
Political lean MEDSL · Riverside
- 2024 margin
- Toss-up / Even · D 48.0% · R 49.3% · Other 2.6%
- 2008→2024 swing
- -3.6pp toward R · 2008: 2.3pp · 2024: -1.3pp
- All cycles
- 2024: R+1.3 2020: D+8.0 2016: D+4.3 2012: R+0.4 2008: D+2.3
Not yet ingested
- Civics
- —
Market trends
- HPI YoY
- ▼ -374.91%
- Current HPI
- 464.8939
- Rent YoY
- ▲ 1.31%
- Metro
- Riverside-San Bernardino-Ontario, CA
- State GDP YoY
- ▲ 3.21%
- F500 in state
- 116
Industry mix (Fortune 500 HQ in CA)
| Industry | F500 HQs | Revenue |
|---|---|---|
| Technology | 27 | $1,492B |
|
||
| Financial Services | 3 | $174B |
|
||
| Retail | 3 | $44B |
|
||
| Insurance | 3 | $26B |
|
||
| Media / Entertainment | 2 | $115B |
|
||
| Pharmaceuticals / Biotech | 2 | $62B |
|
||
Price history
-7.7% since first listed3 events — show timeline
- 2026-05-30 Price Changed $179,900 CRMLS
- 2026-05-14 Price Changed $189,900 CRMLS
- 2026-04-24 Listed $195,000 CRMLS
Property tax history
-2.9%/yrLatest (2025): $566 · +5.4% YoY. Source: county tax records.
Cash-flow waterfall
monthlySold comps — $/sqft
last 12 mo · ≤1 miLoading sold comps…