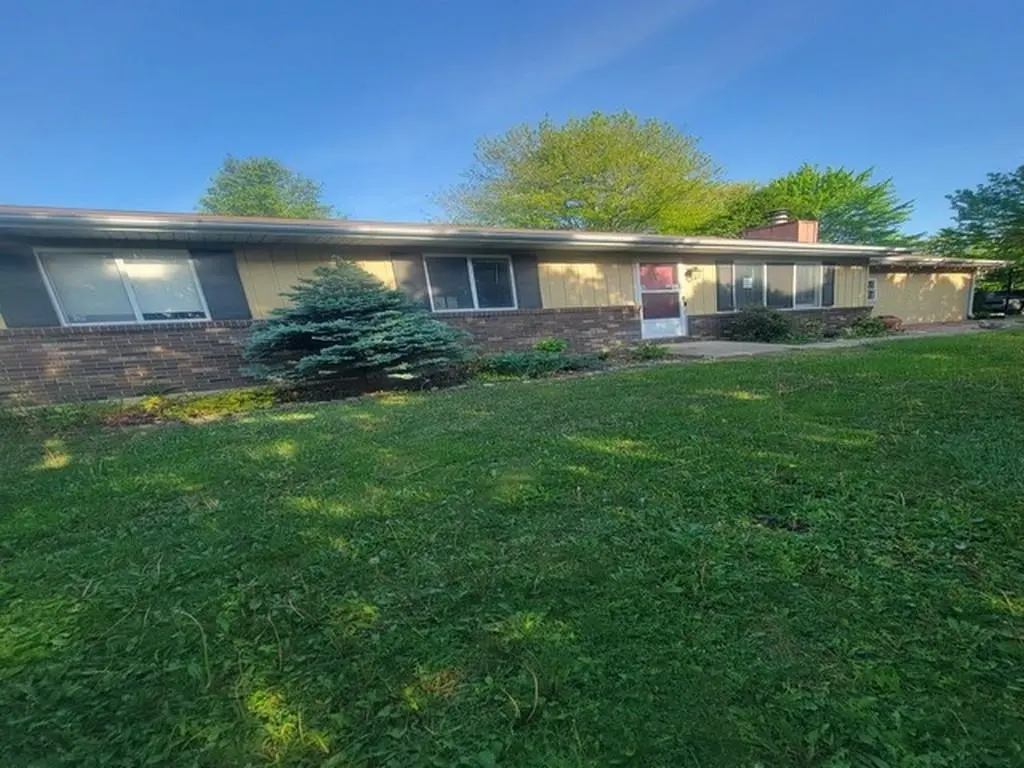
5147 Mackinaw Rd · Saginaw, MI
Flood risk 1/10 · Minimal
- FEMA flood zone
- X (unshaded)
- Chance of flooding over 30 yrs
- 0.0%
- Est. flood insurance / yr
- $473 – $860
Fire risk 1/10 · Minimal
- Est. fire insurance / yr
- $784 – $1,456
Heat risk 3/10 · Minor
- Hot days now (above 99°F)
- 7 days/yr
- Hot days in 30 yrs
- 14 days/yr
Wind risk 1/10 · Minimal
- Chance of severe wind over 30 yrs
- —
Air-quality risk 2/10 · Minimal
- Unhealthy air days now
- 1 days/yr
- Unhealthy air days in 30 yrs
- 1 days/yr
Risk factors via First Street. Map © Google.
Why this score? — see what drove the B grade
The composite is a weighted blend of 9 inputs, each scored 0–100. Each bar is that input's sub-score; the figure is the points it added to the 100-point composite (weight × sub-score).
- Cash flow +27.8/30.0
- ARV discount +15.0/15.0
- DSCR +9.8/10.0
- 1% rule +9.2/10.0
- Rent growth +4.4/5.0
- Livability +3.2/5.0
- Schools +3.1/10.0
- Condition / age +2.5/5.0
- Appreciation +0.0/10.0
$110,000
🖨 Deal sheet 📄 Offer letter ✓ Due diligence
Listing remarks MLS
* * OPEN HOUSE 12-3 from 2-4pm * * Location! This 3 bedroom ranch located in Saginaw Township is ready for new owners to make memories. Driveway is on Scarlet Oak Drive. The master bedroom has a convenient private 1/2 bathroom attached and newer vinyl plank flooring. Esthetically pleasing with a completely fenced private yard and extra shed for storage. The garage is your dream "man cave" with plenty of space for parking, tinkering, or entertaining. It has heat and even has a fully functioning sink! The basement is partially finished with an area for entertaining and a possible "4th bedroom" does not have an egress. Easy access to jump on expressway. Upgrades include: New garage door, new sump pump, and a recently added bathroom in the basement.
Key facts
- Attached garage
- Fenced in backyard
- Garden beds
Tags
Property features AI
Exterior
- Parking: Attached garage with approximately 2.5 parking spaces; Paved driveway
- Utilities: Public water; Public sanitary sewer; Electric service (implied); Natural gas
- Home design: One-story residential home; Built in 1979; Below-grade living area with finished space in the basement
- Construction: Aluminum and brick exterior; Block basement foundation
- Exterior features: Corner lot; Shed on the property; Road frontage (driveway on Scarlet Oak Dr.)
Interior
- Kitchen: Kitchen on the main level (approximately 9 x 12); Vinyl flooring in the kitchen; Dining room adjacent to kitchen (approximately 11 x 11) with vinyl flooring
- Bedrooms: Three bedrooms on the main level (two 11 x 11; third approx. 11'); Vinyl flooring in two bedrooms; carpet in one bedroom
- Flooring: Vinyl flooring in kitchen, dining room, and two bedrooms; Carpet in living room and one bedroom
- Bathrooms: One full bathroom on the main level; Total of three bath/lavatory fixtures; second lavatory located in the basement
- Heating & cooling: Forced air heating; Central A/C; Natural gas fuel; Gas water heater
- Interior features: Living room fireplace
- Laundry & utility: Basement present (block foundation) — includes a lavatory in the basement
Neighborhood map
What this means for you Summary
Snapshot
- This is a 3-bed/1.5-bath single-family listed at $110k.
Deal economics
- At list price, monthly cash flow is $336 ($4k/yr) — positive.
- The deal already cash-flows at list — no discount required.
- Meets the 1% rule at list price ($2k rent vs $110k).
- Cap rate 10.0% vs local median 8.3% in Saginaw — meaningfully above typical; check what's discounted (condition, days-on-market, listing class) to confirm the premium yield is real.
Location & tenants
- Location reads 63/100 on livability (#521 in MI) — a middle-class / working-renter tenant base. Strengths: cost of living A+, housing A+, health & safety A+; Watch: schools F, crime F, amenities F.
- Saginaw Township Community Schools (suburban): math 27% / reading 45% proficiency, ranked #265 of 540 in MI (top 49%) — families likely to look elsewhere, expect single-tenant / working-renter base with shorter leases.
- Market conditions: Rents rising fast (+7.7%/yr); 156 active listings in the ZIP; 154 units permitted in Saginaw County in 2024 (0 in 5+ unit buildings).
Forward outlook
- Local home prices are declining (-3.0%/yr); year-one equity from $761 of loan paydown is wiped out by about $3k of value loss. Plan a longer hold.
- Saginaw County population projected at -25% by 2050 — secular population decline; favor cash flow + early exit over multi-decade hold.
- At projected returns (-3.0% appreciation + 7.7% rent growth), your $31k cash investment doubles in ~7 years — after that, you're playing with house money.
Negotiation context
- Only 11 days on market — expect competitive offers; lowballing is unlikely to land.
- 3 sale attempts since 3y ago with the ask held roughly flat each time — persistent listings suggest the price (not the market) is what's stuck; bring a comps-based counter.
Risks & watch-outs
- Watch-outs: property tax is 3.0% of price.
Questions for the listing agent
- Built in 1979 — when were the roof, HVAC, electrical panel, plumbing, and water heater last replaced?
- Property tax is high relative to price — has the assessment been appealed recently, and will the sale trigger a re-assessment?
- Is there a deadline driving the sale (1031 exchange, divorce, estate, relocation)? That informs how much negotiation room exists.
- Schools are F-rated, which usually means shorter tenancies and higher turnover. Who's the typical renter profile here, and what's been the actual vacancy rate?
- Crime grade is F in this area — have there been break-ins, vandalism, or insurance claims at this property in the last 3 years? What carrier currently insures it and at what premium?
- What's the average days-on-market for RENTAL listings here right now (not sales)? A rising rental-DOM trend means longer vacancies and softer asking-rent achievability than the comps imply.
- What's the recent tenant-quality profile in this submarket — average credit score on applications, eviction rate, late-payment / NSF rate, and stable-employment percentage? A property-management company in the area should have these aggregated.
- How much new for-sale + rental construction is in the pipeline within 1–3 miles? Heavy new supply typically softens prices + rents 12–24 months out; constrained supply supports both.
Investment metrics
- 1% rule
- 1.42% ✓
- Cap rate
- 9.95%
- Cash-on-cash
- 13.07%
- DSCR
- 1.58
- GRM
- 5.9
CMA / ARV
- ARV (on-the-fly)
- $209,944
- Comps found
- 12
Show comp detail 12 sales within ~0.75 mi
| Address | Dist | Beds/Ba | Sqft | Sold | Price | $/sf | Match |
|---|---|---|---|---|---|---|---|
| 5185 Mackinaw Rd | 0.07mi | 3/2.5 | 1,480 (+15%) | 2mo | $285,000 | $193 | 66 |
| 5138 Mangrove Dr | 0.25mi | 3/2.0 | 1,384 (+8%) | 13mo | $225,600 | $163 | 63 |
| 5178 Mangrove Dr | 0.25mi | 3/1.5 | 1,428 (+11%) | 11mo | $199,999 | $140 | 61 |
| 3690 Waterloo Dr | 0.66mi | 3/1.5 | 1,340 (+4%) | 3mo | $220,000 | $164 | 60 |
| 3920 S Hartford Dr | 0.53mi | 3/1.0 | 1,188 (-8%) | 2mo | $142,000 | $120 | 59 |
| 4890 Mackinaw Rd | 0.54mi | 3/1.0 | 1,348 (+5%) | 14mo | $177,000 | $131 | 53 |
| 3730 Sherwood St | 0.63mi | 3/2.0 | 1,400 (+9%) | 2mo | $210,000 | $150 | 53 |
| 4612 Cedar Crest Dr | 0.60mi | 3/2.5 | 1,278 (-1%) | 17mo | $344,000 | $269 | 53 |
| 5161 Loganberry Dr | 0.40mi | 3/1.5 | 1,400 (+9%) | 19mo | $218,000 | $156 | 51 |
| 4173 SPURWOOD Dr | 0.73mi | 3/2.5 | 1,248 (-3%) | 8mo | $205,000 | $164 | 50 |
| 84 Tuscany Cir | 0.61mi | 2/2.0 (-1) | 1,468 (+14%) | 4mo | $320,000 | $218 | 38 |
| 3571 Ruskview Dr | 0.75mi | 3/1.5 | 1,454 (+13%) | 10mo | $170,000 | $117 | 35 |
Match score weights: distance 35% · size 25% · config 20% · recency 20%. Top-matched comps best support the ARV.
Projected returns pro-forma
-3.0% appreciation · 7.71% rent growth · sell at horizon
- IRR
- 8.9%
- Equity multiple
- 1.37×
- Total profit
- $11,392
- Equity at exit
- $16,401
- IRR
- 22.1%
- Equity multiple
- 3.37×
- Total profit
- $72,873
- Equity at exit
- $9,511
Cash invested: $30,800 (down + closing). Projections, not guarantees.
Landlord ↔ Tenant lean methodology
- Overall (STATE)
- 62 Landlord-Friendly
- State Michigan
- 62 Landlord-Friendly · EVEN
- County
- — inherits STATE
- City
- — inherits STATE
ZIP-level market 48603
- Rents YoY
- 7.7%
- Active inventory
- 156
- Price-to-rent
- 5.9×
Monthly cashflow live
- Estimated rent
- $1,559 medium interval (Pro) →
- Mortgage (P&I)
- −$577
- Tax from tax record
- −$273 /mo · $3,276/yr
- Insurance
- −$46
- HOA
- −$0
- Vacancy / Maint / Mgmt
- −$327
- Net cashflow
- $336
Break-even live
UW: 25.0% down · 7.5% · 30yr · 1.5% tax · 5.0% vac · 8.0% maint · 8.0% mgmt
Financing live
Cash to close
- Down payment
- $27,500
- Closing costs
- $3,300
- Reserves months
- —
- Total cash needed
- —
Loan-product check · same deal, 3 products live
Conventional
25% down · 7.5% · 30yr
- Down + closing
- —
- Monthly P&I
- —
- Monthly cashflow
- —
- DSCR
- —
- Eligible?
- —
Personal DTI + credit; lowest rate.
DSCR
20% down · 8.5% · 30yr
- Down + closing
- —
- Monthly P&I
- —
- Monthly cashflow
- —
- DSCR
- —
- Eligible?
- —
No personal income docs; deal must DSCR.
Hard money
10% down · 12.0% · 12mo
- Down + closing
- —
- Monthly P&I
- —
- Monthly cashflow
- —
- DSCR
- —
- Eligible?
- —
Short-term bridge; refi at stabilization.
Listing history 8 events
-
2026-06-14statusdays on market $110,000 Pending 11 DOM
-
2026-06-12days on market $110,000 Active 10 DOM
-
2026-06-09days on market $110,000 Active 7 DOM
-
2026-06-08days on market $110,000 Active 6 DOM
-
2026-06-07remarks 526-char remark
-
2026-06-07days on market $110,000 Active 5 DOM
-
2026-06-03remarks 487-char remark
-
2026-06-03$110,000 Active 1 DOM
ⓘ Source: listings_history table (triggers on properties + properties_extension) + one-shot
backfill from property_details.listing_events for pre-trigger history.
Tax reassessment forecast MI · Partial reset (capped growth)
- Current annual tax
- $3,276 · $273/mo
- Projected year-2 tax
- $3,276 · $273/mo
- Expected delta
- $0/yr ($0/mo · 0.0%)
ⓘ Screening estimate from a state-policy table — verify with the county assessor before closing.
Climate risk First Street
- Flood 1/10 Low FEMA zone X (unshaded) · 0% chance over 30 yrs
- Wildfire 1/10 Low
- Heat 3/10 Moderate 7 d/yr ≥99°F today · 14 d/yr by 30 yrs out
- Wind 1/10 Low
- Air quality 2/10 Low 1 unhealthy d/yr today · 1 by 30 yrs out
Nearby sold comps map
Loading sold comps map…
Walkable amenities ~0.75 mi
Loading nearby amenities…
Taxation est. · year 1
- Rental income
- $18,703
- − Mortgage interest
- −$6,162
- − Property taxes
- −$3,276
- − Insurance
- −$550
- − Repairs & maintenance
- −$1,496
- − Management
- −$1,496
- − Depreciation
- −$3,200
- Taxable income
- $2,523
- Est. tax owed @ 24.0%
- −$605
- After-tax cash flow
- $3,421/yr
For passive investors: Depreciation is non-cash, so a rental often shows a tax loss while cash-flowing — sheltering income. Rental losses are passive: they offset passive income freely, and up to $25,000/yr can offset ordinary (W-2) income if you actively participate and your MAGI is under $100k (phasing out to $0 by $150k); unused losses carry forward. On sale, claimed depreciation is recaptured at up to 25%, and gains may owe capital-gains tax (a 1031 exchange can defer both). Figures are a year-1 estimate at your 24.0% rate — not tax advice; consult a CPA.
Schools (NCES district)
- District
- Saginaw Township Community Schools
- NCES district ID
- 2630450
- Math proficiency
- 27% ▼ -9.00%
- Reading proficiency
- 45% ▼ -4.00%
- Median HH income
- $48,971
- Composite
- 31.01/100
- National rank
- #6094
- State rank
- #265 of 540 in MI
Livability — Saginaw
- Score
- 63/100
- State rank
- #521
- US rank
- #15424
Category grades
Schools grade is shown separately in the Schools card above.
Census & demographics
- County
- Saginaw County · 54,884 people
- City population
- 54,884
- Metro
- Saginaw, MI
- Population (ZIP)
- 27,757
- Household income
- $66,352
- Rent vs Own
- Severe rent burden
- 1106.0
Population outlook (Saginaw County) Hauer SSP2
- Today (2025)
- 180,568 people
- By 2030
- 172,302 · -4.6%
- By 2040
- 153,919 · -14.8%
- By 2050
- 135,519 · -24.9%
- By 2075
- 97,199 · -46.2%
- By 2100
- 65,037 · -64.0%
Race, ethnicity, and origin ACS 2023
- Neighborhood character
- Predominantly White (70%)
- Race & ethnicity
- White 70% Black 12% Hispanic / Latino 10% Asian 5% Two or more races 5%
- Hispanic origin (detail)
- Mexican 8%
- Common ancestry
- Romanian 8% Lithuanian 7% Slovak 3%
- Foreign-born
- 6% · Canada, China
- Languages at home
- 93% English-only · Other Indo-European 3% Spanish 2% Other Asian/Pacific 1%
Political lean MEDSL · Saginaw
- 2024 margin
- Toss-up / Even · D 47.7% · R 51.0% · Other 1.4%
- 2008→2024 swing
- -20.6pp toward R · 2008: 17.3pp · 2024: -3.3pp
- All cycles
- 2024: R+3.3 2020: D+0.3 2016: R+1.1 2012: D+11.9 2008: D+17.3
Not yet ingested
- Civics
- —
Market trends
- HPI YoY
- ▼ -103.35%
- Current HPI
- 152.7507
- Rent YoY
- ▲ 7.71%
- Metro
- Saginaw, MI
- State GDP YoY
- ▲ 1.37%
- F500 in state
- 28
Industry mix (Fortune 500 HQ in MI)
| Industry | F500 HQs | Revenue |
|---|---|---|
| Automotive Parts | 3 | $48B |
|
||
| Automotive | 2 | $372B |
|
||
| Chemicals | 1 | $45B |
|
||
| Automotive Retail | 1 | $29B |
|
||
| Healthcare / Medical Devices | 1 | $23B |
|
||
| Automotive Technology | 1 | $20B |
|
||
Price history
-47.4% since first listed16 events — show timeline
- 2026-06-01 Listed $110,000 MiRealSource-MiMLS
- 2024-01-10 Sold (Public Records) $188,000 Public Records
- 2024-01-05 Sold (MLS) $188,000 MiRealSource-MiMLS
- 2024-01-05 Sold (MLS) $188,000 REALCOMP
- 2023-11-29 Pending — REALCOMP
- 2023-11-29 Pending — MiRealSource-MiMLS
- 2023-11-07 Price Changed $190,000 MiRealSource-MiMLS
- 2023-11-06 Price Changed $190,000 REALCOMP
- 2023-11-02 Price Changed $195,000 MiRealSource-MiMLS
- 2023-11-01 Price Changed $195,000 REALCOMP
- 2023-10-27 Price Changed $199,000 MiRealSource-MiMLS
- 2023-10-27 Price Changed $199,000 REALCOMP
- 2023-10-24 Price Changed $204,000 MiRealSource-MiMLS
- 2023-10-24 Price Changed $204,000 REALCOMP
- 2023-10-19 Listed $209,000 MiRealSource-MiMLS
- 2023-10-19 Listed $209,000 REALCOMP
Property tax history
+5.1%/yrLatest (2025): $3,276 · +1207.0% YoY. Source: county tax records.
Cash-flow waterfall
monthlySold comps — $/sqft
last 12 mo · ≤1 miLoading sold comps…