 12-Plex
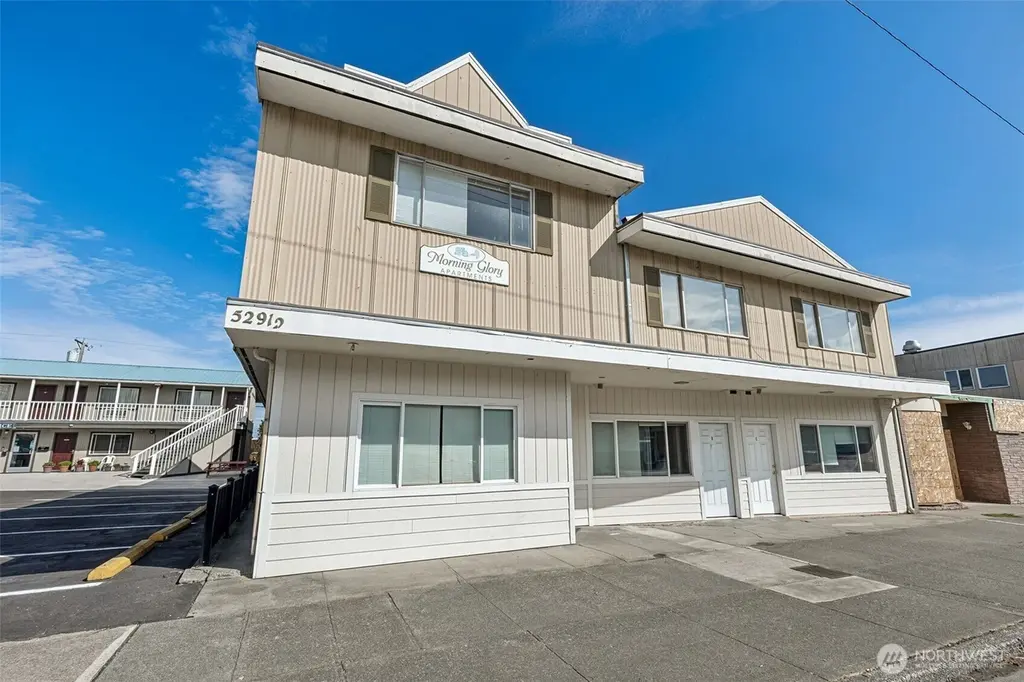
527 E First St · Port Angeles, WA
Flood risk 1/10 · Minimal
- FEMA flood zone
- X
- Chance of flooding over 30 yrs
- 0.0%
- Est. flood insurance / yr
- $473 – $860
Fire risk 1/10 · Minimal
- Est. fire insurance / yr
- $604 – $1,122
Heat risk 2/10 · Minimal
- Hot days now (above 81°F)
- 8 days/yr
- Hot days in 30 yrs
- 16 days/yr
Wind risk 1/10 · Minimal
- Chance of severe wind over 30 yrs
- —
Air-quality risk 6/10 · Moderate
- Unhealthy air days now
- 8 days/yr
- Unhealthy air days in 30 yrs
- 9 days/yr
Risk factors via First Street. Map © Google.
Why this score? — see what drove the B- grade
The composite is a weighted blend of 9 inputs, each scored 0–100. Each bar is that input's sub-score; the figure is the points it added to the 100-point composite (weight × sub-score).
- Cash flow +26.2/30.0
- ARV discount +9.8/15.0
- DSCR +8.9/10.0
- 1% rule +7.0/10.0
- Schools +5.2/10.0
- Condition / age +4.0/5.0
- Livability +3.9/5.0
- Rent growth +2.5/5.0
- Appreciation +0.0/10.0
$1,525,000
🖨 Deal sheet (PDF) 📄 Offer letter ✓ Due diligence
Multi-family units
County records classify this as Multi-Family (5+ Unit). Listing-text estimate: 12 units. confirmed
5+ unit building — per-unit beds/baths from public records are typically unavailable; the breakdown below (if shown) is an estimate from the listing text.
Listing remarks
The Morning Apartments is a 12-unit community located in Downtown Port Angeles. Originally built in 1953, significant improvements have been made on the property in order for it to perform as well as it does. Units have all been freshly renovated while preserving the historic charm of wood cabinetry & hardwood floors. Morning Glory consists of nine one-bedroom, one-bathroom units averaging ±711 square feet & two two-bedroom, one-bathroom units averaging ±988 square feet, and one three bedroom, one-bathroom unit of approximately 968 square feet. The apartment has two shared washers and two shared dryers. At a purchase price of $1,600,000, Morning Glory offers great
Key facts
- Historic charm
- Wood cabinetry
- Freshly renovated
Tags
Neighborhood map
What this means for you Summary
Snapshot
- This is a 9×1bd/1ba + 2×2bd/1ba + 1×3bd/1ba units multifamily listed at $1.52M. Condition is rated good.
Deal economics
- At list price, monthly cash flow is $4k ($47k/yr) — positive. Per door: $325/mo.
- The deal already cash-flows at list — no discount required.
- Meets the 1% rule at list price ($18k rent vs $1.52M).
- Recommended offer: $1.34M (12.0% below list) — sets the bar for market timing.
- Cap rate 9.4% vs local median 2.7% in Port Angeles — top-decile yield for the area; either an underpriced asset or a hidden risk that comps aren't pricing in. Stress-test before assuming the spread holds.
Location & tenants
- Location reads 78/100 on livability (#138 in WA, #2,729 nationally) — a middle-class / working-renter tenant base. Strengths: amenities A+, commute A+, health & safety A+; Watch: employment C-, crime F.
- Port Angeles School District (town): math 55% / reading 65% proficiency, ranked #70 of 291 in WA (top 24%) — acceptable for families but not a draw, mixed tenant base, ~2y average lease.
- Zoned schools: Franklin Elementary (354 students, 62% FRL); Stevens Middle School (492 students, 63% FRL); Port Angeles High School (989 students, 57% FRL) — zoned schools average 61% FRL vs 46% district-wide (15 pts higher); higher-poverty schools than district average — tighter screening recommended.
- Market conditions: 275 active listings in the ZIP; 166 units permitted in Clallam County in 2024 (0 in 5+ unit buildings).
Forward outlook
- Local home prices are declining (-3.0%/yr); year-one equity from $11k of loan paydown is wiped out by about $46k of value loss. Plan a longer hold.
- Clallam County population projected at +5% by 2050 — modest demand growth; plan on rents tracking national, not racing it.
- At projected returns (-3.0% appreciation + 3.0% rent growth), your $427k cash investment doubles in ~10 years — after that, you're playing with house money.
Negotiation context
- It's been on market 188 days — a 12% lower offer ($1.34M) is reasonable based on typical stale-listing flexibility.
- 6 sale attempts since 7y ago with the ask held roughly flat each time — persistent listings suggest the price (not the market) is what's stuck; bring a comps-based counter.
Risks & watch-outs
- Watch-outs: built in 1953 — expect roof / HVAC / electrical / plumbing capex.
Questions for the listing agent
- It's been on market 188 days. Have you received any prior offers? Is the seller open to a 12% concession, seller financing, or rate buy-down credit?
- Can we see the unit-by-unit rent roll, current vacancy, and any below-market leases? What's the average tenancy length?
- What capital expenditures (roof, boiler, parking lot, exteriors) have been made in the last 5 years, and what's planned in the next 2?
- Built in 1953 — when were the roof, HVAC, electrical panel, plumbing, and water heater last replaced?
- Why hasn't it sold? Are there any deal-killer items the seller is aware of (foundation, flood, title, zoning, code violations)?
- Is there a deadline driving the sale (1031 exchange, divorce, estate, relocation)? That informs how much negotiation room exists.
- Schools are B-rated — typically a magnet for longer-tenancy family renters. What's the average tenant stay here, and is there a school-zone premium baked into asking?
- Crime grade is F in this area — have there been break-ins, vandalism, or insurance claims at this property in the last 3 years? What carrier currently insures it and at what premium?
- What's the average days-on-market for RENTAL listings here right now (not sales)? A rising rental-DOM trend means longer vacancies and softer asking-rent achievability than the comps imply.
- What's the recent tenant-quality profile in this submarket — average credit score on applications, eviction rate, late-payment / NSF rate, and stable-employment percentage? A property-management company in the area should have these aggregated.
- How much new apartment / multifamily construction is in the pipeline within 1–3 miles? Heavy new supply (>2% of stock underway) typically softens rents 12–24 months out; light construction supports rent growth.
Investment metrics
- 1% rule
- 1.20% ✓
- Cap rate
- 9.36%
- Cash-on-cash
- 10.94%
- DSCR
- 1.49
- GRM
- 7.0
CMA / ARV
- ARV (median comp)
- $1,606,561
- List price
- $1,525,000
- Delta
- -5.08%
- Verdict
- FAIR
- Comps
- 2 within 2.0 mi
Projected returns pro-forma
-3.0% appreciation · 3.0% rent growth · sell at horizon
- IRR
- 0.1%
- Equity multiple
- 1.00×
- Total profit
- $1,195
- Equity at exit
- $227,382
- IRR
- 9.7%
- Equity multiple
- 1.75×
- Total profit
- $321,544
- Equity at exit
- $131,854
Cash invested: $427,000 (down + closing). Projections, not guarantees.
Landlord ↔ Tenant lean methodology
- Overall (STATE)
- 28 Tenant-Leaning
- State Washington
- 28 Tenant-Leaning · D+8
- County
- — inherits STATE
- City
- — inherits STATE
ZIP-level market 98362
- Active inventory
- 275
- Price-to-rent
- 86.0×
Monthly cashflow live
- Estimated rent
- $18,270 medium interval (Pro) →
- Mortgage (P&I)
- −$7,997
- Tax est. 1.5%
- −$1,906 /mo · $22,875/yr
- Insurance
- −$635
- HOA
- −$0
- Lot rent
- −$0
- Vacancy / Maint / Mgmt
- −$3,837
- Net cashflow
- $3,894
Break-even live
Sensitivity live
| Price | -10% $4,948 | -5% $4,421 | +0% $3,894 | +5% $3,367 | +10% $2,840 |
|---|---|---|---|---|---|
| Rent | -10% $2,451 | -5% $3,173 | +0% $3,894 | +5% $4,616 | +10% $5,338 |
| Rate | -1.0pp $4,662 | -0.5pp $4,282 | base $3,894 | +0.5pp $3,499 | +1.0pp $3,097 |
12-unit breakdown (identical units grouped — click to expand)
| Units | Beds | Baths | Est. rent |
|---|---|---|---|
| 9× units | 1 | 1 | $13,302 |
| #1 | 1 | 1 | $1,478 |
| #2 | 1 | 1 | $1,478 |
| #3 | 1 | 1 | $1,478 |
| #4 | 1 | 1 | $1,478 |
| #5 | 1 | 1 | $1,478 |
| #6 | 1 | 1 | $1,478 |
| #7 | 1 | 1 | $1,478 |
| #8 | 1 | 1 | $1,478 |
| #9 | 1 | 1 | $1,478 |
| 2× units | 2 | 1 | $3,252 |
| #10 | 2 | 1 | $1,626 |
| #11 | 2 | 1 | $1,626 |
| 1× unit | 3 | 1 | $1,716 |
| Total (12 units) | $18,270 | ||
UW: 25.0% down · 7.5% · 30yr · 1.5% tax · 5.0% vac · 8.0% maint · 8.0% mgmt
Financing live
Cash to close
- Down payment
- $381,250
- Closing costs
- $45,750
- Reserves months
- —
- Total cash needed
- —
Loan-product check · same deal, 3 products live
Conventional
25% down · 7.5% · 30yr
- Down + closing
- —
- Monthly P&I
- —
- Monthly cashflow
- —
- DSCR
- —
- Eligible?
- —
Personal DTI + credit; lowest rate.
DSCR
20% down · 8.5% · 30yr
- Down + closing
- —
- Monthly P&I
- —
- Monthly cashflow
- —
- DSCR
- —
- Eligible?
- —
No personal income docs; deal must DSCR.
Hard money
10% down · 12.0% · 12mo
- Down + closing
- —
- Monthly P&I
- —
- Monthly cashflow
- —
- DSCR
- —
- Eligible?
- —
Short-term bridge; refi at stabilization.
Listing history 33 events
-
2026-06-22days on market $1,525,000 Active 188 DOM
-
2026-06-21days on market $1,525,000 Active 187 DOM
-
2026-06-21days on market $1,525,000 Active 186 DOM
-
2026-06-18days on market $1,525,000 Active 184 DOM
-
2026-06-17days on market $1,525,000 Active 183 DOM
-
2026-06-16days on market $1,525,000 Active 182 DOM
-
2026-06-15days on market $1,525,000 Active 181 DOM
-
2026-06-15days on market $1,525,000 Active 180 DOM
-
2026-06-13days on market $1,525,000 Active 179 DOM
-
2026-06-12days on market $1,525,000 Active 178 DOM
-
2026-06-09days on market $1,525,000 Active 175 DOM
-
2026-06-08days on market $1,525,000 Active 174 DOM
-
2026-06-08days on market $1,525,000 Active 173 DOM
-
2026-06-07days on market $1,525,000 Active 172 DOM
-
2026-06-03days on market $1,525,000 Active 169 DOM
-
2026-06-02days on market $1,525,000 Active 168 DOM
-
2026-06-01days on market $1,525,000 Active 167 DOM
-
2026-05-31days on market $1,525,000 Active 166 DOM
-
2026-03-10price $1,525,000
-
2025-12-16$1,600,000 Active
-
2022-08-21price $937
-
2022-08-16soldstatus $1,400,000
-
2022-08-16soldstatus $1,400,000 Closed
-
2022-06-22status Pending
-
2022-06-12$1,400,000
-
2022-05-23price $1,450,000
-
2022-05-20status Active
-
2022-05-03status Pending
-
2022-04-13status Active
-
2022-03-31status Pending
-
2022-03-24$1,500,000 Active
-
2020-01-06soldstatus $595,000
-
2019-07-23$679,950
ⓘ Source: listings_history table (triggers on properties + properties_extension) + one-shot
backfill from property_details.listing_events for pre-trigger history.
Climate risk First Street
- Flood 1/10 Low FEMA zone X · 0% chance over 30 yrs
- Wildfire 1/10 Low
- Heat 2/10 Low 8 d/yr ≥81°F today · 16 d/yr by 30 yrs out
- Wind 1/10 Low
- Air quality 6/10 Major 8 unhealthy d/yr today · 9 by 30 yrs out
Nearby sold comps map
Loading sold comps map…
Walkable amenities ~0.75 mi
Loading nearby amenities…
Taxation est. · year 1
- Rental income
- $219,240
- − Mortgage interest
- −$85,424
- − Property taxes
- −$22,875
- − Insurance
- −$7,625
- − Repairs & maintenance
- −$17,539
- − Management
- −$17,539
- − Depreciation
- −$44,364
- Taxable income
- $23,874
- Est. tax owed @ 24.0%
- −$5,730
- After-tax cash flow
- $41,003/yr
For passive investors: Depreciation is non-cash, so a rental often shows a tax loss while cash-flowing — sheltering income. Rental losses are passive: they offset passive income freely, and up to $25,000/yr can offset ordinary (W-2) income if you actively participate and your MAGI is under $100k (phasing out to $0 by $150k); unused losses carry forward. On sale, claimed depreciation is recaptured at up to 25%, and gains may owe capital-gains tax (a 1031 exchange can defer both). Figures are a year-1 estimate at your 24.0% rate — not tax advice; consult a CPA.
Condition & rehab AI · 13 photos
This multi-family property is in good condition with recent renovations, offering a solid investment opportunity.
Value-add opportunities
- Both update appliances — modernize kitchen
- Both install smart home devices — attract tech-savvy renters
- Both landscape front yard — enhance curb appeal
Renovation cost estimate screening
Value-add ROI direction
- Both update appliances — modernize kitchen ↑
- Both install smart home devices — attract tech-savvy renters ↑
- Both landscape front yard — enhance curb appeal ↑
ⓘ Cost ranges are severity-bucket heuristics (US national rule-of-thumb). Get contractor quotes + a written scope before underwriting a rehab budget.
Schools (NCES district)
- District
- Port Angeles School District
- NCES district ID
- 5306820
- Math proficiency
- 55% ▬ 0.00%
- Reading proficiency
- 65% ▲ 1.00%
- Median HH income
- $46,594
- Composite
- 52.34/100
- National rank
- #3432
- State rank
- #70 of 291 in WA
Livability — Port Angeles
- Score
- 78/100
- State rank
- #138
- US rank
- #2729
Category grades
Schools grade is shown separately in the Schools card above.
Census & demographics
- Census place
- Port Angeles, WA
- Population (ZIP)
- 23,907
Population outlook (Clallam County) Hauer SSP2
- Today (2025)
- 76,817 people
- By 2030
- 78,177 · +1.8%
- By 2040
- 79,795 · +3.9%
- By 2050
- 80,890 · +5.3%
- By 2075
- 83,933 · +9.3%
- By 2100
- 82,141 · +6.9%
Race, ethnicity, and origin ACS 2023
- Neighborhood character
- Predominantly White (84%)
- Race & ethnicity
- White 84% Two or more races 8% Hispanic / Latino 7% Native American 1% Asian 1%
- Hispanic origin (detail)
- Mexican 4%
- Common ancestry
- Italian 6% Portuguese 6% Lithuanian 4%
- Foreign-born
- 4% · Canada
- Languages at home
- 95% English-only · Spanish 3% German/W. Germanic 1%
Political lean MEDSL · Clallam
- 2024 margin
- Lean D (+7.9) · D 52.6% · R 44.7% · Other 2.7%
- 2008→2024 swing
- +4.6pp toward D · 2008: 3.3pp · 2024: 7.9pp
- All cycles
- 2024: D+7.9 2020: D+3.4 2016: R+1.6 2012: D+0.4 2008: D+3.3
Not yet ingested
- Civics
- —
Market trends
- HPI YoY
- ▼ -340.90%
- Current HPI
- 189.7112
- Rent YoY
- —
- Metro
- —
- State GDP YoY
- ▲ 4.65%
- F500 in state
- 22
Industry mix (Fortune 500 HQ in WA)
| Industry | F500 HQs | Revenue |
|---|---|---|
| Retail | 2 | $269B |
|
||
| Technology / Retail | 1 | $638B |
|
||
| Technology | 1 | $245B |
|
||
| Telecommunications | 1 | $38B |
|
||
| Food / Beverage | 1 | $36B |
|
||
| Automotive / Trucks | 1 | $34B |
|
||
Price history
+124.3% since first listed15 events — show timeline
- 2026-03-10 Price Changed $1,525,000 NWMLS as Distributed by MLS Grid
- 2025-12-16 Listed $1,600,000 NWMLS as Distributed by MLS Grid
- 2022-08-21 Price Changed $937 RENT.
- 2022-08-16 Sold (MLS) $1,400,000 NWMLS as Distributed by MLS Grid
- 2022-08-16 Sold (MLS) $1,400,000 RMLS
- 2022-06-22 Pending — NWMLS as Distributed by MLS Grid
- 2022-06-12 Listed $1,400,000 RMLS
- 2022-05-23 Price Changed $1,450,000 NWMLS as Distributed by MLS Grid
- 2022-05-20 Relisted — NWMLS as Distributed by MLS Grid
- 2022-05-03 Pending — NWMLS as Distributed by MLS Grid
- 2022-04-13 Relisted — NWMLS as Distributed by MLS Grid
- 2022-03-31 Pending — NWMLS as Distributed by MLS Grid
- 2022-03-24 Listed $1,500,000 NWMLS as Distributed by MLS Grid
- 2020-01-06 Sold (MLS) $595,000 NWMLS as Distributed by MLS Grid
- 2019-07-23 Listed $679,950 NWMLS as Distributed by MLS Grid
Cash-flow waterfall
monthlySold comps — $/sqft
last 12 mo · ≤1 miLoading sold comps…