1266 S Military Trl #575 · Deerfield Beach, FL
Flood risk 1/10 · Minimal
- FEMA flood zone
- X (unshaded)
- Chance of flooding over 30 yrs
- 0.0%
- Est. flood insurance / yr
- $507 – $1,088
Fire risk 1/10 · Minimal
- Est. fire insurance / yr
- $947 – $1,759
Heat risk 9/10 · Severe
- Hot days now (above 107°F)
- 7 days/yr
- Hot days in 30 yrs
- 27 days/yr
Wind risk 10/10 · Severe
- Chance of severe wind over 30 yrs
- 99.0%
Air-quality risk 2/10 · Minimal
- Unhealthy air days now
- 1 days/yr
- Unhealthy air days in 30 yrs
- 3 days/yr
Risk factors via First Street. Map © Google.
Why this score? — see what drove the D grade
The composite is a weighted blend of 9 inputs, each scored 0–100. Each bar is that input's sub-score; the figure is the points it added to the 100-point composite (weight × sub-score).
- 1% rule +9.7/10.0
- Cash flow +8.5/30.0
- ARV discount +7.5/15.0
- Schools +4.1/10.0
- Livability +3.8/5.0
- Rent growth +2.5/5.0
- Condition / age +2.5/5.0
- DSCR +2.3/10.0
- Appreciation +0.0/10.0
$145,000
🖨 Deal sheet 📄 Offer letter ✓ Due diligence
Listing remarks
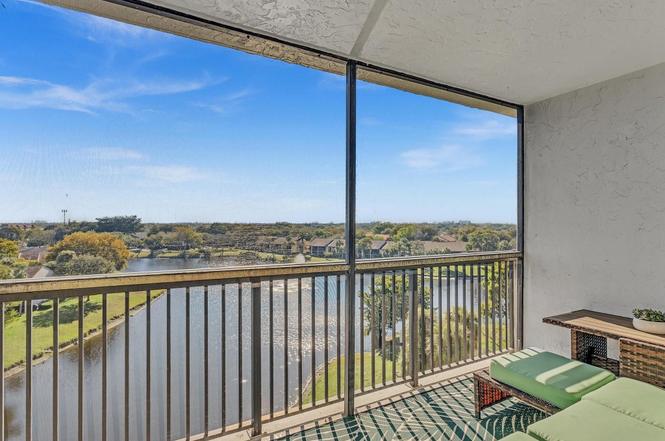
Price Improvement! Ideal Location! Best value in this all-ages gated community with beautiful lake views from the 7th floor. Enjoy peaceful water views from your screened balcony in this light and bright condo featuring a brand new refrigerator and dishwasher. Spacious layout with open living and dining areas filled with natural light, eat-in kitchen, large bedroom with walk-in closet, updated bathroom, and in-unit laundry with full-size washer & dryer. Just minutes to Sawgrass Expwy, Turnpike, I-95, shopping, dining, and only 10 minutes to the beach. Great amenities include clubhouse, fitness room, pool, and spa. Exterior insurance and water included. Publix and shopping conveniently
Key facts
- Screened patio
- Gated community
- Lake views
Tags
Property features AI
Finance
- Financial info: No land lease; Pets not allowed
- HOA & community: Association: Skyline Management; Monthly HOA fee; Association amenities include clubhouse, fitness center, pool, spa/hot tub, and lobby; HOA fee covers insurance, grounds and structure maintenance, water, common areas, elevator, roof repairs, and recreation facilities
Exterior
- Parking: Assigned parking (1 space)
- Security: Security fence; Security system
- Utilities: Public water; Water service available
- Home design: Condominium; Resale; 8-story building; Faces west
- Construction: Block construction
- Exterior features: Fenced; West of US-1 road frontage; Waterfront: Yes (no specific waterfront features listed)
Interior
- Kitchen: Electric range; Refrigerator
- Bedrooms: 1 main-level bedroom
- Flooring: Tile
- Bathrooms: 1 full bathroom
- Heating & cooling: Central heating; Central air conditioning
- Interior features: Blinds; Screened porch
- Laundry & utility: Gas water heater
Neighborhood map
What this means for you Summary
Snapshot
- This is a 1-bed/1.0-bath condo listed at $145k.
Deal economics
- At list price, monthly cash flow is $-127 ($-2k/yr) — negative.
- To cash-flow at today's rent, offer at most $123k (15.5% below list).
- Meets the 1% rule at list price ($2k rent vs $145k).
- Recommended offer: $123k (15.5% below list) — sets the bar for cash-flow.
- Cap rate 5.2% vs local median 4.2% in Deerfield Beach — meaningfully above typical; check what's discounted (condition, days-on-market, listing class) to confirm the premium yield is real.
Location & tenants
- Location reads 75/100 on livability (#250 in FL, #3,970 nationally) — a middle-class / working-renter tenant base. Strengths: housing A+, health & safety A+, cost of living A; Watch: amenities D-, employment D-.
- Broward (suburban): math 42% / reading 53% proficiency, ranked #46 of 73 in FL (top 63%) — families likely to look elsewhere, expect single-tenant / working-renter base with shorter leases.
- Zoned schools: Park Ridge Elementary School (math 26% / reading 24%, grade F, #2,030 of 2,144 statewide, top 95%, 577 students, 79% FRL); Lyons Creek Middle School (math 49% / reading 53%, grade C, #237 of 571 statewide, top 43%, 1,757 students, 60% FRL); Deerfield Beach High School (math 12% / reading 37%, grade F, #505 of 667 statewide, top 79%, 2,251 students, 69% FRL) — zoned schools average 69% FRL vs 51% district-wide (18 pts higher); higher-poverty schools than district average — tighter screening recommended.
- Zoned-school proficiency averages 34% at this address vs 48% district-wide (-14 pts) — the specific schools serving this property underperform the Broward average; the district grade overstates school quality for this exact location.
- Market conditions: Rents flat; 586 active listings in the ZIP; 40 comparable units currently listed for rent nearby; rentals at typical pace (median 24d on market — plan ~3-4 weeks tenant-placement turnaround); 2,111 units permitted in Broward County in 2024 (1,265 in 5+ unit buildings).
Forward outlook
- Local home prices are declining (-3.0%/yr); year-one equity from $1k of loan paydown is wiped out by about $4k of value loss. Plan a longer hold.
- Broward County population projected at +34% by 2050 — long-run rental-demand tailwind backs the buy-and-hold thesis.
Negotiation context
- It's been on market 85 days — a 6% lower offer ($136k) is reasonable based on typical stale-listing flexibility.
- 10 sale attempts since 17y ago; this cycle's ask has dropped $15k (9%) from the opening price — seller is motivated, your offer sets the floor, not the list.
- Current owner paid $120k; 21% above their basis — modest negotiation headroom, anchor on the comps not their cost.
Risks & watch-outs
- Watch-outs: HOA is 36% of rent.
- Climate carrying-cost: severe wind risk, 99% chance of damaging wind over 30y; extreme-heat days projected 7→27/yr by 2055 (HVAC capex compounding) — expect insurance premiums to compound above CPI over the hold.
Questions for the listing agent
- What do current leases actually rent for vs. the listed asking? Can we see a recent rent roll and the last 12 months of T-12 income?
- It's been on market 85 days. Have you received any prior offers? Is the seller open to a 15% concession, seller financing, or rate buy-down credit?
- What does the HOA fee cover, when was the last increase, and are there any pending special assessments or reserve-fund shortfalls?
- Any open or pending special assessments — roof, HVAC, plumbing, elevator, façade? What's the per-unit balance and payoff schedule, and is the seller paying it off at close or rolling it to the buyer?
- Why hasn't it sold? Are there any deal-killer items the seller is aware of (foundation, flood, title, zoning, code violations)?
- Is there a deadline driving the sale (1031 exchange, divorce, estate, relocation)? That informs how much negotiation room exists.
- Schools are D-rated, which usually means shorter tenancies and higher turnover. Who's the typical renter profile here, and what's been the actual vacancy rate?
- The area grade is low — what's the realistic commute time and amenity access for the typical tenant pool here? Any planned neighborhood developments (good or bad) we should know about?
- What's the average days-on-market for RENTAL listings here right now (not sales)? A rising rental-DOM trend means longer vacancies and softer asking-rent achievability than the comps imply.
- What's the recent tenant-quality profile in this submarket — average credit score on applications, eviction rate, late-payment / NSF rate, and stable-employment percentage? A property-management company in the area should have these aggregated.
- How much new apartment / multifamily construction is in the pipeline within 1–3 miles? Heavy new supply (>2% of stock underway) typically softens rents 12–24 months out; light construction supports rent growth.
Investment metrics
- 1% rule
- 1.47% ✓
- Cap rate
- 5.24%
- Cash-on-cash
- -3.75%
- DSCR
- 0.83
- GRM
- 5.7
CMA / ARV
No comps found within radius.
Projected returns pro-forma
-3.0% appreciation · 0.1% rent growth · sell at horizon
- IRR
- -28.6%
- Equity multiple
- 0.09×
- Total profit
- $-37,087
- Equity at exit
- $21,620
- IRR
- -70.5%
- Equity multiple
- -0.57×
- Total profit
- $-63,919
- Equity at exit
- $12,537
Cash invested: $40,600 (down + closing). Projections, not guarantees.
Landlord ↔ Tenant lean methodology
- Overall (STATE)
- 87 Strongly Landlord-Friendly
- State Florida
- 87 Strongly Landlord-Friendly · R+3
- County
- — inherits STATE
- City
- — inherits STATE
ZIP-level market 33442
- Rents YoY
- 0.1%
- Active inventory
- 586
- Price-to-rent
- 5.7×
Monthly cashflow live
- Estimated rent
- $2,127 high interval (Pro) →
- Mortgage (P&I)
- −$760
- Tax from tax record
- −$226 /mo · $2,715/yr
- Insurance
- −$60
- HOA
- −$760
- Vacancy / Maint / Mgmt
- −$447
- Net cashflow
- $-127
Break-even live
UW: 25.0% down · 7.5% · 30yr · 1.5% tax · 5.0% vac · 8.0% maint · 8.0% mgmt
Financing live
Cash to close
- Down payment
- $36,250
- Closing costs
- $4,350
- Reserves months
- —
- Total cash needed
- —
Loan-product check · same deal, 3 products live
Conventional
25% down · 7.5% · 30yr
- Down + closing
- —
- Monthly P&I
- —
- Monthly cashflow
- —
- DSCR
- —
- Eligible?
- —
Personal DTI + credit; lowest rate.
DSCR
20% down · 8.5% · 30yr
- Down + closing
- —
- Monthly P&I
- —
- Monthly cashflow
- —
- DSCR
- —
- Eligible?
- —
No personal income docs; deal must DSCR.
Hard money
10% down · 12.0% · 12mo
- Down + closing
- —
- Monthly P&I
- —
- Monthly cashflow
- —
- DSCR
- —
- Eligible?
- —
Short-term bridge; refi at stabilization.
Rent comps 40 comps
| Address | Beds | Baths | Sqft | Rent | $/sqft | DOM | Units | Dist |
|---|---|---|---|---|---|---|---|---|
| 1266 S Military Trl Deerfield Beach, FL | 1.0–2.0 | 1.0–2.0 | 1050 | $2,300 | $2.19 | 22d | 2 | 0.02mi |
| 1272 S Military Trl #313 Deerfield Beach, FL | 2.0 | 2.0 | 900 | $2,390 | $2.66 | 22d | 1 | 0.07mi |
| 1234 S Military Trl #1811 Deerfield Beach, FL | 2.0 | 2.0 | 1099 | $2,500 | $2.27 | 24d | 1 | 0.12mi |
| 1250 S Military Trl #1612 Deerfield Beach, FL | 2.0 | 1.5 | 1035 | $2,500 | $2.42 | 5d | 1 | 0.12mi |
| 1244 S Military Trl #724 Deerfield Beach, FL | 2.0 | 1.5 | 916 | $1,950 | $2.13 | 14d | 1 | 0.12mi |
| 2355 SW 15th St Deerfield Beach, FL | 2.0 | 2.0 | 1100 | $2,098 | $1.91 | 24d | 2 | 0.18mi |
| 1230 S Military Trl #2014 Deerfield Beach, FL | 2.0 | 2.0 | 937 | $2,400 | $2.56 | 24d | 1 | 0.18mi |
| 1230 S Military Trl #2014 Deerfield Beach, FL | 2.0 | 2.0 | 937 | $2,400 | $2.56 | 16d | 1 | 0.18mi |
| 1100 S Military Trl Deerfield Beach, FL | 2.0–3.0 | 1.0–2.0 | 1119 | $2,250 | $2.01 | 24d | 2 | 0.36mi |
| 137 Farnham F #137 Deerfield Beach, FL | 1.0 | 1.5 | 700 | $2,500 | $3.57 | 24d | 1 | 0.42mi |
| 3042 Harwood E Unit 3042 Deerfield Beach, FL | 2.0 | 2.0 | 860 | $3,000 | $3.49 | 24d | 1 | 0.42mi |
| 144 Farnham F Unit F Deerfield Beach, FL | 2.0 | 1.5 | 828 | $2,500 | $3.02 | 24d | 1 | 0.44mi |
| 137 Farnham F Deerfield Beach, FL | 1.0 | 1.5 | 708 | $2,000 | $2.82 | 24d | 1 | 0.44mi |
| 329 Farnham P #329 Deerfield Beach, FL | 1.0 | 1.5 | 700 | $1,450 | $2.07 | 24d | 1 | 0.44mi |
| 333 Farnham P Unit P Deerfield Beach, FL | 2.0 | 1.5 | 828 | $1,800 | $2.17 | 20d | 1 | 0.44mi |
| 306 Newport T #306 Deerfield Beach, FL | 1.0 | 1.0 | 585 | $1,350 | $2.31 | 24d | 1 | 0.61mi |
| 660 Cypress Club Way Unit L11 Deerfield Beach, FL | 1.0 | 1.0 | 605 | $1,625 | $2.69 | 12d | 1 | 0.67mi |
| 436 Markham S #436 Deerfield Beach, FL | 1.0 | 1.0 | 585 | $1,400 | $2.39 | 24d | 1 | 0.68mi |
| 640 Cypress Club Way Unit G Pompano Beach, FL | 2.0 | 2.0 | 891 | $1,950 | $2.19 | 24d | 1 | 0.68mi |
| 731 Cypress Ln Unit D Pompano Beach, FL | 1.0 | 1.0 | 605 | $1,650 | $2.73 | 18d | 1 | 0.69mi |
| 124 Oakridge I #124 Deerfield Beach, FL | 2.0 | 1.5 | 820 | $1,700 | $2.07 | 4d | 1 | 0.70mi |
| 111 Oakridge I #111 Deerfield Beach, FL | 1.0 | 1.5 | 706 | $1,595 | $2.26 | 24d | 1 | 0.70mi |
| 800 Cypress Park Way Unit M Pompano Beach, FL | 2.0 | 2.0 | 807 | $2,000 | $2.48 | 2d | 1 | 0.70mi |
| 800 Cypress Park Way Unit F1 Deerfield Beach, FL | 2.0 | 2.0 | 807 | $2,000 | $2.48 | 24d | 1 | 0.70mi |
| 295 Newport Dr Unit 295 Deerfield Beach, FL | 1.0 | 1.0 | 595 | $1,450 | $2.44 | 24d | 1 | 0.74mi |
| 631 Cypress Lake Blvd Unit O17 Deerfield Beach, FL | 2.0 | 2.0 | 807 | $2,100 | $2.60 | 24d | 1 | 0.75mi |
| 631 Cypress Lake Blvd Unit P17 Deerfield Beach, FL | 2.0 | 2.0 | 807 | $1,950 | $2.42 | 12d | 1 | 0.75mi |
| 308 Markham N Deerfield Beach, FL | 1.0 | 1.5 | 700 | $1,200 | $1.71 | 24d | 1 | 0.75mi |
| 358 Markham Cres Unit 358 Deerfield Beach, FL | 1.0 | 1.5 | 700 | $1,500 | $2.14 | 24d | 1 | 0.78mi |
| 316 Markham Cres Deerfield Beach, FL | 2.0 | 1.5 | 820 | $1,800 | $2.20 | 24d | 1 | 0.79mi |
| 226 Newport O Deerfield Beach, FL | 1.0 | 1.5 | 700 | $1,700 | $2.43 | 24d | 1 | 0.83mi |
| 226 Newport O Deerfield Beach, FL | 1.0 | 1.5 | 700 | $1,600 | $2.29 | 3d | 1 | 0.83mi |
| 624 NW 47th St Deerfield Beach, FL | 2.0 | 2.0 | 793 | $2,100 | $2.65 | 15d | 1 | 0.84mi |
| 616 NW 47th St Deerfield Beach, FL | 2.0 | 2.0 | 793 | $2,495 | $3.15 | 4d | 1 | 0.84mi |
| 193 Newport Ct #193 Deerfield Beach, FL | 2.0 | 1.5 | 820 | $2,200 | $2.68 | 24d | 1 | 0.86mi |
| 125 Newport I Unit I Deerfield Beach, FL | 1.0 | 1.5 | 700 | $1,600 | $2.29 | 24d | 1 | 0.87mi |
| 551 NW 46th St Deerfield Beach, FL | 2.0 | 2.0 | 952 | $2,485 | $2.61 | 24d | 1 | 0.88mi |
| 181 Newport Ct #181 Deerfield Beach, FL | 1.0 | 1.5 | 700 | $1,650 | $2.36 | 24d | 1 | 0.91mi |
| 170 Newport K Deerfield Beach, FL | 1.0 | 1.0 | 585 | $1,430 | $2.44 | 24d | 1 | 0.91mi |
| 3016 Cambridge A Unit A Deerfield Beach, FL | 1.0 | 1.5 | 700 | $1,350 | $1.93 | 24d | 1 | 0.96mi |
HOA detail condo
- Monthly dues
- $760 · $9,120/yr
- Likely covers
- waterpoolsecurity
- Assessments
- None detected in remarks — confirm with the listing agent.
Listing history 36 events
-
2026-06-07status $145,000 Pending 85 DOM
-
2026-06-04days on market $145,000 Active 85 DOM
-
2026-06-03days on market $145,000 Active 84 DOM
-
2026-06-02days on market $145,000 Active 83 DOM
-
2026-06-01days on market $145,000 Active 82 DOM
-
2026-05-31days on market $145,000 Active 81 DOM
-
2026-05-18price $145,000
-
2026-02-23$160,000 Active
-
2025-03-31historical
-
2025-03-19price $225,000
-
2025-02-13price $230,000
-
2025-01-22$235,000 Active
-
2025-01-20historical
-
2024-08-22$260,987 Active
-
2021-03-11soldstatus $120,000 Closed
-
2021-03-11soldstatus $115,000
-
2021-01-27historical Active Under Contract
-
2021-01-18$120,000 Active
-
2020-10-21status Pending
-
2020-10-20historical
-
2020-10-03status Active
-
2020-09-30historical
-
2020-08-22$119,000 Active
-
2020-08-08historical
-
2020-05-08$119,000 Active
-
2019-02-14historical
-
2018-12-05price $129,900
-
2018-09-27$139,900 Active
-
2018-06-22historical
-
2018-06-13$122,500 Active
-
2010-02-24historical
-
2009-08-29$45,000
-
2002-03-18soldstatus $75,000
-
1998-03-05soldstatus $43,000
-
1991-05-09soldstatus $46,000
-
1991-05-01soldstatus $46,000
ⓘ Source: listings_history table (triggers on properties + properties_extension) + one-shot
backfill from property_details.listing_events for pre-trigger history.
Tax reassessment forecast FL · Resets to sale price
- Current annual tax
- $2,715 · $226/mo
- Projected year-2 tax
- $2,715 · $226/mo
- Expected delta
- $0/yr ($0/mo · 0.0%)
ⓘ Screening estimate from a state-policy table — verify with the county assessor before closing.
Climate risk First Street
- Flood 1/10 Low FEMA zone X (unshaded) · 0% chance over 30 yrs
- Wildfire 1/10 Low
- Heat 9/10 Extreme 7 d/yr ≥107°F today · 27 d/yr by 30 yrs out
- Wind 10/10 Extreme 99% chance of damaging wind over 30 yrs
- Air quality 2/10 Low 1 unhealthy d/yr today · 3 by 30 yrs out
Nearby sold comps map
Loading sold comps map…
Walkable amenities ~0.75 mi
Loading nearby amenities…
Taxation est. · year 1
- Rental income
- $25,520
- − Mortgage interest
- −$8,122
- − Property taxes
- −$2,715
- − Insurance
- −$725
- − Repairs & maintenance
- −$2,042
- − Management
- −$2,042
- − HOA
- −$9,120
- − Depreciation
- −$4,218
- Taxable loss
- −$3,463
- Est. tax savings @ 24.0%
- +$831
- After-tax cash flow
- $-692/yr
For passive investors: Depreciation is non-cash, so a rental often shows a tax loss while cash-flowing — sheltering income. Rental losses are passive: they offset passive income freely, and up to $25,000/yr can offset ordinary (W-2) income if you actively participate and your MAGI is under $100k (phasing out to $0 by $150k); unused losses carry forward. On sale, claimed depreciation is recaptured at up to 25%, and gains may owe capital-gains tax (a 1031 exchange can defer both). Figures are a year-1 estimate at your 24.0% rate — not tax advice; consult a CPA.
Schools (NCES district)
- District
- Broward
- NCES district ID
- 1200180
- Math proficiency
- 42% ▼ -18.00%
- Reading proficiency
- 53% ▼ -5.00%
- Median HH income
- $52,139
- Composite
- 40.88/100
- National rank
- #3621
- State rank
- #46 of 73 in FL
Livability — Deerfield Beach
- Score
- 75/100
- State rank
- #250
- US rank
- #3970
Category grades
Schools grade is shown separately in the Schools card above.
Census & demographics
- Census place
- Deerfield Beach, FL
- County
- Broward County · 1,963,430 people
- City population
- 61,449
- Metro
- Miami-Fort Lauderdale-Pompano Beach, FL
- Population (ZIP)
- 31,296
- Household income
- $53,254
- Rent vs Own
- Severe rent burden
- 2169.0
Population outlook (Broward County) Hauer SSP2
- Today (2025)
- 2,207,033 people
- By 2030
- 2,360,704 · +7.0%
- By 2040
- 2,661,208 · +20.6%
- By 2050
- 2,946,698 · +33.5%
- By 2075
- 3,602,273 · +63.2%
- By 2100
- 3,970,984 · +79.9%
Race, ethnicity, and origin ACS 2023
- Neighborhood character
- Diverse neighborhood (Simpson 0.61)
- Race & ethnicity
- White 57% Hispanic / Latino 23% Two or more races 19% Black 10% Asian 2%
- Hispanic origin (detail)
- Mexican 1% Puerto Rican 4% Cuban 3%
- Common ancestry
- Estonian 7% Romanian 4% Hispanic 3%
- Foreign-born
- 34% · Canada, Jamaica, Dominican Republic
- Languages at home
- 59% English-only · Spanish 20% Other Indo-European 13% French/Haitian/Cajun 4%
Political lean MEDSL · Broward
- 2024 margin
- D (+17.0) · D 58.0% · R 41.0%
- 2008→2024 swing
- -17.8pp toward R · 2008: 34.7pp · 2024: 17.0pp
- All cycles
- 2024: D+17.0 2020: D+29.8 2016: D+35.0 2012: D+34.9 2008: D+34.7
Not yet ingested
- Civics
- —
Market trends
- HPI YoY
- ▼ -280.44%
- Current HPI
- 323.0166
- Rent YoY
- ▲ 0.10%
- Metro
- Miami-Fort Lauderdale-Pompano Beach, FL
- State GDP YoY
- ▲ 3.28%
- F500 in state
- 36
Industry mix (Fortune 500 HQ in FL)
| Industry | F500 HQs | Revenue |
|---|---|---|
| Industrial Technology | 2 | $29B |
|
||
| Insurance | 2 | $17B |
|
||
| Retail | 1 | $60B |
|
||
| Technology Distribution | 1 | $58B |
|
||
| Homebuilding | 1 | $35B |
|
||
| Technology Manufacturing | 1 | $35B |
|
||
Price history
+215.2% since first listed30 events — show timeline
- 2026-05-18 Price Changed $145,000 Beaches MLS
- 2026-02-23 Listed $160,000 Beaches MLS
- 2025-03-31 Listing Removed — Beaches MLS
- 2025-03-19 Price Changed $225,000 Beaches MLS
- 2025-02-13 Price Changed $230,000 Beaches MLS
- 2025-01-22 Listed $235,000 Beaches MLS
- 2025-01-20 Listing Removed — Beaches MLS
- 2024-08-22 Listed $260,987 Beaches MLS
- 2021-03-11 Sold (Public Records) $115,000 Public Records
- 2021-03-11 Sold (MLS) $120,000 Beaches MLS
- 2021-01-27 Contingent — Beaches MLS
- 2021-01-18 Listed $120,000 Beaches MLS
- 2020-10-21 Pending — MARMLS
- 2020-10-20 Listing Removed — MARMLS
- 2020-10-03 Relisted — MARMLS
- 2020-09-30 Listing Removed — MARMLS
- 2020-08-22 Listed $119,000 MARMLS
- 2020-08-08 Listing Removed — MARMLS
- 2020-05-08 Listed $119,000 MARMLS
- 2019-02-14 Listing Removed — MARMLS
- 2018-12-05 Price Changed $129,900 MARMLS
- 2018-09-27 Listed $139,900 MARMLS
- 2018-06-22 Listing Removed — Beaches MLS
- 2018-06-13 Listed $122,500 Beaches MLS
- 2010-02-24 Listing Removed — Beaches MLS
- 2009-08-29 Listed $45,000 Beaches MLS
- 2002-03-18 Sold (Public Records) $75,000 Public Records
- 1998-03-05 Sold (Public Records) $43,000 Public Records
- 1991-05-09 Sold (Public Records) $46,000 Public Records
- 1991-05-01 Sold (Public Records) $46,000 Public Records
Property tax history
+6.8%/yrLatest (2025): $2,715 · +5.7% YoY. Source: county tax records.
Cash-flow waterfall
monthlySold comps — $/sqft
last 12 mo · ≤1 miLoading sold comps…