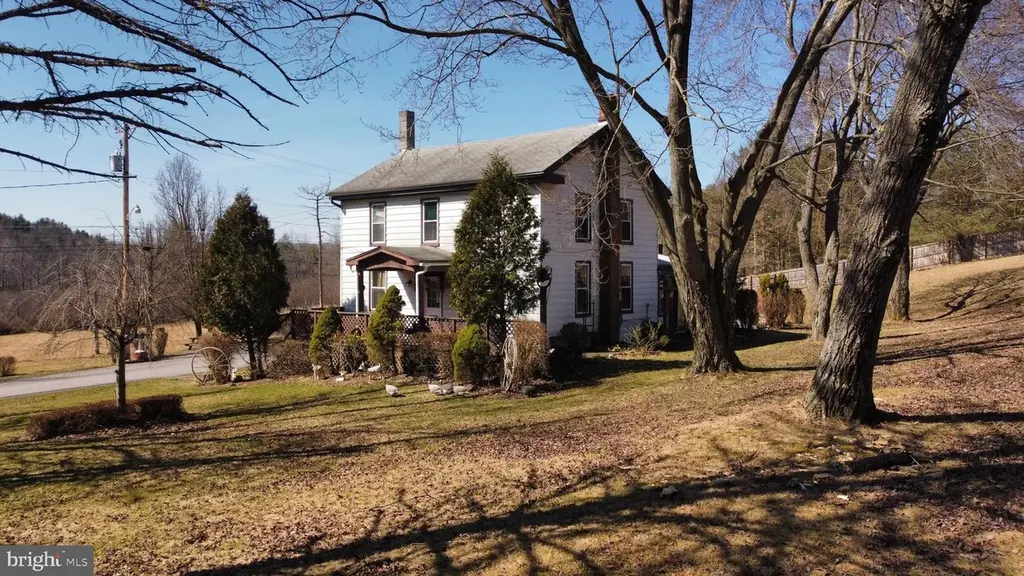
352 Graham Station Rd · Decatur, PA
Flood risk 1/10 · Minimal
- FEMA flood zone
- X (unshaded)
- Chance of flooding over 30 yrs
- 0.0%
- Est. flood insurance / yr
- $473 – $860
Fire risk 2/10 · Minimal
- Est. fire insurance / yr
- $511 – $949
Heat risk 2/10 · Minimal
- Hot days now (above 93°F)
- 7 days/yr
- Hot days in 30 yrs
- 17 days/yr
Wind risk 2/10 · Minimal
- Chance of severe wind over 30 yrs
- —
Air-quality risk 2/10 · Minimal
- Unhealthy air days now
- 1 days/yr
- Unhealthy air days in 30 yrs
- 2 days/yr
Risk factors via First Street. Map © Google.
Why this score? — see what drove the C- grade
The composite is a weighted blend of 9 inputs, each scored 0–100. Each bar is that input's sub-score; the figure is the points it added to the 100-point composite (weight × sub-score).
- Cash flow +16.2/30.0
- Appreciation +10.0/10.0
- ARV discount +6.4/15.0
- DSCR +5.0/10.0
- 1% rule +4.0/10.0
- Schools +3.9/10.0
- Rent growth +2.5/5.0
- Livability +2.5/5.0
- Condition / age +2.5/5.0
$180,000
🖨 Deal sheet (PDF) 📄 Offer letter ✓ Due diligence
Listing remarks MLS
Awaiting just outside the heart of Philipsburg sits this 4 bedroom 2 bath home on over 5 acres. The first floor features a large eat-in kitchen, off of the kitchen is a sunroom with laundry hookups, a living room spacious enough for the whole family, as well as the master bedroom, and a bathroom. On the second floor there are 3 additional bedrooms and one large bathroom. A smaller room on the second floor is the perfect sized room for an office or craft space. Access the basement from one of two staircases inside the home or from the walkout inside the carport. In the basement is a supplemental coal and wood burning heat source. In addition to the carport, there is a two car detached garage.
Key facts
- 5.73 acre lot
- 2 garage spots
- Built 1969
Neighborhood map
What this means for you Summary
Snapshot
- This is a 4-bed/2.0-bath other listed at $180k.
Deal economics
- At list price, monthly cash flow is $97 ($1k/yr) — positive.
- The deal already cash-flows at list — no discount required.
- To meet the 1% rule (rent ≥ 1% of price), the offer needs to be $162k (9.8% below list).
- Recommended offer: $162k (9.8% below list) — sets the bar for 1% rule.
Location & tenants
- Location reads: area grade C — affects rentability + tenant quality, not the cash-flow math above.
- Philipsburg-Osceola Area SD (town): math 42% / reading 52% proficiency, ranked #258 of 539 in PA (top 48%) — families likely to look elsewhere, expect single-tenant / working-renter base with shorter leases.
- Zoned schools: Philipsburg El Sch (math 52% / reading 62%, grade C+, #444 of 1,518 statewide, top 32%, 406 students, 59% FRL); Philipsburg-Osceola Area Ms (math 27% / reading 43%, grade F, #322 of 512 statewide, top 64%, 379 students, 57% FRL); Philipsburg-Osceola Area Hs (math 67%, 520 students, 38% FRL).
- Market conditions: 40 active listings in the ZIP; 99 units permitted in Clearfield County in 2024 (10 in 5+ unit buildings).
Forward outlook
- In year one you build about $19k of equity ($1k loan paydown + $18k appreciation (10.0% local appreciation)).
- Clearfield County population projected at -12% by 2050 — secular population decline; favor cash flow + early exit over multi-decade hold.
- At projected returns (10.0% appreciation + 3.0% rent growth), your $50k cash investment doubles in ~3 years — after that, you're playing with house money.
- By year 2, paydown + projected appreciation supports a ~$31k cash-out refi (75% LTV) — recoverable capital for the next deal without selling this one.
Negotiation context
- It's been on market 76 days — a 6% lower offer ($169k) is reasonable based on typical stale-listing flexibility.
- 3 sale attempts since 8y ago with the ask held roughly flat each time — persistent listings suggest the price (not the market) is what's stuck; bring a comps-based counter.
Questions for the listing agent
- It's been on market 76 days. Have you received any prior offers? Is the seller open to a 10% concession, seller financing, or rate buy-down credit?
- Built in 1969 — when were the roof, HVAC, electrical panel, plumbing, and water heater last replaced?
- Why hasn't it sold? Are there any deal-killer items the seller is aware of (foundation, flood, title, zoning, code violations)?
- Is there a deadline driving the sale (1031 exchange, divorce, estate, relocation)? That informs how much negotiation room exists.
- What's the average days-on-market for RENTAL listings here right now (not sales)? A rising rental-DOM trend means longer vacancies and softer asking-rent achievability than the comps imply.
- What's the recent tenant-quality profile in this submarket — average credit score on applications, eviction rate, late-payment / NSF rate, and stable-employment percentage? A property-management company in the area should have these aggregated.
- How much new for-sale + rental construction is in the pipeline within 1–3 miles? Heavy new supply typically softens prices + rents 12–24 months out; constrained supply supports both.
Investment metrics
- 1% rule
- 0.90% ✗
- Cap rate
- 6.94%
- Cash-on-cash
- 2.31%
- DSCR
- 1.10
- GRM
- 9.2
CMA / ARV
- ARV (median comp)
- $175,741
- List price
- $180,000
- Delta
- 2.42%
- Verdict
- FAIR
- Comps
- 2 within 1.0 mi
Projected returns pro-forma
10.0% appreciation · 3.0% rent growth · sell at horizon
- IRR
- 25.9%
- Equity multiple
- 3.07×
- Total profit
- $104,199
- Equity at exit
- $162,158
- IRR
- 22.8%
- Equity multiple
- 6.99×
- Total profit
- $301,970
- Equity at exit
- $349,700
Cash invested: $50,400 (down + closing). Projections, not guarantees.
Landlord ↔ Tenant lean methodology
- Overall (STATE)
- 62 Landlord-Friendly
- State Pennsylvania
- 62 Landlord-Friendly · EVEN
- County
- — inherits STATE
- City
- — inherits STATE
ZIP-level market 16866
- Home prices YoY
- 12.0%
- Active inventory
- 40
- Price-to-rent
- 9.2×
Monthly cashflow live
- Estimated rent
- $1,624 medium interval (Pro) →
- Mortgage (P&I)
- −$944
- Tax from tax record
- −$167 /mo · $2,006/yr
- Insurance
- −$75
- HOA
- −$0
- Vacancy / Maint / Mgmt
- −$341
- Net cashflow
- $97
Break-even live
Sensitivity live
| Price | -10% $199 | -5% $148 | +0% $97 | +5% $46 | +10% $-5 |
|---|---|---|---|---|---|
| Rent | -10% $-31 | -5% $33 | +0% $97 | +5% $161 | +10% $225 |
| Rate | -1.0pp $188 | -0.5pp $143 | base $97 | +0.5pp $50 | +1.0pp $3 |
UW: 25.0% down · 7.5% · 30yr · 1.5% tax · 5.0% vac · 8.0% maint · 8.0% mgmt
Financing live
Cash to close
- Down payment
- $45,000
- Closing costs
- $5,400
- Reserves months
- —
- Total cash needed
- —
Loan-product check · same deal, 3 products live
Conventional
25% down · 7.5% · 30yr
- Down + closing
- —
- Monthly P&I
- —
- Monthly cashflow
- —
- DSCR
- —
- Eligible?
- —
Personal DTI + credit; lowest rate.
DSCR
20% down · 8.5% · 30yr
- Down + closing
- —
- Monthly P&I
- —
- Monthly cashflow
- —
- DSCR
- —
- Eligible?
- —
No personal income docs; deal must DSCR.
Hard money
10% down · 12.0% · 12mo
- Down + closing
- —
- Monthly P&I
- —
- Monthly cashflow
- —
- DSCR
- —
- Eligible?
- —
Short-term bridge; refi at stabilization.
Listing history 22 events
-
2026-06-21days on market $180,000 Active 76 DOM
-
2026-06-21days on market $180,000 Active 75 DOM
-
2026-06-18days on market $180,000 Active 73 DOM
-
2026-06-17days on market $180,000 Active 72 DOM
-
2026-06-16days on market $180,000 Active 71 DOM
-
2026-06-15days on market $180,000 Active 70 DOM
-
2026-06-13days on market $180,000 Active 68 DOM
-
2026-06-12days on market $180,000 Active 67 DOM
-
2026-06-09days on market $180,000 Active 64 DOM
-
2026-06-08days on market $180,000 Active 63 DOM
-
2026-06-08days on market $180,000 Active 62 DOM
-
2026-06-07days on market $180,000 Active 61 DOM
-
2026-06-04days on market $180,000 Active 58 DOM
-
2026-06-02days on market $180,000 Active 57 DOM
-
2026-06-01days on market $180,000 Active 56 DOM
-
2026-05-31days on market $180,000 Active 55 DOM
-
2026-04-06$180,000 Active 700-char remark
Show marketing remark (700 chars)
Awaiting just outside the heart of Philipsburg sits this 4 bedroom 2 bath home on over 5 acres. The first floor features a large eat-in kitchen, off of the kitchen is a sunroom with laundry hookups, a living room spacious enough for the whole family, as well as the master bedroom, and a bathroom. On the second floor there are 3 additional bedrooms and one large bathroom. A smaller room on the second floor is the perfect sized room for an office or craft space. Access the basement from one of two staircases inside the home or from the walkout inside the carport. In the basement is a supplemental coal and wood burning heat source. In addition to the carport, there is a two car detached garage.
-
2024-12-31historical
-
2024-05-17price $209,900
-
2024-03-14$229,000 Active
-
2019-01-01historical
-
2018-04-09$33,000
ⓘ Source: listings_history table (triggers on properties + properties_extension) + one-shot
backfill from property_details.listing_events for pre-trigger history.
Tax reassessment forecast PA · Partial reset (capped growth)
- Current annual tax
- $2,006 · $167/mo
- Projected year-2 tax
- $2,425 · $202/mo
- Expected delta
- +$419/yr (+$35/mo · 20.9%)
ⓘ Screening estimate from a state-policy table — verify with the county assessor before closing.
Climate risk First Street
- Flood 1/10 Low FEMA zone X (unshaded) · 0% chance over 30 yrs
- Wildfire 2/10 Low
- Heat 2/10 Low 7 d/yr ≥93°F today · 17 d/yr by 30 yrs out
- Wind 2/10 Low
- Air quality 2/10 Low 1 unhealthy d/yr today · 2 by 30 yrs out
Nearby sold comps map
Loading sold comps map…
Walkable amenities ~0.75 mi
Loading nearby amenities…
Taxation est. · year 1
- Rental income
- $19,490
- − Mortgage interest
- −$10,083
- − Property taxes
- −$2,006
- − Insurance
- −$900
- − Repairs & maintenance
- −$1,559
- − Management
- −$1,559
- − Depreciation
- −$5,236
- Taxable loss
- −$1,853
- Est. tax savings @ 24.0%
- +$445
- After-tax cash flow
- $1,609/yr
For passive investors: Depreciation is non-cash, so a rental often shows a tax loss while cash-flowing — sheltering income. Rental losses are passive: they offset passive income freely, and up to $25,000/yr can offset ordinary (W-2) income if you actively participate and your MAGI is under $100k (phasing out to $0 by $150k); unused losses carry forward. On sale, claimed depreciation is recaptured at up to 25%, and gains may owe capital-gains tax (a 1031 exchange can defer both). Figures are a year-1 estimate at your 24.0% rate — not tax advice; consult a CPA.
Schools (NCES district)
- District
- Philipsburg-Osceola Area SD
- NCES district ID
- 4219020
- Math proficiency
- 42% ▼ -9.00%
- Reading proficiency
- 52% ▼ -10.00%
- Median HH income
- $40,645
- Composite
- 39.37/100
- National rank
- #3977
- State rank
- #258 of 539 in PA
Livability — Decatur
No livability data for this city. (Only ~50 U.S. cities are tracked.)
Census & demographics
- Population (ZIP)
- 8,924
Population outlook (Clearfield County) Hauer SSP2
- Today (2025)
- 79,658 people
- By 2030
- 78,358 · -1.6%
- By 2040
- 74,670 · -6.3%
- By 2050
- 70,186 · -11.9%
- By 2075
- 60,391 · -24.2%
- By 2100
- 46,886 · -41.1%
Race, ethnicity, and origin ACS 2023
- Neighborhood character
- Predominantly White (86%)
- Race & ethnicity
- White 86% Hispanic / Latino 6% Black 6% Two or more races 3%
- Hispanic origin (detail)
- Mexican 2% Dominican 1%
- Common ancestry
- Romanian 7% Slovak 2% Polish 1%
- Foreign-born
- 7% · Canada, Jamaica
- Languages at home
- 92% English-only · Spanish 6%
Political lean MEDSL · Clearfield
- 2024 margin
- Solid R (+51.5) · D 23.9% · R 75.4%
- 2008→2024 swing
- -39.4pp toward R · 2008: -12.1pp · 2024: -51.5pp
- All cycles
- 2024: R+51.5 2020: R+49.5 2016: R+49.6 2012: R+28.9 2008: R+12.1
Not yet ingested
- Civics
- —
Market trends
- HPI YoY
- ▲ 30.47%
- Current HPI
- 284.148
- Rent YoY
- —
- Metro
- —
- State GDP YoY
- ▲ 1.68%
- F500 in state
- 34
Industry mix (Fortune 500 HQ in PA)
| Industry | F500 HQs | Revenue |
|---|---|---|
| Healthcare | 2 | $309B |
|
||
| Insurance | 2 | $27B |
|
||
| Telecommunications / Media | 1 | $124B |
|
||
| Industrial Distribution | 1 | $22B |
|
||
| Financial Services | 1 | $20B |
|
||
| Chemicals / Materials | 1 | $18B |
|
||
Price history
+445.5% since first listed6 events — show timeline
- 2026-04-06 Listed $180,000 BRIGHT MLS
- 2024-12-31 Listing Removed — BRIGHT MLS
- 2024-05-17 Price Changed $209,900 BRIGHT MLS
- 2024-03-14 Listed $229,000 BRIGHT MLS
- 2019-01-01 Listing Removed — BRIGHT MLS
- 2018-04-09 Listed $33,000 BRIGHT MLS
Property tax history
+2.7%/yrLatest (2026): $2,006 · +6.4% YoY. Source: county tax records.
Cash-flow waterfall
monthlySold comps — $/sqft
last 12 mo · ≤1 miLoading sold comps…