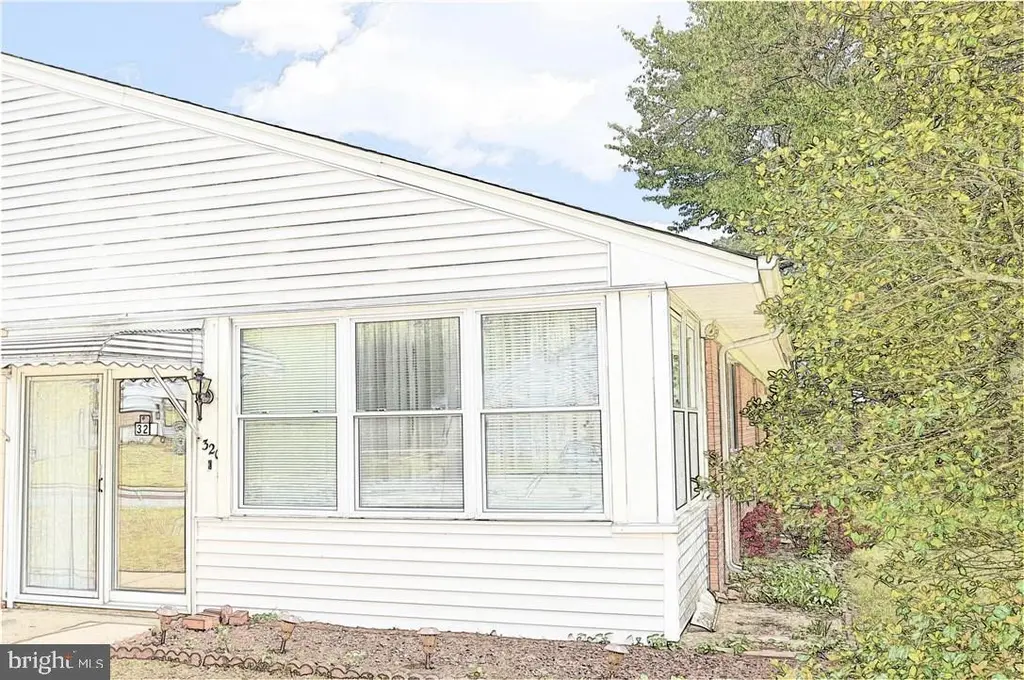
32 Crestwood Pkwy Unit C · Crestwood Village, NJ
Flood risk 9/10 · Severe
- FEMA flood zone
- X (unshaded)
- Chance of flooding over 30 yrs
- 0.99%
- Est. flood insurance / yr
- $507 – $1,088
Fire risk 7/10 · Major
- Est. fire insurance / yr
- $526 – $976
Heat risk 6/10 · Moderate
- Hot days now (above 102°F)
- 7 days/yr
- Hot days in 30 yrs
- 14 days/yr
Wind risk 6/10 · Moderate
- Chance of severe wind over 30 yrs
- 64.0%
Air-quality risk 3/10 · Minor
- Unhealthy air days now
- 3 days/yr
- Unhealthy air days in 30 yrs
- 4 days/yr
Risk factors via First Street. Map © Google.
Why this score? — see what drove the D grade
The composite is a weighted blend of 9 inputs, each scored 0–100. Each bar is that input's sub-score; the figure is the points it added to the 100-point composite (weight × sub-score).
- Cash flow +15.0/30.0
- ARV discount +7.5/15.0
- 1% rule +5.0/10.0
- DSCR +5.0/10.0
- Livability +3.2/5.0
- Schools +2.9/10.0
- Rent growth +2.5/5.0
- Condition / age +2.5/5.0
- Appreciation +0.0/10.0
$33,000
🖨 Deal sheet (PDF) 📄 Offer letter ✓ Due diligence
Listing remarks
Crestwood Village 1-55+ Community. Come see this Edgewood 1, featuring 1 bedroom 1 bath. This immaculate well maintained unit is located on the corner of Crestwood Parkway and Crestwood Ct on a cul-de-sac. The heated sunroom, is carpeted with ceiling fan and great light. Laundry room has newer washer and dryer. Attic has extra storage and extra insultion. Come see this today!
Key facts
- $227 HOA
- Listed 28 days
Neighborhood map
What this means for you Summary
Snapshot
- This is a 1-bed/1.0-bath townhouse listed at $33k.
Deal economics
- At list price, monthly cash flow is $1k ($12k/yr) — positive.
- The deal already cash-flows at list — no discount required.
- Meets the 1% rule at list price ($2k rent vs $33k).
- Recommended offer: $33k (1.5% below list) — sets the bar for market timing.
- Cap rate 45.7% vs local median 5.5% in Crestwood Village — top-decile yield for the area; either an underpriced asset or a hidden risk that comps aren't pricing in. Stress-test before assuming the spread holds.
Location & tenants
- Location reads 63/100 on livability (#422 in NJ) — a middle-class / working-renter tenant base. Strengths: cost of living A, housing A, health & safety B+; Watch: amenities F, commute F, employment F.
- Manchester Township School District (suburban): math 25% / reading 44% proficiency, ranked #320 of 472 in NJ (top 68%) — families likely to look elsewhere, expect single-tenant / working-renter base with shorter leases.
- Zoned schools: Whiting Elementary School (math 22% / reading 47%, grade F, #582 of 1,303 statewide, top 49%, 301 students, 25% FRL); Manchester Township Middle School (math 28% / reading 45%, grade F, #226 of 431 statewide, top 55%, 582 students, 41% FRL); Manchester Township High School (math 21% / reading 38%, grade F, #290 of 399 statewide, top 74%, 959 students, 38% FRL).
- Market conditions: 658 active listings in the ZIP; 4 comparable units currently listed for rent nearby; rentals at typical pace (median 19d on market — plan ~3-4 weeks tenant-placement turnaround); 4,434 units permitted in Ocean County in 2024 (868 in 5+ unit buildings).
Forward outlook
- Local home prices are declining (-3.0%/yr); year-one equity from $228 of loan paydown is wiped out by about $990 of value loss. Plan a longer hold.
- Ocean County population projected to shrink 8% by 2050 — rents likely to lag national; underwrite the cash flow, not the appreciation.
- At projected returns (-3.0% appreciation + 3.0% rent growth), your $9k cash investment doubles in ~1 year — after that, you're playing with house money.
Negotiation context
- It's been on market 28 days — a 2% lower offer ($33k) is reasonable based on typical stale-listing flexibility.
- 2 sale attempts since 9y ago with the ask held roughly flat each time — persistent listings suggest the price (not the market) is what's stuck; bring a comps-based counter.
Risks & watch-outs
- Watch-outs: flood insurance adds $66/mo.
- Climate carrying-cost: severe flood risk; major wind risk, 64% chance of damaging wind over 30y; major wildfire risk; extreme-heat days projected 7→14/yr by 2055 (HVAC capex compounding) — expect insurance premiums to compound above CPI over the hold.
Questions for the listing agent
- What's the actual annual flood-insurance premium (NFIP or private), and is the property in a SFHA with mandatory coverage?
- What does the HOA fee cover, when was the last increase, and are there any pending special assessments or reserve-fund shortfalls?
- Is there a deadline driving the sale (1031 exchange, divorce, estate, relocation)? That informs how much negotiation room exists.
- Schools are F-rated, which usually means shorter tenancies and higher turnover. Who's the typical renter profile here, and what's been the actual vacancy rate?
- The area grade is low — what's the realistic commute time and amenity access for the typical tenant pool here? Any planned neighborhood developments (good or bad) we should know about?
- What's the average days-on-market for RENTAL listings here right now (not sales)? A rising rental-DOM trend means longer vacancies and softer asking-rent achievability than the comps imply.
- What's the recent tenant-quality profile in this submarket — average credit score on applications, eviction rate, late-payment / NSF rate, and stable-employment percentage? A property-management company in the area should have these aggregated.
- How much new for-sale + rental construction is in the pipeline within 1–3 miles? Heavy new supply typically softens prices + rents 12–24 months out; constrained supply supports both.
Investment metrics
- 1% rule
- 5.90% ✓
- Cap rate
- 45.71%
- Cash-on-cash
- 140.79%
- DSCR
- 7.26
- GRM
- 1.4
CMA / ARV
- ARV (on-the-fly)
- $81,512
- Comps found
- 3
Show comp detail 3 sales within ~0.75 mi
| Address | Dist | Beds/Ba | Sqft | Sold | Price | $/sf | Match |
|---|---|---|---|---|---|---|---|
| 5 Valley Stream Dr Unit B | 0.18mi | 2/1.0 (+1) | 866 (-2%) | 4mo | $70,000 | $81 | 79 |
| 528 Lilac Ln Unit A | 0.53mi | 1/1.0 | 866 (-2%) | 3mo | $80,000 | $92 | 69 |
| 187 Laurel Pl Unit A | 0.54mi | 2/1.5 (+1) | 1,000 (+13%) | 18mo | $102,500 | $103 | 32 |
Match score weights: distance 35% · size 25% · config 20% · recency 20%. Top-matched comps best support the ARV.
Projected returns pro-forma
-3.0% appreciation · 3.0% rent growth · sell at horizon
- IRR
- —
- Equity multiple
- 7.46×
- Total profit
- $59,675
- Equity at exit
- $4,920
- IRR
- —
- Equity multiple
- 15.75×
- Total profit
- $136,272
- Equity at exit
- $2,853
Cash invested: $9,240 (down + closing). Projections, not guarantees.
Landlord ↔ Tenant lean methodology
- Overall (STATE)
- 21 Tenant-Leaning
- State New Jersey
- 21 Tenant-Leaning · D+6
- County
- — inherits STATE
- City
- — inherits STATE
ZIP-level market 08759
- Active inventory
- 658
- Price-to-rent
- 1.4×
Monthly cashflow live
- Estimated rent
- $1,948 medium interval (Pro) →
- Mortgage (P&I)
- −$173
- Tax est. 1.5%
- −$41 /mo · $495/yr
- Insurance
- −$14
- Flood insurance flood zone
- −$66 /mo · $798/yr
- HOA
- −$227
- Vacancy / Maint / Mgmt
- −$409
- Net cashflow
- $1,018
Break-even live
Sensitivity live
| Price | -10% $1,040 | -5% $1,029 | +0% $1,018 | +5% $1,006 | +10% $995 |
|---|---|---|---|---|---|
| Rent | -10% $864 | -5% $941 | +0% $1,018 | +5% $1,095 | +10% $1,172 |
| Rate | -1.0pp $1,034 | -0.5pp $1,026 | base $1,018 | +0.5pp $1,009 | +1.0pp $1,000 |
UW: 25.0% down · 7.5% · 30yr · 1.5% tax · 5.0% vac · 8.0% maint · 8.0% mgmt
Financing live
Cash to close
- Down payment
- $8,250
- Closing costs
- $990
- Reserves months
- —
- Total cash needed
- —
Loan-product check · same deal, 3 products live
Conventional
25% down · 7.5% · 30yr
- Down + closing
- —
- Monthly P&I
- —
- Monthly cashflow
- —
- DSCR
- —
- Eligible?
- —
Personal DTI + credit; lowest rate.
DSCR
20% down · 8.5% · 30yr
- Down + closing
- —
- Monthly P&I
- —
- Monthly cashflow
- —
- DSCR
- —
- Eligible?
- —
No personal income docs; deal must DSCR.
Hard money
10% down · 12.0% · 12mo
- Down + closing
- —
- Monthly P&I
- —
- Monthly cashflow
- —
- DSCR
- —
- Eligible?
- —
Short-term bridge; refi at stabilization.
Rent comps 4 comps
| Address | Beds | Baths | Sqft | Rent | $/sqft | DOM | Units | Dist |
|---|---|---|---|---|---|---|---|---|
| 57D Milford Ave Unit 53 Whiting, NJ | 2.0 | 1.0 | 880 | $1,800 | $2.05 | 26d | 1 | 1.15mi |
| 19B Maplewood Dr #52 Whiting, NJ | 2.0 | 1.5 | 1109 | $2,250 | $2.03 | 19d | 1 | 1.31mi |
| 50 Westport Dr #71 Whiting, NJ | 2.0 | 1.0 | 1120 | $2,200 | $1.96 | 0d | 1 | 1.34mi |
| 4 Autumn Ct Manchester Township, NJ | 2.0 | 2.0 | 1056 | $1,600 | $1.52 | 1d | 1 | 1.42mi |
HOA detail
- Monthly dues
- $227 · $2,724/yr
Listing history 6 events
-
2019-09-13status Pending
-
2019-09-11historical
-
2019-09-10status Pending
-
2017-06-12status Under Contract
-
2017-05-15$33,000 Active
-
2017-05-10$33,000 Active
ⓘ Source: listings_history table (triggers on properties + properties_extension) + one-shot
backfill from property_details.listing_events for pre-trigger history.
Climate risk First Street
- Flood 9/10 Extreme FEMA zone X (unshaded) · 99% chance over 30 yrs
- Wildfire 7/10 Severe
- Heat 6/10 Major 7 d/yr ≥102°F today · 14 d/yr by 30 yrs out
- Wind 6/10 Major 64% chance of damaging wind over 30 yrs
- Air quality 3/10 Moderate 3 unhealthy d/yr today · 4 by 30 yrs out
Nearby sold comps map
Loading sold comps map…
Walkable amenities ~0.75 mi
Loading nearby amenities…
Taxation est. · year 1
- Rental income
- $23,379
- − Mortgage interest
- −$1,849
- − Property taxes
- −$495
- − Insurance
- −$962
- − Repairs & maintenance
- −$1,870
- − Management
- −$1,870
- − HOA
- −$2,724
- − Depreciation
- −$960
- Taxable income
- $12,648
- Est. tax owed @ 24.0%
- −$3,036
- After-tax cash flow
- $9,176/yr
For passive investors: Depreciation is non-cash, so a rental often shows a tax loss while cash-flowing — sheltering income. Rental losses are passive: they offset passive income freely, and up to $25,000/yr can offset ordinary (W-2) income if you actively participate and your MAGI is under $100k (phasing out to $0 by $150k); unused losses carry forward. On sale, claimed depreciation is recaptured at up to 25%, and gains may owe capital-gains tax (a 1031 exchange can defer both). Figures are a year-1 estimate at your 24.0% rate — not tax advice; consult a CPA.
Schools (NCES district)
- District
- Manchester Township School District
- NCES district ID
- 3409450
- Math proficiency
- 25% ▼ -17.00%
- Reading proficiency
- 44% ▼ -5.00%
- Median HH income
- $38,905
- Composite
- 28.8/100
- National rank
- #6662
- State rank
- #320 of 472 in NJ
Livability — Crestwood Village
- Score
- 63/100
- State rank
- #422
- US rank
- #15006
Category grades
Schools grade is shown separately in the Schools card above.
Census & demographics
- Census place
- Crestwood Village, NJ
- City population
- 34,290
- Population (ZIP)
- 34,290
Population outlook (Ocean County) Hauer SSP2
- Today (2025)
- 586,991 people
- By 2030
- 581,403 · -1.0%
- By 2040
- 564,913 · -3.8%
- By 2050
- 538,149 · -8.3%
- By 2075
- 468,845 · -20.1%
- By 2100
- 350,297 · -40.3%
Race, ethnicity, and origin ACS 2023
- Neighborhood character
- Predominantly White (87%)
- Race & ethnicity
- White 87% Hispanic / Latino 5% Black 4% Two or more races 4% Asian 2%
- Hispanic origin (detail)
- Puerto Rican 2%
- Common ancestry
- Romanian 8% Scotch-Irish 2% Lithuanian 2%
- Foreign-born
- 11% · Canada, China
- Languages at home
- 88% English-only · Spanish 3% Russian/Polish/Slavic 2% Other Indo-European 2%
Political lean MEDSL · Ocean
- 2024 margin
- Solid R (+36.0) · D 31.4% · R 67.4% · Other 1.2%
- 2008→2024 swing
- -17.6pp toward R · 2008: -18.4pp · 2024: -36.0pp
- All cycles
- 2024: R+36.0 2020: R+28.7 2016: R+34.0 2012: R+17.7 2008: R+18.4
Not yet ingested
- Civics
- —
Market trends
- HPI YoY
- ▼ -347.85%
- Current HPI
- 274.4679
- Rent YoY
- —
- Metro
- —
- State GDP YoY
- ▲ 2.05%
- F500 in state
- 34
Industry mix (Fortune 500 HQ in NJ)
| Industry | F500 HQs | Revenue |
|---|---|---|
| Consumer Goods | 3 | $31B |
|
||
| Pharmaceuticals | 2 | $153B |
|
||
| Technology | 2 | $21B |
|
||
| Insurance | 2 | $20B |
|
||
| Healthcare | 2 | $19B |
|
||
| Financial Services | 1 | $70B |
|
||
Price history
+0.0% since first listed6 events — show timeline
- 2019-09-13 Pending — BRIGHT MLS
- 2019-09-11 Listing Removed — BRIGHT MLS
- 2019-09-10 Pending — BRIGHT MLS
- 2017-06-12 Pending — BRIGHT MLS
- 2017-05-15 Listed $33,000 BRIGHT MLS
- 2017-05-10 Listed $33,000 BRIGHT MLS
Cash-flow waterfall
monthlySold comps — $/sqft
last 12 mo · ≤1 miLoading sold comps…