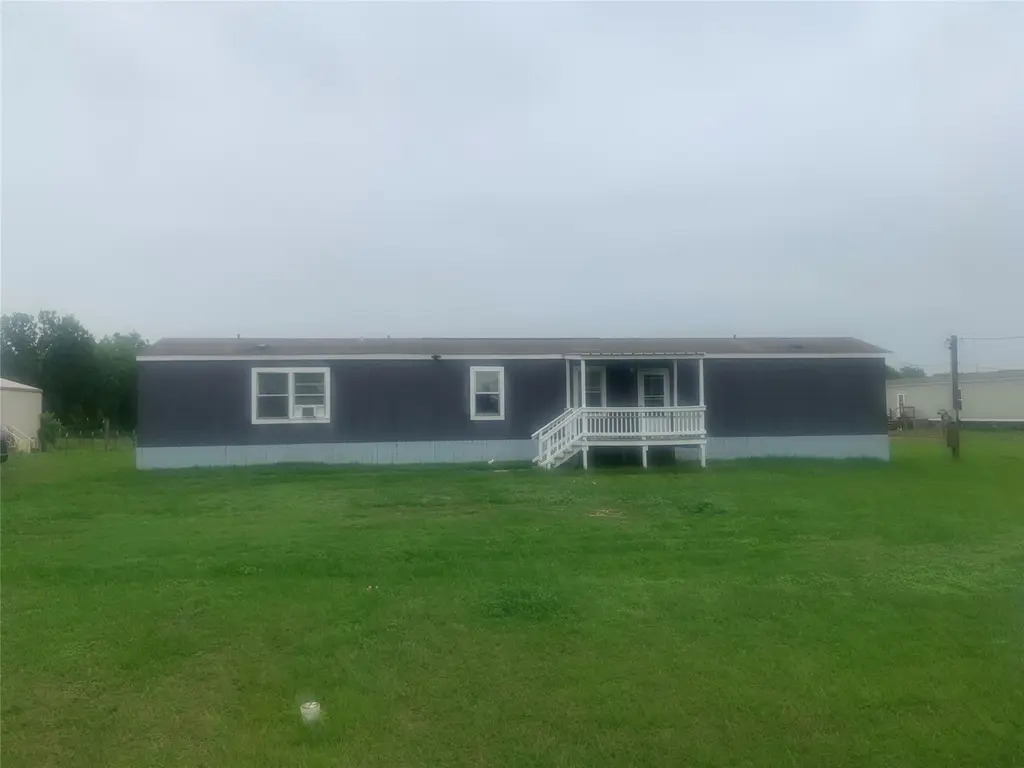
710 Parkmoor Blvd · Edna, TX
Flood risk 3/10 · Minor
- FEMA flood zone
- X (unshaded)
- Chance of flooding over 30 yrs
- 0.2%
- Est. flood insurance / yr
- $507 – $1,088
Fire risk 3/10 · Minor
- Est. fire insurance / yr
- $1,222 – $2,270
Heat risk 9/10 · Severe
- Hot days now (above 110°F)
- 7 days/yr
- Hot days in 30 yrs
- 21 days/yr
Wind risk 9/10 · Severe
- Chance of severe wind over 30 yrs
- 99.0%
Air-quality risk 1/10 · Minimal
- Unhealthy air days now
- 0 days/yr
- Unhealthy air days in 30 yrs
- 0 days/yr
Risk factors via First Street. Map © Google.
Why this score? — see what drove the C- grade
The composite is a weighted blend of 9 inputs, each scored 0–100. Each bar is that input's sub-score; the figure is the points it added to the 100-point composite (weight × sub-score).
- Cash flow +20.3/30.0
- ARV discount +7.5/15.0
- DSCR +6.4/10.0
- 1% rule +4.2/10.0
- Schools +3.6/10.0
- Livability +3.6/5.0
- Rent growth +2.5/5.0
- Condition / age +2.5/5.0
- Appreciation +0.0/10.0
$144,900
🖨 Deal sheet 📄 Offer letter ✓ Due diligence
Listing remarks
710 Parkmoor Blvd in Edna offers a rare mix of peaceful country-style living with the convenience of being just minutes from town amenities. This Manufactured Home property features a 3-bedroom, 2-bath layout on approximately half an acre, giving buyers plenty of outdoor space for entertaining, gardening, pets, or future improvements. Inside, the split floor plan creates privacy between the primary suite and guest rooms, while features like the breakfast bar, indoor laundry area, and garden tub add everyday comfort and functionality. The Manufactured home was built in 2016 and Edna provides a quieter, small-town Texas lifestyle with access to schools, shopping, and major highways connecti
Key facts
- Access to schools
- Indoor laundry area
- Split floor plan
Tags
Property features AI
Exterior
- Utilities: Public water; Public sewer
- Home design: Residential property; Single-story entry (rooms listed on first floor)
- Construction: Built in 2016; Vinyl siding exterior; Composition roof; Pillar/post/pier foundation
- Exterior features: Lot includes 'Other' lot features
Interior
- Bedrooms: Primary bedroom on the first floor; Additional bedrooms on the first floor (two bedrooms listed)
- Bathrooms: Two full bathrooms (including a primary bathroom) on the first floor
- Heating & cooling: Central heating (electric); Central air conditioning (electric)
- Interior features: Five total rooms
Neighborhood map
What this means for you Summary
Snapshot
- This is a 3-bed/2.0-bath manufactured listed at $145k.
Deal economics
- At list price, monthly cash flow is $186 ($2k/yr) — positive.
- The deal already cash-flows at list — no discount required.
- To meet the 1% rule (rent ≥ 1% of price), the offer needs to be $134k (7.6% below list).
- Recommended offer: $134k (7.6% below list) — sets the bar for 1% rule.
- Cap rate 7.8% vs local median 2.8% in Edna — top-decile yield for the area; either an underpriced asset or a hidden risk that comps aren't pricing in. Stress-test before assuming the spread holds.
Location & tenants
- Location reads 72/100 on livability (#254 in TX) — a middle-class / working-renter tenant base. Strengths: cost of living A+, housing A+, health & safety A+; Watch: schools D+, amenities F, commute F.
- Edna ISD (town): math 45% / reading 39% proficiency, ranked #335 of 826 in TX (top 41%) — families likely to look elsewhere, expect single-tenant / working-renter base with shorter leases.
- Market conditions: 73 active listings in the ZIP.
Forward outlook
- Local home prices are declining (-3.0%/yr); year-one equity from $1k of loan paydown is wiped out by about $4k of value loss. Plan a longer hold.
- Jackson County population projected at +28% by 2050 — long-run rental-demand tailwind backs the buy-and-hold thesis.
Negotiation context
- It's been on market 41 days — a 3% lower offer ($141k) is reasonable based on typical stale-listing flexibility.
- 4 sale attempts since 4y ago with the ask held roughly flat each time — persistent listings suggest the price (not the market) is what's stuck; bring a comps-based counter.
Risks & watch-outs
- Climate carrying-cost: severe wind risk, 99% chance of damaging wind over 30y; extreme-heat days projected 7→21/yr by 2055 (HVAC capex compounding) — expect insurance premiums to compound above CPI over the hold.
Questions for the listing agent
- It's been on market 41 days. Have you received any prior offers? Is the seller open to a 8% concession, seller financing, or rate buy-down credit?
- Is there a deadline driving the sale (1031 exchange, divorce, estate, relocation)? That informs how much negotiation room exists.
- Schools are D-rated, which usually means shorter tenancies and higher turnover. Who's the typical renter profile here, and what's been the actual vacancy rate?
- What's the average days-on-market for RENTAL listings here right now (not sales)? A rising rental-DOM trend means longer vacancies and softer asking-rent achievability than the comps imply.
- What's the recent tenant-quality profile in this submarket — average credit score on applications, eviction rate, late-payment / NSF rate, and stable-employment percentage? A property-management company in the area should have these aggregated.
- How much new for-sale + rental construction is in the pipeline within 1–3 miles? Heavy new supply typically softens prices + rents 12–24 months out; constrained supply supports both.
Investment metrics
- 1% rule
- 0.92% ✗
- Cap rate
- 7.83%
- Cash-on-cash
- 5.49%
- DSCR
- 1.24
- GRM
- 9.0
CMA / ARV
No comps found within radius.
Projected returns pro-forma
-3.0% appreciation · 3.0% rent growth · sell at horizon
- IRR
- -7.8%
- Equity multiple
- 0.71×
- Total profit
- $-11,711
- Equity at exit
- $21,605
- IRR
- 1.7%
- Equity multiple
- 1.12×
- Total profit
- $4,793
- Equity at exit
- $12,528
Cash invested: $40,572 (down + closing). Projections, not guarantees.
Landlord ↔ Tenant lean methodology
- Overall (STATE)
- 87 Strongly Landlord-Friendly
- State Texas
- 87 Strongly Landlord-Friendly · R+5
- County
- — inherits STATE
- City
- — inherits STATE
ZIP-level market 77957
- Home prices YoY
- -25.8%
- Active inventory
- 73
- Price-to-rent
- 9.0×
Monthly cashflow live
- Estimated rent
- $1,339 medium interval (Pro) →
- Mortgage (P&I)
- −$760
- Tax from tax record
- −$52 /mo · $621/yr
- Insurance
- −$60
- HOA
- −$0
- Vacancy / Maint / Mgmt
- −$281
- Net cashflow
- $186
Break-even live
UW: 25.0% down · 7.5% · 30yr · 1.5% tax · 5.0% vac · 8.0% maint · 8.0% mgmt
Financing live
Cash to close
- Down payment
- $36,225
- Closing costs
- $4,347
- Reserves months
- —
- Total cash needed
- —
Loan-product check · same deal, 3 products live
Conventional
25% down · 7.5% · 30yr
- Down + closing
- —
- Monthly P&I
- —
- Monthly cashflow
- —
- DSCR
- —
- Eligible?
- —
Personal DTI + credit; lowest rate.
DSCR
20% down · 8.5% · 30yr
- Down + closing
- —
- Monthly P&I
- —
- Monthly cashflow
- —
- DSCR
- —
- Eligible?
- —
No personal income docs; deal must DSCR.
Hard money
10% down · 12.0% · 12mo
- Down + closing
- —
- Monthly P&I
- —
- Monthly cashflow
- —
- DSCR
- —
- Eligible?
- —
Short-term bridge; refi at stabilization.
Listing history 26 events
-
2026-06-18days on market $144,900 Active 41 DOM
-
2026-06-17days on market $144,900 Active 40 DOM
-
2026-06-16days on market $144,900 Active 39 DOM
-
2026-06-15days on market $144,900 Active 38 DOM
-
2026-06-13days on market $144,900 Active 36 DOM
-
2026-06-12days on market $144,900 Active 35 DOM
-
2026-06-09days on market $144,900 Active 32 DOM
-
2026-06-08days on market $144,900 Active 31 DOM
-
2026-06-08days on market $144,900 Active 30 DOM
-
2026-06-07days on market $144,900 Active 29 DOM
-
2026-06-03days on market $144,900 Active 26 DOM
-
2026-06-02days on market $144,900 Active 25 DOM
-
2026-06-01days on market $144,900 Active 24 DOM
-
2026-05-31days on market $144,900 Active 23 DOM
-
2026-05-08$149,900 Active 887-char remark
-
2023-06-14soldstatus
-
2023-05-09status Pending
-
2023-04-28price $129,595
-
2023-03-08$131,595 Active
-
2023-03-07historical
-
2023-02-27price $133,000
-
2023-01-27status Active
-
2023-01-25status Pending
-
2023-01-20price $134,000
-
2023-01-04price $137,000
-
2022-11-21$139,000 Active
ⓘ Source: listings_history table (triggers on properties + properties_extension) + one-shot
backfill from property_details.listing_events for pre-trigger history.
Tax reassessment forecast TX · Resets to sale price
- Current annual tax
- $621 · $52/mo
- Projected year-2 tax
- $2,652 · $221/mo
- Expected delta
- +$2,031/yr (+$169/mo · 327.0%)
ⓘ Screening estimate from a state-policy table — verify with the county assessor before closing.
Climate risk First Street
- Flood 3/10 Moderate FEMA zone X (unshaded) · 20% chance over 30 yrs
- Wildfire 3/10 Moderate
- Heat 9/10 Extreme 7 d/yr ≥110°F today · 21 d/yr by 30 yrs out
- Wind 9/10 Extreme 99% chance of damaging wind over 30 yrs
- Air quality 1/10 Low 0 unhealthy d/yr today · 0 by 30 yrs out
Nearby sold comps map
Loading sold comps map…
Walkable amenities ~0.75 mi
Loading nearby amenities…
Taxation est. · year 1
- Rental income
- $16,067
- − Mortgage interest
- −$8,117
- − Property taxes
- −$621
- − Insurance
- −$724
- − Repairs & maintenance
- −$1,285
- − Management
- −$1,285
- − Depreciation
- −$4,215
- Taxable loss
- −$181
- Est. tax savings @ 24.0%
- +$44
- After-tax cash flow
- $2,272/yr
For passive investors: Depreciation is non-cash, so a rental often shows a tax loss while cash-flowing — sheltering income. Rental losses are passive: they offset passive income freely, and up to $25,000/yr can offset ordinary (W-2) income if you actively participate and your MAGI is under $100k (phasing out to $0 by $150k); unused losses carry forward. On sale, claimed depreciation is recaptured at up to 25%, and gains may owe capital-gains tax (a 1031 exchange can defer both). Figures are a year-1 estimate at your 24.0% rate — not tax advice; consult a CPA.
Schools (NCES district)
- District
- Edna ISD
- NCES district ID
- 4818210
- Math proficiency
- 45% ▲ 3.00%
- Reading proficiency
- 39% ▼ -3.00%
- Median HH income
- $47,887
- Composite
- 35.99/100
- National rank
- #4793
- State rank
- #335 of 826 in TX
Livability — Edna
- Score
- 72/100
- State rank
- #254
- US rank
- #5996
Category grades
Schools grade is shown separately in the Schools card above.
Census & demographics
- Census place
- Edna, TX
- Population (ZIP)
- 8,919
Population outlook (Jackson County) Hauer SSP2
- Today (2025)
- 16,579 people
- By 2030
- 17,480 · +5.4%
- By 2040
- 19,328 · +16.6%
- By 2050
- 21,182 · +27.8%
- By 2075
- 25,781 · +55.5%
- By 2100
- 28,184 · +70.0%
Race, ethnicity, and origin ACS 2023
- Neighborhood character
- Majority White (60%)
- Race & ethnicity
- White 60% Hispanic / Latino 30% Two or more races 10% Black 8%
- Hispanic origin (detail)
- Mexican 26%
- Common ancestry
- Lithuanian 3% Romanian 2% Iranian 1%
- Foreign-born
- 5% · Canada
- Languages at home
- 82% English-only · Spanish 17% Other Indo-European 1%
Political lean MEDSL · Jackson
- 2024 margin
- Solid R (+70.8) · D 14.3% · R 85.1%
- 2008→2024 swing
- -22.9pp toward R · 2008: -47.9pp · 2024: -70.8pp
- All cycles
- 2024: R+70.8 2020: R+66.2 2016: R+63.7 2012: R+56.5 2008: R+47.9
Not yet ingested
- Civics
- —
Market trends
- HPI YoY
- ▼ -58.92%
- Current HPI
- 169.9334
- Rent YoY
- —
- Metro
- —
- State GDP YoY
- ▲ 3.95%
- F500 in state
- 110
Industry mix (Fortune 500 HQ in TX)
| Industry | F500 HQs | Revenue |
|---|---|---|
| Energy | 16 | $1,198B |
|
||
| Technology | 5 | $198B |
|
||
| Engineering / Construction | 4 | $72B |
|
||
| Energy Services | 3 | $60B |
|
||
| Utilities | 3 | $41B |
|
||
| Healthcare | 2 | $330B |
|
||
Price history
+4.2% since first listed13 events — show timeline
- 2026-05-25 Price Changed $144,900 HARMLS
- 2026-05-08 Listed $149,900 HARMLS
- 2023-06-14 Sold (Public Records) — Public Records
- 2023-05-09 Pending — CTXMLS
- 2023-04-28 Price Changed $129,595 CTXMLS
- 2023-03-08 Listed $131,595 CTXMLS
- 2023-03-07 Listing Removed — CTXMLS
- 2023-02-27 Price Changed $133,000 CTXMLS
- 2023-01-27 Relisted — CTXMLS
- 2023-01-25 Pending — CTXMLS
- 2023-01-20 Price Changed $134,000 CTXMLS
- 2023-01-04 Price Changed $137,000 CTXMLS
- 2022-11-21 Listed $139,000 CTXMLS
Property tax history
-5.0%/yrLatest (2025): $621 · -3.6% YoY. Source: county tax records.
Cash-flow waterfall
monthlySold comps — $/sqft
last 12 mo · ≤1 miLoading sold comps…