2763 C R 721 · Moore Haven, FL
Flood risk 1/10 · Minimal
- FEMA flood zone
- X
- Chance of flooding over 30 yrs
- 0.0%
- Est. flood insurance / yr
- $507 – $1,088
Fire risk 4/10 · Minor
- Est. fire insurance / yr
- $947 – $1,759
Heat risk 9/10 · Severe
- Hot days now (above 108°F)
- 7 days/yr
- Hot days in 30 yrs
- 25 days/yr
Wind risk 10/10 · Severe
- Chance of severe wind over 30 yrs
- 99.0%
Air-quality risk 2/10 · Minimal
- Unhealthy air days now
- 1 days/yr
- Unhealthy air days in 30 yrs
- 1 days/yr
Risk factors via First Street. Map © Google.
Why this score? — see what drove the B grade
The composite is a weighted blend of 9 inputs, each scored 0–100. Each bar is that input's sub-score; the figure is the points it added to the 100-point composite (weight × sub-score).
- Cash flow +30.0/30.0
- 1% rule +10.0/10.0
- DSCR +10.0/10.0
- ARV discount +7.5/15.0
- Appreciation +4.7/10.0
- Livability +3.5/5.0
- Schools +3.3/10.0
- Rent growth +2.5/5.0
- Condition / age +2.5/5.0
$60,000
🖨 Deal sheet 📄 Offer letter ✓ Due diligence
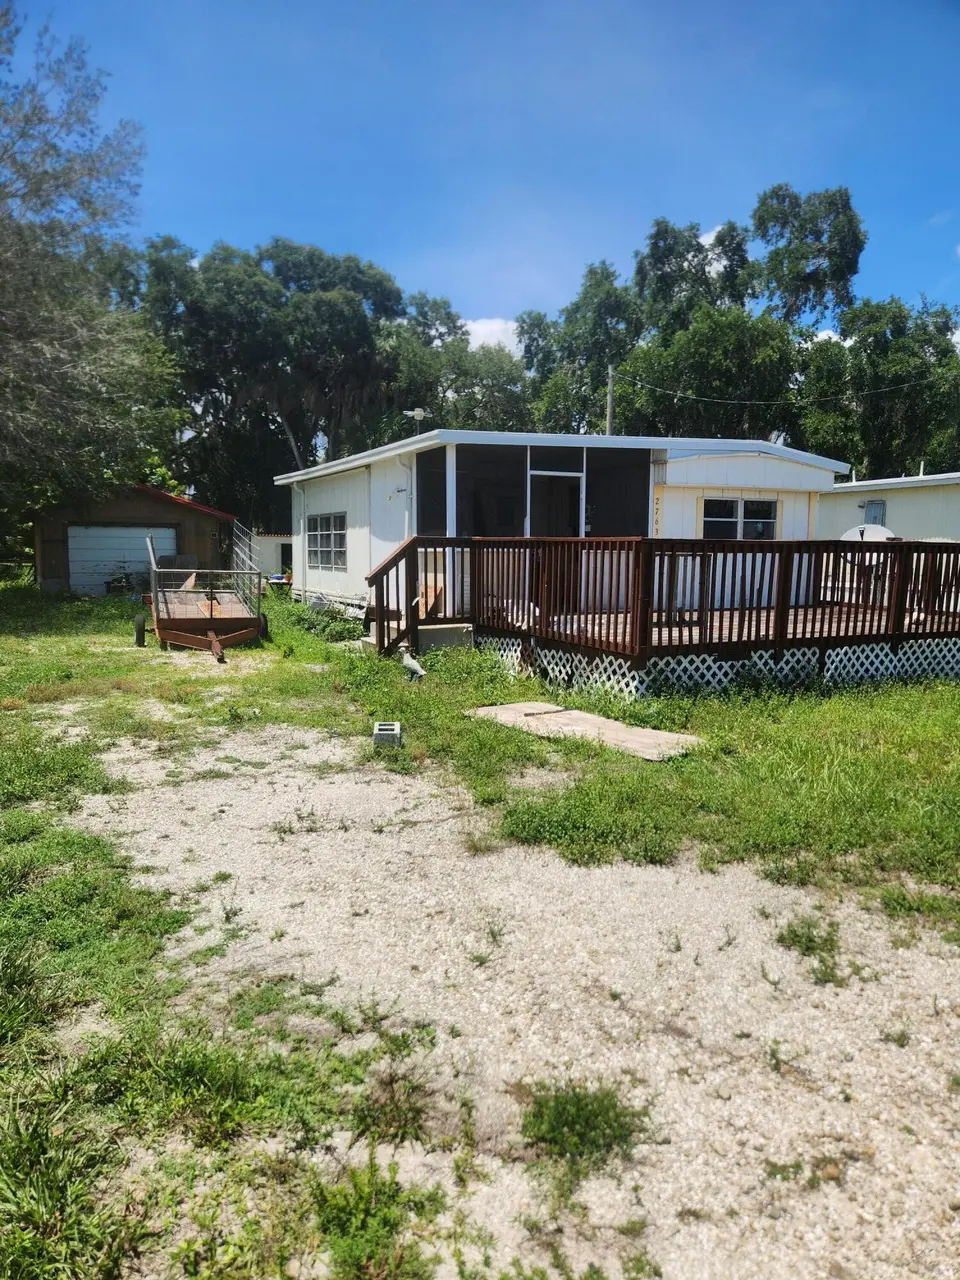
Listing remarks
Welcome to this 2 bed 1.5 bath mobile home in Lakeport with canal view. This is an excellent opportunity for value add with some renovation this will make a great first time home or winter retreat. Plenty of storage with the extra out buildings and detached garage. Owner is motivated and willing to look at reasonable offers with cash or conventional financing.
Key facts
- Canal view
- Extra out buildings
- 0.23 acre lot
Tags
Property features AI
Exterior
- Parking: Total parking for 5 vehicles; Detached 1-car garage; One covered space; Four open parking spaces; Open parking available
- Utilities: Public water; Septic tank; 200+ amp electrical service; Cable available; Electricity available; Water available
- Home design: Single-wide mobile home; One story; Faces east; Resale condition; County road frontage
- Construction: Aluminum siding; Aluminum roof; Other skirting; Mobile home length 72', width 12'
- Exterior features: Deck; Interior lot; No waterfront
Interior
- Kitchen: Electric range; Microwave; Refrigerator
- Bedrooms: One main-level bedroom
- Flooring: Other flooring
- Bathrooms: One full bathroom; One half bathroom
- Heating & cooling: Central heating; Central air conditioning
- Interior features: No notable built-in interior features reported; Unfurnished
- Laundry & utility: Electric water heater
Neighborhood map
What this means for you Summary
Snapshot
- This is a 2-bed/2.0-bath manufactured listed at $60k.
Deal economics
- At list price, monthly cash flow is $404 ($5k/yr) — positive.
- The deal already cash-flows at list — no discount required.
- Meets the 1% rule at list price ($1k rent vs $60k).
- Cap rate 14.4% vs local median 4.8% in Moore Haven — top-decile yield for the area; either an underpriced asset or a hidden risk that comps aren't pricing in. Stress-test before assuming the spread holds.
Location & tenants
- Location reads 70/100 on livability (#427 in FL) — a middle-class / working-renter tenant base. Strengths: crime A+, cost of living A+, housing A+; Watch: amenities F, commute F, employment F.
- Glades (town): math 38% / reading 41% proficiency, ranked #63 of 73 in FL (top 86%) — families likely to look elsewhere, expect single-tenant / working-renter base with shorter leases.
- Market conditions: 99 active listings in the ZIP; 65 units permitted in Glades County in 2024 (0 in 5+ unit buildings).
Forward outlook
- In year one you build about $102 of equity ($415 loan paydown + $-313 appreciation (-0.5% local appreciation)).
- Glades County population projected at +15% by 2050 — long-run rental-demand tailwind backs the buy-and-hold thesis.
- At projected returns (-0.5% appreciation + 3.0% rent growth), your $17k cash investment doubles in ~4 years — after that, you're playing with house money.
Negotiation context
- Only 7 days on market — expect competitive offers; lowballing is unlikely to land.
Risks & watch-outs
- Climate carrying-cost: severe wind risk, 99% chance of damaging wind over 30y; extreme-heat days projected 7→25/yr by 2055 (HVAC capex compounding) — expect insurance premiums to compound above CPI over the hold.
Questions for the listing agent
- Built in 1977 — when were the roof, HVAC, electrical panel, plumbing, and water heater last replaced?
- Is there a deadline driving the sale (1031 exchange, divorce, estate, relocation)? That informs how much negotiation room exists.
- What's the average days-on-market for RENTAL listings here right now (not sales)? A rising rental-DOM trend means longer vacancies and softer asking-rent achievability than the comps imply.
- What's the recent tenant-quality profile in this submarket — average credit score on applications, eviction rate, late-payment / NSF rate, and stable-employment percentage? A property-management company in the area should have these aggregated.
- How much new for-sale + rental construction is in the pipeline within 1–3 miles? Heavy new supply typically softens prices + rents 12–24 months out; constrained supply supports both.
Investment metrics
- 1% rule
- 1.77% ✓
- Cap rate
- 14.38%
- Cash-on-cash
- 28.87%
- DSCR
- 2.28
- GRM
- 4.7
CMA / ARV
No comps found within radius.
Projected returns pro-forma
-0.52% appreciation · 3.0% rent growth · sell at horizon
- IRR
- 28.3%
- Equity multiple
- 2.34×
- Total profit
- $22,561
- Equity at exit
- $15,874
- IRR
- 32.7%
- Equity multiple
- 4.52×
- Total profit
- $59,178
- Equity at exit
- $17,886
Cash invested: $16,800 (down + closing). Projections, not guarantees.
Landlord ↔ Tenant lean methodology
- Overall (STATE)
- 87 Strongly Landlord-Friendly
- State Florida
- 87 Strongly Landlord-Friendly · R+3
- County
- — inherits STATE
- City
- — inherits STATE
ZIP-level market 33471
- Home prices YoY
- -0.1%
- Active inventory
- 99
- Price-to-rent
- 4.7×
Monthly cashflow live
- Estimated rent
- $1,064 medium interval (Pro) →
- Mortgage (P&I)
- −$315
- Tax from tax record
- −$97 /mo · $1,164/yr
- Insurance
- −$25
- HOA
- −$0
- Vacancy / Maint / Mgmt
- −$224
- Net cashflow
- $404
Break-even live
UW: 25.0% down · 7.5% · 30yr · 1.5% tax · 5.0% vac · 8.0% maint · 8.0% mgmt
Financing live
Cash to close
- Down payment
- $15,000
- Closing costs
- $1,800
- Reserves months
- —
- Total cash needed
- —
Loan-product check · same deal, 3 products live
Conventional
25% down · 7.5% · 30yr
- Down + closing
- —
- Monthly P&I
- —
- Monthly cashflow
- —
- DSCR
- —
- Eligible?
- —
Personal DTI + credit; lowest rate.
DSCR
20% down · 8.5% · 30yr
- Down + closing
- —
- Monthly P&I
- —
- Monthly cashflow
- —
- DSCR
- —
- Eligible?
- —
No personal income docs; deal must DSCR.
Hard money
10% down · 12.0% · 12mo
- Down + closing
- —
- Monthly P&I
- —
- Monthly cashflow
- —
- DSCR
- —
- Eligible?
- —
Short-term bridge; refi at stabilization.
Listing history 6 events
-
2026-06-14statusdays on market $60,000 Pending 7 DOM
-
2026-06-12days on market $60,000 Active 6 DOM
-
2026-06-09days on market $60,000 Active 3 DOM
-
2026-06-08days on market $60,000 Active 2 DOM
-
2026-06-07remarks 362-char remark
-
2026-06-07$60,000 Active 1 DOM
ⓘ Source: listings_history table (triggers on properties + properties_extension) + one-shot
backfill from property_details.listing_events for pre-trigger history.
Tax reassessment forecast FL · Resets to sale price
- Current annual tax
- $1,164 · $97/mo
- Projected year-2 tax
- $1,164 · $97/mo
- Expected delta
- $0/yr ($0/mo · 0.0%)
ⓘ Screening estimate from a state-policy table — verify with the county assessor before closing.
Climate risk First Street
- Flood 1/10 Low FEMA zone X · 0% chance over 30 yrs
- Wildfire 4/10 Moderate
- Heat 9/10 Extreme 7 d/yr ≥108°F today · 25 d/yr by 30 yrs out
- Wind 10/10 Extreme 99% chance of damaging wind over 30 yrs
- Air quality 2/10 Low 1 unhealthy d/yr today · 1 by 30 yrs out
Nearby sold comps map
Loading sold comps map…
Walkable amenities ~0.75 mi
Loading nearby amenities…
Taxation est. · year 1
- Rental income
- $12,772
- − Mortgage interest
- −$3,361
- − Property taxes
- −$1,164
- − Insurance
- −$300
- − Repairs & maintenance
- −$1,022
- − Management
- −$1,022
- − Depreciation
- −$1,745
- Taxable income
- $4,158
- Est. tax owed @ 24.0%
- −$998
- After-tax cash flow
- $3,852/yr
For passive investors: Depreciation is non-cash, so a rental often shows a tax loss while cash-flowing — sheltering income. Rental losses are passive: they offset passive income freely, and up to $25,000/yr can offset ordinary (W-2) income if you actively participate and your MAGI is under $100k (phasing out to $0 by $150k); unused losses carry forward. On sale, claimed depreciation is recaptured at up to 25%, and gains may owe capital-gains tax (a 1031 exchange can defer both). Figures are a year-1 estimate at your 24.0% rate — not tax advice; consult a CPA.
Schools (NCES district)
- District
- Glades
- NCES district ID
- 1200660
- Math proficiency
- 38% ▼ -15.00%
- Reading proficiency
- 41% ▼ -5.00%
- Median HH income
- $36,758
- Composite
- 32.81/100
- National rank
- #5622
- State rank
- #63 of 73 in FL
Livability — Moore Haven
- Score
- 70/100
- State rank
- #427
- US rank
- #7288
Category grades
Schools grade is shown separately in the Schools card above.
Census & demographics
- Population (ZIP)
- 6,679
Population outlook (Glades County) Hauer SSP2
- Today (2025)
- 14,901 people
- By 2030
- 15,463 · +3.8%
- By 2040
- 16,341 · +9.7%
- By 2050
- 17,158 · +15.1%
- By 2075
- 18,881 · +26.7%
- By 2100
- 19,164 · +28.6%
Race, ethnicity, and origin ACS 2023
- Neighborhood character
- Diverse neighborhood (Simpson 0.64)
- Race & ethnicity
- White 49% Black 26% Hispanic / Latino 23% Two or more races 11%
- Hispanic origin (detail)
- Mexican 12% Puerto Rican 1% Cuban 5%
- Common ancestry
- Italian 3% Scotch-Irish 2% Lithuanian 2%
- Foreign-born
- 12% · Canada, Jamaica
- Languages at home
- 79% English-only · Spanish 19% German/W. Germanic 1% Other Indo-European 1%
Political lean MEDSL · Glades
- 2024 margin
- Solid R (+53.3) · D 23.1% · R 76.4%
- 2008→2024 swing
- -36.7pp toward R · 2008: -16.6pp · 2024: -53.3pp
- All cycles
- 2024: R+53.3 2020: R+46.2 2016: R+39.6 2012: R+18.6 2008: R+16.6
Not yet ingested
- Civics
- —
Market trends
- HPI YoY
- ▼ -0.52%
- Current HPI
- 374.0849
- Rent YoY
- —
- Metro
- —
- State GDP YoY
- ▲ 3.28%
- F500 in state
- 36
Industry mix (Fortune 500 HQ in FL)
| Industry | F500 HQs | Revenue |
|---|---|---|
| Industrial Technology | 2 | $29B |
|
||
| Insurance | 2 | $17B |
|
||
| Retail | 1 | $60B |
|
||
| Technology Distribution | 1 | $58B |
|
||
| Homebuilding | 1 | $35B |
|
||
| Technology Manufacturing | 1 | $35B |
|
||
Price history
1 event — show timeline
- 2026-06-06 Listed $60,000 Beaches MLS
Property tax history
+9.3%/yrLatest (2025): $1,164 · -21.4% YoY. Source: county tax records.
Cash-flow waterfall
monthlySold comps — $/sqft
last 12 mo · ≤1 miLoading sold comps…