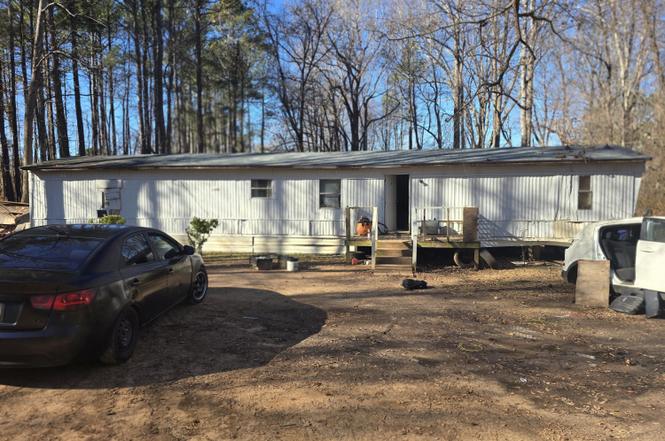
6782 Pinecrest Rd · Middlesex, NC
Flood risk 1/10 · Minimal
- FEMA flood zone
- X (unshaded)
- Chance of flooding over 30 yrs
- 0.0%
- Est. flood insurance / yr
- $507 – $1,088
Fire risk 4/10 · Minor
- Est. fire insurance / yr
- $906 – $1,684
Heat risk 6/10 · Moderate
- Hot days now (above 107°F)
- 7 days/yr
- Hot days in 30 yrs
- 16 days/yr
Wind risk 6/10 · Moderate
- Chance of severe wind over 30 yrs
- 64.0%
Air-quality risk 2/10 · Minimal
- Unhealthy air days now
- 2 days/yr
- Unhealthy air days in 30 yrs
- 2 days/yr
Risk factors via First Street. Map © Google.
Why this score? — see what drove the B- grade
The composite is a weighted blend of 9 inputs, each scored 0–100. Each bar is that input's sub-score; the figure is the points it added to the 100-point composite (weight × sub-score).
- Cash flow +30.0/30.0
- 1% rule +10.0/10.0
- DSCR +10.0/10.0
- ARV discount +7.5/15.0
- Livability +3.0/5.0
- Rent growth +2.9/5.0
- Condition / age +2.5/5.0
- Schools +2.2/10.0
- Appreciation +0.0/10.0
$99,000
🖨 Deal sheet 📄 Offer letter ✓ Due diligence
Listing remarks
3‑bed, 2‑bath mobile home on ±0.88‑acre unrestricted lot. Private well and septic, peaceful rural setting, no HOA, and convenient access to US‑64, Wendell, and Raleigh. Ideal for an affordable country living with space to expand. The unrestricted parcel includes private well and septic, plenty of space for outdoor enjoyment, and flexibility to add a mobile home or secondary dwelling (subject to local permitting) for guests, rental income, or supplemental living space. Perfect for buyers seeking privacy, space, and potential versatility in a peaceful setting. No HOA.
Key facts
- Private well
- Convenient access
- Septic area
Tags
Property features AI
Finance
- Other: Lot approximately 0.88 acres
- Financial info: Property tax annual amount available
- HOA & community: No association; Not a senior community
Exterior
- Parking: Assigned parking
- Utilities: Private water; Other sewer
- Home design: House; One story; No shared/common walls
- Construction: Other construction materials; Other foundation; Other roof
- Exterior features: Private water source; Other sewer; Public maintained road access
Interior
- Kitchen: Refrigerator
- Bedrooms: 3 bedrooms
- Flooring: Other flooring
- Bathrooms: 2 full bathrooms
- Heating & cooling: Heating present (type: other); Window unit(s) for cooling
- Interior features: Refrigerator included; Other interior features
Neighborhood map
What this means for you Summary
Snapshot
- This is a 3-bed/2.0-bath other listed at $99k.
Deal economics
- At list price, monthly cash flow is $730 ($9k/yr) — positive.
- The deal already cash-flows at list — no discount required.
- Meets the 1% rule at list price ($2k rent vs $99k).
- Recommended offer: $87k (12.0% below list) — sets the bar for market timing.
- Cap rate 15.1% vs local median 2.9% in Middlesex — top-decile yield for the area; either an underpriced asset or a hidden risk that comps aren't pricing in. Stress-test before assuming the spread holds.
Location & tenants
- Location reads 59/100 on livability (#551 in NC) — a working-class tenant base; expect higher turnover. Strengths: crime A+, cost of living A+, housing A; Watch: schools F, amenities F, commute F.
- Nash-Rocky Mount Schools (rural): math 20% / reading 32% proficiency, ranked #155 of 178 in NC (top 87%) — low school quality limits family demand, transient renter base, plan for 1-2y turnover.
- Market conditions: Rents rising (+1.5%/yr); 657 active listings in the ZIP; solid renter incomes; 500 units permitted in Nash County in 2024 (0 in 5+ unit buildings).
Forward outlook
- Local home prices are declining (-3.0%/yr); year-one equity from $684 of loan paydown is wiped out by about $3k of value loss. Plan a longer hold.
- Nash County population projected at -12% by 2050 — secular population decline; favor cash flow + early exit over multi-decade hold.
- At projected returns (-3.0% appreciation + 1.5% rent growth), your $28k cash investment doubles in ~4 years — after that, you're playing with house money.
Negotiation context
- It's been on market 162 days — a 12% lower offer ($87k) is reasonable based on typical stale-listing flexibility.
- Current owner paid $50k; list at $99k implies a 98% gain — meaningful room to come down on a strong offer.
Risks & watch-outs
- Climate carrying-cost: major wind risk, 64% chance of damaging wind over 30y; extreme-heat days projected 7→16/yr by 2055 (HVAC capex compounding) — expect insurance premiums to compound above CPI over the hold.
Questions for the listing agent
- It's been on market 162 days. Have you received any prior offers? Is the seller open to a 12% concession, seller financing, or rate buy-down credit?
- Why hasn't it sold? Are there any deal-killer items the seller is aware of (foundation, flood, title, zoning, code violations)?
- Is there a deadline driving the sale (1031 exchange, divorce, estate, relocation)? That informs how much negotiation room exists.
- Schools are F-rated, which usually means shorter tenancies and higher turnover. Who's the typical renter profile here, and what's been the actual vacancy rate?
- What's the average days-on-market for RENTAL listings here right now (not sales)? A rising rental-DOM trend means longer vacancies and softer asking-rent achievability than the comps imply.
- What's the recent tenant-quality profile in this submarket — average credit score on applications, eviction rate, late-payment / NSF rate, and stable-employment percentage? A property-management company in the area should have these aggregated.
- How much new for-sale + rental construction is in the pipeline within 1–3 miles? Heavy new supply typically softens prices + rents 12–24 months out; constrained supply supports both.
Investment metrics
- 1% rule
- 1.81% ✓
- Cap rate
- 15.14%
- Cash-on-cash
- 31.59%
- DSCR
- 2.41
- GRM
- 4.6
CMA / ARV
No comps found within radius.
Projected returns pro-forma
-3.0% appreciation · 1.54% rent growth · sell at horizon
- IRR
- 24.8%
- Equity multiple
- 2.01×
- Total profit
- $27,867
- Equity at exit
- $14,761
- IRR
- 31.7%
- Equity multiple
- 3.67×
- Total profit
- $73,892
- Equity at exit
- $8,560
Cash invested: $27,720 (down + closing). Projections, not guarantees.
Landlord ↔ Tenant lean methodology
- Overall (STATE)
- 85 Strongly Landlord-Friendly
- State North Carolina
- 85 Strongly Landlord-Friendly · R+3
- County
- — inherits STATE
- City
- — inherits STATE
ZIP-level market 27597
- Home prices YoY
- -30.1%
- Rents YoY
- 1.5%
- Active inventory
- 657
- Price-to-rent
- 4.6×
Monthly cashflow live
- Estimated rent
- $1,790 medium interval (Pro) →
- Mortgage (P&I)
- −$519
- Tax est. 1.5%
- −$124 /mo · $1,485/yr
- Insurance
- −$41
- HOA
- −$0
- Vacancy / Maint / Mgmt
- −$376
- Net cashflow
- $730
Break-even live
UW: 25.0% down · 7.5% · 30yr · 1.5% tax · 5.0% vac · 8.0% maint · 8.0% mgmt
Financing live
Cash to close
- Down payment
- $24,750
- Closing costs
- $2,970
- Reserves months
- —
- Total cash needed
- —
Loan-product check · same deal, 3 products live
Conventional
25% down · 7.5% · 30yr
- Down + closing
- —
- Monthly P&I
- —
- Monthly cashflow
- —
- DSCR
- —
- Eligible?
- —
Personal DTI + credit; lowest rate.
DSCR
20% down · 8.5% · 30yr
- Down + closing
- —
- Monthly P&I
- —
- Monthly cashflow
- —
- DSCR
- —
- Eligible?
- —
No personal income docs; deal must DSCR.
Hard money
10% down · 12.0% · 12mo
- Down + closing
- —
- Monthly P&I
- —
- Monthly cashflow
- —
- DSCR
- —
- Eligible?
- —
Short-term bridge; refi at stabilization.
Listing history 22 events
-
2026-06-19days on market $99,000 Active 162 DOM
-
2026-06-18days on market $99,000 Active 161 DOM
-
2026-06-17days on market $99,000 Active 160 DOM
-
2026-06-16days on market $99,000 Active 159 DOM
-
2026-06-15days on market $99,000 Active 158 DOM
-
2026-06-14days on market $99,000 Active 156 DOM
-
2026-06-13days on market $99,000 Active 155 DOM
-
2026-06-10days on market $99,000 Active 153 DOM
-
2026-06-09days on market $99,000 Active 152 DOM
-
2026-06-08days on market $99,000 Active 151 DOM
-
2026-06-07days on market $99,000 Active 150 DOM
-
2026-06-03days on market $99,000 Active 146 DOM
-
2026-06-02days on market $99,000 Active 145 DOM
-
2026-06-01days on market $99,000 Active 144 DOM
-
2026-05-31days on market $99,000 Active 143 DOM
-
2026-05-30days on market $99,000 Active 142 DOM
-
2026-02-05soldstatus $50,000
-
2026-01-21price $99,000
-
2026-01-19price $119,900
-
2026-01-14price $154,900
-
2026-01-08$159,900 Active
-
2000-03-29soldstatus $17,000
ⓘ Source: listings_history table (triggers on properties + properties_extension) + one-shot
backfill from property_details.listing_events for pre-trigger history.
Climate risk First Street
- Flood 1/10 Low FEMA zone X (unshaded) · 0% chance over 30 yrs
- Wildfire 4/10 Moderate
- Heat 6/10 Major 7 d/yr ≥107°F today · 16 d/yr by 30 yrs out
- Wind 6/10 Major 64% chance of damaging wind over 30 yrs
- Air quality 2/10 Low 2 unhealthy d/yr today · 2 by 30 yrs out
Nearby sold comps map
Loading sold comps map…
Walkable amenities ~0.75 mi
Loading nearby amenities…
Taxation est. · year 1
- Rental income
- $21,476
- − Mortgage interest
- −$5,546
- − Property taxes
- −$1,485
- − Insurance
- −$495
- − Repairs & maintenance
- −$1,718
- − Management
- −$1,718
- − Depreciation
- −$2,880
- Taxable income
- $7,634
- Est. tax owed @ 24.0%
- −$1,832
- After-tax cash flow
- $6,924/yr
For passive investors: Depreciation is non-cash, so a rental often shows a tax loss while cash-flowing — sheltering income. Rental losses are passive: they offset passive income freely, and up to $25,000/yr can offset ordinary (W-2) income if you actively participate and your MAGI is under $100k (phasing out to $0 by $150k); unused losses carry forward. On sale, claimed depreciation is recaptured at up to 25%, and gains may owe capital-gains tax (a 1031 exchange can defer both). Figures are a year-1 estimate at your 24.0% rate — not tax advice; consult a CPA.
Schools (NCES district)
- District
- Nash-Rocky Mount Schools
- NCES district ID
- 3703270
- Math proficiency
- 20% ▼ -3.00%
- Reading proficiency
- 32% ▲ 1.00%
- Median HH income
- $41,553
- Composite
- 22.04/100
- National rank
- #8198
- State rank
- #155 of 178 in NC
Livability — Middlesex
- Score
- 59/100
- State rank
- #551
- US rank
- #20308
Category grades
Schools grade is shown separately in the Schools card above.
Census & demographics
- County
- Wake County · 1,216,256 people
- Metro
- Raleigh-Cary, NC
- Population (ZIP)
- 30,184
- Household income
- $84,625
- Rent vs Own
- Severe rent burden
- 592.0
Population outlook (Nash County) Hauer SSP2
- Today (2025)
- 91,107 people
- By 2030
- 89,193 · -2.1%
- By 2040
- 84,959 · -6.7%
- By 2050
- 80,517 · -11.6%
- By 2075
- 72,941 · -19.9%
- By 2100
- 63,602 · -30.2%
Race, ethnicity, and origin ACS 2023
- Neighborhood character
- Diverse neighborhood (Simpson 0.61)
- Race & ethnicity
- White 55% Black 24% Hispanic / Latino 15% Two or more races 10%
- Hispanic origin (detail)
- Mexican 9% Puerto Rican 1%
- Common ancestry
- Romanian 4% Slovak 3% Italian 1%
- Foreign-born
- 9% · Canada
- Languages at home
- 87% English-only · Spanish 12%
Political lean MEDSL · Nash
- 2024 margin
- Toss-up / Even · D 48.7% · R 50.5%
- 2008→2024 swing
- -0.4pp no change · 2008: -1.3pp · 2024: -1.8pp
- All cycles
- 2024: R+1.8 2020: D+0.2 2016: R+0.2 2012: D+0.9 2008: R+1.3
Not yet ingested
- Civics
- —
Market trends
- HPI YoY
- ▼ -94.86%
- Current HPI
- 220.7242
- Rent YoY
- ▲ 1.54%
- Metro
- Raleigh-Cary, NC
- State GDP YoY
- ▲ 3.28%
- F500 in state
- 26
Industry mix (Fortune 500 HQ in NC)
| Industry | F500 HQs | Revenue |
|---|---|---|
| Financial Services | 2 | $213B |
|
||
| Retail | 2 | $95B |
|
||
| Industrial Conglomerate | 1 | $38B |
|
||
| Metals / Steel | 1 | $35B |
|
||
| Utilities | 1 | $30B |
|
||
| Industrial Machinery | 1 | $19B |
|
||
Price history
+194.1% since first listed6 events — show timeline
- 2026-02-05 Sold (Public Records) $50,000 Public Records
- 2026-01-21 Price Changed $99,000 TMLS
- 2026-01-19 Price Changed $119,900 TMLS
- 2026-01-14 Price Changed $154,900 TMLS
- 2026-01-08 Listed $159,900 TMLS
- 2000-03-29 Sold (Public Records) $17,000 Public Records
Property tax history
-5.9%/yrLatest (2025): $130 · -54.3% YoY. Source: county tax records.
Cash-flow waterfall
monthlySold comps — $/sqft
last 12 mo · ≤1 miLoading sold comps…