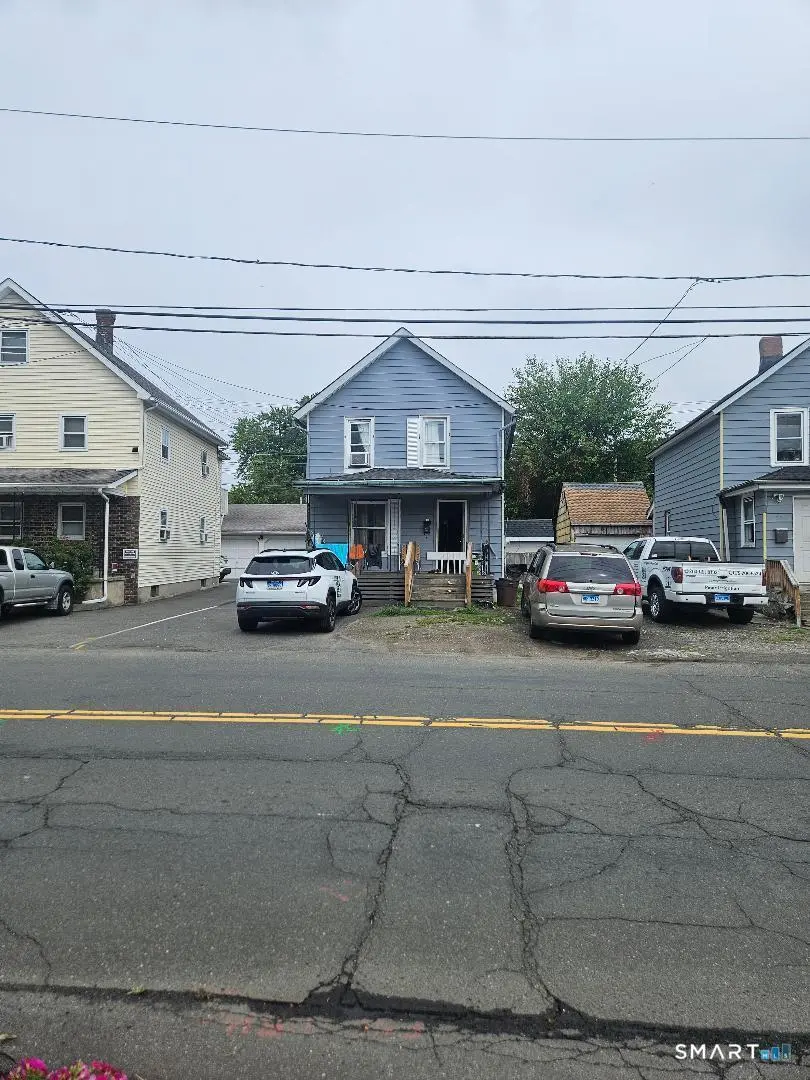
37 Taylor St · Danbury, CT
Flood risk 1/10 · Minimal
- FEMA flood zone
- X (unshaded)
- Chance of flooding over 30 yrs
- 0.0%
- Est. flood insurance / yr
- $473 – $860
Fire risk 1/10 · Minimal
- Est. fire insurance / yr
- $829 – $1,539
Heat risk 5/10 · Moderate
- Hot days now (above 99°F)
- 7 days/yr
- Hot days in 30 yrs
- 16 days/yr
Wind risk 5/10 · Moderate
- Chance of severe wind over 30 yrs
- 26.0%
Air-quality risk 4/10 · Minor
- Unhealthy air days now
- 3 days/yr
- Unhealthy air days in 30 yrs
- 5 days/yr
Risk factors via First Street. Map © Google.
Why this score? — see what drove the C- grade
The composite is a weighted blend of 9 inputs, each scored 0–100. Each bar is that input's sub-score; the figure is the points it added to the 100-point composite (weight × sub-score).
- Cash flow +17.4/30.0
- ARV discount +15.0/15.0
- DSCR +5.4/10.0
- 1% rule +4.2/10.0
- Livability +3.8/5.0
- Rent growth +3.3/5.0
- Condition / age +2.5/5.0
- Schools +2.4/10.0
- Appreciation +0.0/10.0
$279,900
🖨 Deal sheet 📄 Offer letter ✓ Due diligence
Listing remarks MLS
Property being sold " as is where is " this is part of an estate and subject to probate approval. Property has a roof that is less than 5 years old but is in needm of renovation
Key facts
- 3,484 sq ft lot
- 2 parking spots
- Built 1895
Neighborhood map
What this means for you Summary
Snapshot
- This is a 3-bed/1.0-bath single-family listed at $280k.
Deal economics
- At list price, monthly cash flow is $213 ($3k/yr) — positive.
- The deal already cash-flows at list — no discount required.
- To meet the 1% rule (rent ≥ 1% of price), the offer needs to be $258k (7.7% below list).
- Recommended offer: $246k (12.0% below list) — sets the bar for market timing.
- Cap rate 7.2% vs local median 3.6% in Danbury — top-decile yield for the area; either an underpriced asset or a hidden risk that comps aren't pricing in. Stress-test before assuming the spread holds.
Location & tenants
- Location reads 76/100 on livability (#51 in CT, #3,379 nationally) — a middle-class / working-renter tenant base. Strengths: commute A+, housing A+, health & safety A+; Watch: schools D+, amenities F, cost of living F.
- Danbury School District (urban): math 19% / reading 32% proficiency, ranked #131 of 153 in CT (top 86%) — low school quality limits family demand, transient renter base, plan for 1-2y turnover.
- Market conditions: Rents rising (+3.1%/yr); 197 active listings in the ZIP; 30 comparable units currently listed for rent nearby; rentals at typical pace (median 19d on market — plan ~3-4 weeks tenant-placement turnaround); solid renter incomes; 1,151 units permitted in Western Connecticut Planning Region in 2024 (714 in 5+ unit buildings).
- This rent runs 40% of the median local income ($77k/yr) — at the standard rent-burdened threshold; future hikes will face affordability resistance.
Forward outlook
- Local home prices are declining (-3.0%/yr); year-one equity from $2k of loan paydown is wiped out by about $8k of value loss. Plan a longer hold.
Negotiation context
- It's been on market 135 days — a 12% lower offer ($246k) is reasonable based on typical stale-listing flexibility.
- 2 sale attempts since 32y ago with the ask held roughly flat each time — persistent listings suggest the price (not the market) is what's stuck; bring a comps-based counter.
- Current owner paid $50k; list at $280k implies a 460% gain — meaningful room to come down on a strong offer.
Risks & watch-outs
- Watch-outs: built in 1895 — expect roof / HVAC / electrical / plumbing capex.
- Climate carrying-cost: moderate wind risk, 26% chance of damaging wind over 30y; extreme-heat days projected 7→16/yr by 2055 (HVAC capex compounding) — expect insurance premiums to compound above CPI over the hold.
Questions for the listing agent
- It's been on market 135 days. Have you received any prior offers? Is the seller open to a 12% concession, seller financing, or rate buy-down credit?
- Built in 1895 — when were the roof, HVAC, electrical panel, plumbing, and water heater last replaced?
- Why hasn't it sold? Are there any deal-killer items the seller is aware of (foundation, flood, title, zoning, code violations)?
- Is there a deadline driving the sale (1031 exchange, divorce, estate, relocation)? That informs how much negotiation room exists.
- Schools are D-rated, which usually means shorter tenancies and higher turnover. Who's the typical renter profile here, and what's been the actual vacancy rate?
- What's the average days-on-market for RENTAL listings here right now (not sales)? A rising rental-DOM trend means longer vacancies and softer asking-rent achievability than the comps imply.
- What's the recent tenant-quality profile in this submarket — average credit score on applications, eviction rate, late-payment / NSF rate, and stable-employment percentage? A property-management company in the area should have these aggregated.
- How much new for-sale + rental construction is in the pipeline within 1–3 miles? Heavy new supply typically softens prices + rents 12–24 months out; constrained supply supports both.
Investment metrics
- 1% rule
- 0.92% ✗
- Cap rate
- 7.20%
- Cash-on-cash
- 3.25%
- DSCR
- 1.14
- GRM
- 9.0
CMA / ARV
- ARV (median comp)
- $429,378
- List price
- $279,900
- Delta
- -34.81%
- Verdict
- UNDERPRICED
- Comps
- 20 within 1.0 mi
Show comp detail 7 sales within ~0.75 mi
| Address | Dist | Beds/Ba | Sqft | Sold | Price | $/sf | Match |
|---|---|---|---|---|---|---|---|
| 17 Casper St | 0.19mi | 3/1.0 | 918 (-9%) | 8mo | $415,000 | $452 | 70 |
| 8 Briarwood Dr | 0.42mi | 3/1.0 | 956 (-5%) | 6mo | $425,000 | $445 | 67 |
| 1 Triangle Ter | 0.22mi | 3/1.0 | 1,140 (+13%) | 11mo | $405,000 | $355 | 58 |
| 25 Old Shelter Rock Rd | 0.55mi | 3/1.0 | 1,008 (0%) | 21mo | $420,000 | $417 | 57 |
| 82A Purcell Dr | 0.47mi | 4/2.0 (+1) | 1,082 (+7%) | 9mo | $510,000 | $471 | 50 |
| 1 Circle Ter | 0.55mi | 3/1.0 | 960 (-5%) | 20mo | $375,000 | $391 | 49 |
| 25 Topstone Dr | 0.66mi | 2/1.0 (-1) | 936 (-7%) | 4mo | $400,000 | $427 | 49 |
Match score weights: distance 35% · size 25% · config 20% · recency 20%. Top-matched comps best support the ARV.
Projected returns pro-forma
-3.0% appreciation · 3.08% rent growth · sell at horizon
- IRR
- -11.1%
- Equity multiple
- 0.60×
- Total profit
- $-31,636
- Equity at exit
- $41,734
- IRR
- -1.7%
- Equity multiple
- 0.88×
- Total profit
- $-9,370
- Equity at exit
- $24,201
Cash invested: $78,372 (down + closing). Projections, not guarantees.
Landlord ↔ Tenant lean methodology
- Overall (STATE)
- 27 Tenant-Leaning
- State Connecticut
- 27 Tenant-Leaning · D+7
- County
- — inherits STATE
- City
- — inherits STATE
ZIP-level market 06810
- Rents YoY
- 3.1%
- Active inventory
- 197
- Price-to-rent
- 9.0×
Monthly cashflow live
- Estimated rent
- $2,582 high interval (Pro) →
- Mortgage (P&I)
- −$1,468
- Tax from tax record
- −$243 /mo · $2,915/yr
- Insurance
- −$117
- HOA
- −$0
- Vacancy / Maint / Mgmt
- −$542
- Net cashflow
- $213
Break-even live
UW: 25.0% down · 7.5% · 30yr · 1.5% tax · 5.0% vac · 8.0% maint · 8.0% mgmt
Financing live
Cash to close
- Down payment
- $69,975
- Closing costs
- $8,397
- Reserves months
- —
- Total cash needed
- —
Loan-product check · same deal, 3 products live
Conventional
25% down · 7.5% · 30yr
- Down + closing
- —
- Monthly P&I
- —
- Monthly cashflow
- —
- DSCR
- —
- Eligible?
- —
Personal DTI + credit; lowest rate.
DSCR
20% down · 8.5% · 30yr
- Down + closing
- —
- Monthly P&I
- —
- Monthly cashflow
- —
- DSCR
- —
- Eligible?
- —
No personal income docs; deal must DSCR.
Hard money
10% down · 12.0% · 12mo
- Down + closing
- —
- Monthly P&I
- —
- Monthly cashflow
- —
- DSCR
- —
- Eligible?
- —
Short-term bridge; refi at stabilization.
Rent comps 30 comps
| Address | Beds | Baths | Sqft | Rent | $/sqft | DOM | Units | Dist |
|---|---|---|---|---|---|---|---|---|
| 126 Triangle St Danbury, CT | 1.0–2.0 | 1.0–2.0 | 827 | $2,100 | $2.54 | 19d | 2 | 0.16mi |
| 126 Triangle St Unit A5 Danbury, CT | 2.0 | 2.0 | 1018 | $2,100 | $2.06 | 14d | 1 | 0.16mi |
| 62 Chestnut Street Ext Danbury, CT | 2.0 | 1.5 | 1200 | $2,820 | $2.35 | 2d | 3 | 0.17mi |
| 5 8th Ave Danbury, CT | 2.0 | 1.0 | 1200 | $2,300 | $1.92 | 43d | 1 | 0.36mi |
| 38 Homestead Ave Unit 2 Danbury, CT | 2.0 | 1.0 | 1000 | $2,200 | $2.20 | 21d | 1 | 0.42mi |
| 34 James St Unit A Danbury, CT | 2.0 | 1.5 | 900 | $2,300 | $2.56 | 43d | 1 | 0.45mi |
| 34 James St Unit A Danbury, CT | 2.0 | 1.5 | 900 | $2,300 | $2.56 | 10d | 1 | 0.45mi |
| 76 Town Hill Ave Unit D Danbury, CT | 2.0 | 1.0 | 870 | $2,450 | $2.82 | 43d | 1 | 0.45mi |
| 10 Balmforth Ave Unit 11 Danbury, CT | 3.0 | 2.0 | 980 | $2,700 | $2.76 | 43d | 1 | 0.76mi |
| 68 Grand St Danbury, CT | 3.0 | 1.0 | 1480 | $1,900 | $1.28 | 3d | 1 | 0.80mi |
| 8 Wixted Ave Danbury, CT | 3.0 | 2.0 | 1207 | $3,300 | $2.73 | 43d | 1 | 0.80mi |
| 5 Woodside Ave Unit E52 Danbury, CT | 2.0 | 1.0 | 888 | $2,450 | $2.76 | 11d | 1 | 0.85mi |
| 9 E Broad St #1 Danbury, CT | 3.0 | 2.0 | 1280 | $2,750 | $2.15 | 11d | 1 | 0.88mi |
| 7 New St Unit 202 Danbury, CT | 2.0 | 1.0 | 750 | $2,300 | $3.07 | 43d | 1 | 0.90mi |
| 333 Main St Danbury, CT | 1.0–2.0 | 1.0–2.0 | 869 | $2,650 | $3.05 | 3d | 2 | 0.90mi |
| 15 Gallagher Ln Danbury, CT | 3.0 | 2.0 | 1280 | $2,745 | $2.14 | 2d | 1 | 0.91mi |
| 157 Shelter Rock Rd #39 Danbury, CT | 2.0 | 1.5 | 1142 | $2,500 | $2.19 | 11d | 1 | 1.05mi |
| 8 Rose St Unit 26-14 Danbury, CT | 3.0 | 1.5 | 1370 | $3,000 | $2.19 | 3d | 1 | 1.05mi |
| 8 Rose St Unit 24-6 Danbury, CT | 2.0 | 1.5 | 1285 | $2,300 | $1.79 | 19d | 1 | 1.05mi |
| 53 Sand Pit Rd Danbury, CT | 1.0–3.0 | 1.0–2.0 | 1131 | $3,050 | $2.70 | 3d | 1 | 1.08mi |
| 14 South St #12 Danbury, CT | 2.0 | 1.5 | 1410 | $2,850 | $2.02 | 11d | 1 | 1.08mi |
| 1305 Sienna Dr #1305 Danbury, CT | 2.0 | 2.5 | 1350 | $3,250 | $2.41 | 2d | 1 | 1.09mi |
| 1 Kennedy Ave Danbury, CT | 2.0 | 1.0–2.0 | 874 | $2,720 | $3.11 | 2d | 31 | 1.12mi |
| 50 Lincoln Ave Unit 1 R Danbury, CT | 2.0 | 1.0 | 825 | $2,300 | $2.79 | 3d | 1 | 1.16mi |
| 4 Division St Apt 4 Danbury, CT | 2.0 | 1.0 | 850 | $2,500 | $2.94 | 43d | 1 | 1.21mi |
| 4 Division St Danbury, CT | 2.0 | 1.0 | 1000 | $2,500 | $2.50 | 23d | 1 | 1.21mi |
| 13 Morris St Unit B Danbury, CT | 2.0 | 1.5 | 1132 | $2,250 | $1.99 | 43d | 1 | 1.38mi |
| 1 Fairview Dr #4 Danbury, CT | 2.0 | 1.0 | 910 | $2,050 | $2.25 | 19d | 1 | 1.43mi |
| 6 Westville Ave Unit 6A Danbury, CT | 2.0 | 1.0 | 1000 | $1,900 | $1.90 | 43d | 1 | 1.47mi |
| 17 Lake Ave #2 Danbury, CT | 2.0 | 1.0 | 1000 | $1,995 | $2.00 | 43d | 1 | 1.49mi |
Listing history 18 events
-
2026-06-18days on market $279,900 Active 135 DOM
-
2026-06-17days on market $279,900 Active 134 DOM
-
2026-06-16days on market $279,900 Active 133 DOM
-
2026-06-15days on market $279,900 Active 132 DOM
-
2026-06-13days on market $279,900 Active 130 DOM
-
2026-06-10days on market $279,900 Active 127 DOM
-
2026-06-09days on market $279,900 Active 126 DOM
-
2026-06-08days on market $279,900 Active 125 DOM
-
2026-06-07days on market $279,900 Active 124 DOM
-
2026-06-05days on market $279,900 Active 121 DOM
-
2026-06-03days on market $279,900 Active 120 DOM
-
2026-06-03days on market $279,900 Active 119 DOM
-
2026-06-01days on market $279,900 Active 118 DOM
-
2026-05-31days on market $279,900 Active 117 DOM
-
2026-02-03$279,900 Active 187-char remark
Show marketing remark (187 chars)
Property being sold " as is where is " this is part of an estate and subject to probate approval. Property has a roof that is less than 5 years old but is in needm of renovation
-
1995-05-03soldstatus $50,000
-
1995-05-03soldstatus $50,000
-
1994-11-08$69,500
ⓘ Source: listings_history table (triggers on properties + properties_extension) + one-shot
backfill from property_details.listing_events for pre-trigger history.
Tax reassessment forecast CT · Partial reset (capped growth)
- Current annual tax
- $2,915 · $243/mo
- Projected year-2 tax
- $4,452 · $371/mo
- Expected delta
- +$1,537/yr (+$128/mo · 52.7%)
ⓘ Screening estimate from a state-policy table — verify with the county assessor before closing.
Climate risk First Street
- Flood 1/10 Low FEMA zone X (unshaded) · 0% chance over 30 yrs
- Wildfire 1/10 Low
- Heat 5/10 Major 7 d/yr ≥99°F today · 16 d/yr by 30 yrs out
- Wind 5/10 Major 26% chance of damaging wind over 30 yrs
- Air quality 4/10 Moderate 3 unhealthy d/yr today · 5 by 30 yrs out
Nearby sold comps map
Loading sold comps map…
Walkable amenities ~0.75 mi
Loading nearby amenities…
Taxation est. · year 1
- Rental income
- $30,986
- − Mortgage interest
- −$15,679
- − Property taxes
- −$2,915
- − Insurance
- −$1,400
- − Repairs & maintenance
- −$2,479
- − Management
- −$2,479
- − Depreciation
- −$8,143
- Taxable loss
- −$2,107
- Est. tax savings @ 24.0%
- +$506
- After-tax cash flow
- $3,057/yr
For passive investors: Depreciation is non-cash, so a rental often shows a tax loss while cash-flowing — sheltering income. Rental losses are passive: they offset passive income freely, and up to $25,000/yr can offset ordinary (W-2) income if you actively participate and your MAGI is under $100k (phasing out to $0 by $150k); unused losses carry forward. On sale, claimed depreciation is recaptured at up to 25%, and gains may owe capital-gains tax (a 1031 exchange can defer both). Figures are a year-1 estimate at your 24.0% rate — not tax advice; consult a CPA.
Schools (NCES district)
- District
- Danbury School District
- NCES district ID
- 0901020
- Math proficiency
- 19% ▼ -17.00%
- Reading proficiency
- 32% ▼ -16.00%
- Median HH income
- $65,793
- Composite
- 23.93/100
- National rank
- #7784
- State rank
- #131 of 153 in CT
Livability — Danbury
- Score
- 76/100
- State rank
- #51
- US rank
- #3379
Category grades
Schools grade is shown separately in the Schools card above.
Census & demographics
- Census place
- Danbury, CT
- County
- Fairfield County · 765,532 people
- City population
- 87,061
- Metro
- Bridgeport-Stamford-Norwalk, CT
- Population (ZIP)
- 55,833
- Household income
- $76,933
- Rent vs Own
- Severe rent burden
- 3255.0
Population outlook (Western Connecticut County) Hauer SSP2
- By 2040
- 685,031
Race, ethnicity, and origin ACS 2023
- Neighborhood character
- Highly diverse neighborhood (Simpson 0.72)
- Race & ethnicity
- Hispanic / Latino 37% White 35% Two or more races 19% Black 12% Asian 5%
- Hispanic origin (detail)
- Mexican 4% Puerto Rican 3% Dominican 6%
- Common ancestry
- Estonian 8% Russian 4% Romanian 3%
- Foreign-born
- 41% · Canada, Jamaica, Dominican Republic
- Languages at home
- 48% English-only · Spanish 32% Other Indo-European 16% Other Asian/Pacific 1%
Political lean MEDSL · Western Connecticut
- 2024 margin
- D (+19.1) · D 58.8% · R 39.7% · Other 1.6%
- All cycles
- 2024: D+19.1
Not yet ingested
- Civics
- —
Market trends
- HPI YoY
- ▼ -309.71%
- Current HPI
- 286.5484
- Rent YoY
- ▲ 3.08%
- Metro
- Bridgeport-Stamford-Norwalk, CT
- State GDP YoY
- ▲ 1.06%
- F500 in state
- 38
Industry mix (Fortune 500 HQ in CT)
| Industry | F500 HQs | Revenue |
|---|---|---|
| Industrial Machinery | 4 | $38B |
|
||
| Insurance | 3 | $71B |
|
||
| Financial Services | 2 | $25B |
|
||
| Transportation / Logistics | 2 | $18B |
|
||
| Healthcare | 1 | $247B |
|
||
| Telecommunications | 1 | $55B |
|
||
Price history
+302.7% since first listed4 events — show timeline
- 2026-02-03 Listed $279,900 Smart MLS
- 1995-05-03 Sold (Public Records) $50,000 Public Records
- 1995-05-03 Sold (MLS) $50,000 Smart MLS
- 1994-11-08 Listed $69,500 Smart MLS
Property tax history
+4.2%/yrLatest (2023): $2,915 · +25.4% YoY. Source: county tax records.
Cash-flow waterfall
monthlySold comps — $/sqft
last 12 mo · ≤1 miLoading sold comps…