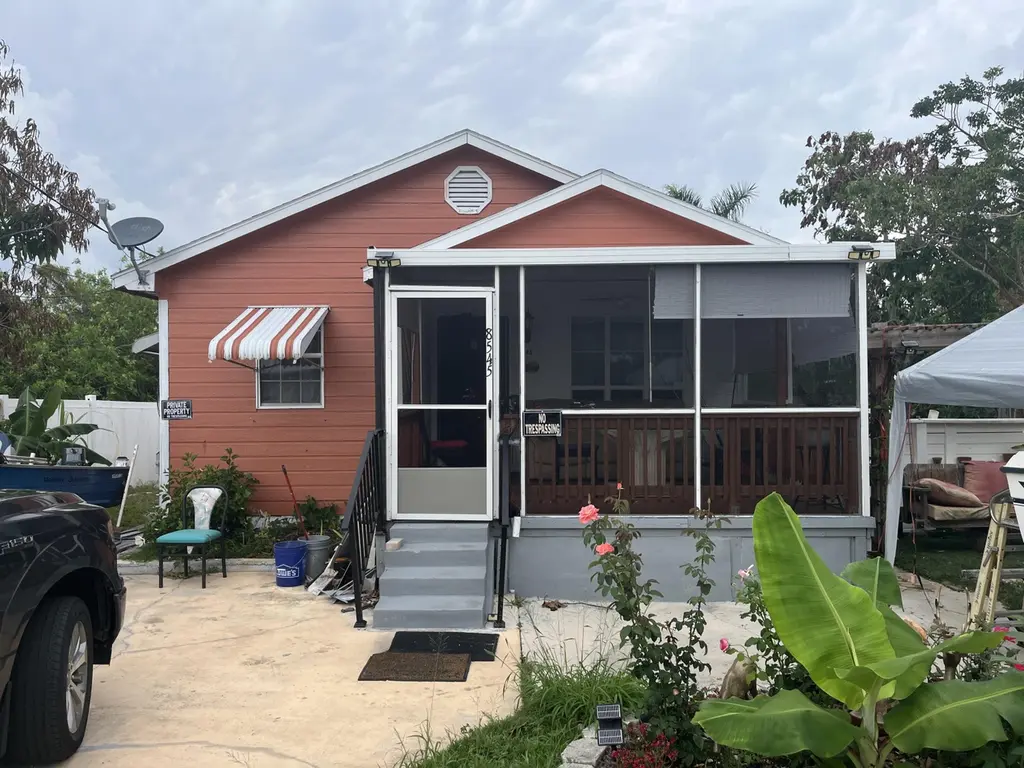
8545 SE Mars St · Hobe Sound, FL
Flood risk 1/10 · Minimal
- FEMA flood zone
- X (unshaded)
- Chance of flooding over 30 yrs
- 0.0%
- Est. flood insurance / yr
- $507 – $1,088
Fire risk 3/10 · Minor
- Est. fire insurance / yr
- $947 – $1,759
Heat risk 10/10 · Severe
- Hot days now (above 106°F)
- 7 days/yr
- Hot days in 30 yrs
- 25 days/yr
Wind risk 10/10 · Severe
- Chance of severe wind over 30 yrs
- 99.0%
Air-quality risk 2/10 · Minimal
- Unhealthy air days now
- 1 days/yr
- Unhealthy air days in 30 yrs
- 2 days/yr
Risk factors via First Street. Map © Google.
Why this score? — see what drove the C+ grade
The composite is a weighted blend of 9 inputs, each scored 0–100. Each bar is that input's sub-score; the figure is the points it added to the 100-point composite (weight × sub-score).
- Cash flow +23.7/30.0
- ARV discount +14.5/15.0
- DSCR +7.6/10.0
- 1% rule +5.0/10.0
- Schools +4.5/10.0
- Livability +3.5/5.0
- Rent growth +3.0/5.0
- Condition / age +2.5/5.0
- Appreciation +0.0/10.0
$299,900
🖨 Deal sheet 📄 Offer letter ✓ Due diligence
Listing remarks
Welcome to this charming three-bedroom, two-bathroom single-story residence located in the Olympia community of Hobe Sound, Florida. This home offers 1,048 square feet of finished living space, providing an efficient and manageable layout for comfortable everyday living. The thoughtful floor plan distributes the three bedrooms and two full bathrooms across one level, making this residence accessible and easy to navigate. Situated in the established Olympia subdivision, this property presents an excellent opportunity for those seeking a solid single-family home in the Hobe Sound area. Just minutes from intracoastal waters & beaches.
Key facts
- Screened front porch
- Vinyl flooring
- Back porch
Tags
Property features AI
Finance
- Other: Pets allowed with no restrictions
Exterior
- Parking: Four total parking spaces; Two open parking spaces; Concrete parking surface
- Utilities: Public water; Public sewer; Cable connected; Electricity connected; Natural gas available; Sewer connected; Water connected
- Home design: Single-family residence; One-story; Faces south; Resale property
- Construction: Wood siding with wood frame construction; Composition roof; Block and concrete perimeter raised foundation
- Exterior features: Guest house on the property; Back yard with privacy and chain link fencing; Fenced yard
Interior
- Kitchen: Dishwasher; Electric range; Microwave; Refrigerator
- Bedrooms: Three bedrooms on the main level
- Flooring: Vinyl flooring
- Bathrooms: Two full bathrooms
- Heating & cooling: Central heating; Central air conditioning
- Interior features: No notable interior built-in features listed
- Laundry & utility: Laundry area (other); 100 Amp electric service
Neighborhood map
What this means for you Summary
Snapshot
- This is a 2-bed/2.0-bath single-family listed at $300k.
Deal economics
- At list price, monthly cash flow is $570 ($7k/yr) — positive.
- The deal already cash-flows at list — no discount required.
- To meet the 1% rule (rent ≥ 1% of price), the offer needs to be $300k (0.0% below list).
- Recommended offer: $291k (3.0% below list) — sets the bar for market timing.
- Cap rate 8.6% vs local median 3.5% in Hobe Sound — top-decile yield for the area; either an underpriced asset or a hidden risk that comps aren't pricing in. Stress-test before assuming the spread holds.
Location & tenants
- Location reads 69/100 on livability (#497 in FL) — a middle-class / working-renter tenant base. Strengths: housing A+, crime A, cost of living A; Watch: employment C-, amenities F, commute F.
- Martin (suburban): math 52% / reading 53% proficiency, ranked #24 of 73 in FL (top 33%) — acceptable for families but not a draw, mixed tenant base, ~2y average lease.
- Zoned schools: Hobe Sound Elementary School (math 51% / reading 48%, grade D, #1,088 of 2,144 statewide, top 53%, 459 students, 68% FRL); Murray Middle School (math 45% / reading 43%, grade D, #327 of 571 statewide, top 57%, 616 students, 69% FRL); South Fork High School (math 36% / reading 48%, grade F, #275 of 667 statewide, top 42%, 1,810 students, 51% FRL) — zoned schools average 63% FRL vs 41% district-wide (22 pts higher); higher-poverty schools than district average — tighter screening recommended.
- Market conditions: Rents rising (+1.8%/yr); 279 active listings in the ZIP; 5 comparable units currently listed for rent nearby; rentals at typical pace (median 23d on market — plan ~3-4 weeks tenant-placement turnaround); 737 units permitted in Martin County in 2024 (167 in 5+ unit buildings).
- At $2,999/mo this rent would consume 51% of the median local household income ($70k/yr) (locally 317% of renters already pay >50% of income on rent) — very limited rent-growth headroom before tenants either downsize or default.
Forward outlook
- Local home prices are declining (-3.0%/yr); year-one equity from $2k of loan paydown is wiped out by about $9k of value loss. Plan a longer hold.
- Martin County population projected at +19% by 2050 — long-run rental-demand tailwind backs the buy-and-hold thesis.
Negotiation context
- It's been on market 36 days — a 3% lower offer ($291k) is reasonable based on typical stale-listing flexibility.
- Current owner paid $45k; list at $300k implies a 566% gain — meaningful room to come down on a strong offer.
Risks & watch-outs
- Climate carrying-cost: severe wind risk, 99% chance of damaging wind over 30y; extreme-heat days projected 7→25/yr by 2055 (HVAC capex compounding) — expect insurance premiums to compound above CPI over the hold.
Questions for the listing agent
- It's been on market 36 days. Have you received any prior offers? Is the seller open to a 3% concession, seller financing, or rate buy-down credit?
- Is there a deadline driving the sale (1031 exchange, divorce, estate, relocation)? That informs how much negotiation room exists.
- What's the average days-on-market for RENTAL listings here right now (not sales)? A rising rental-DOM trend means longer vacancies and softer asking-rent achievability than the comps imply.
- What's the recent tenant-quality profile in this submarket — average credit score on applications, eviction rate, late-payment / NSF rate, and stable-employment percentage? A property-management company in the area should have these aggregated.
- How much new for-sale + rental construction is in the pipeline within 1–3 miles? Heavy new supply typically softens prices + rents 12–24 months out; constrained supply supports both.
Investment metrics
- 1% rule
- 1.00% ✗
- Cap rate
- 8.57%
- Cash-on-cash
- 8.14%
- DSCR
- 1.36
- GRM
- 8.3
CMA / ARV
- ARV (median comp)
- $355,546
- List price
- $299,900
- Delta
- -15.65%
- Verdict
- UNDERPRICED
- Comps
- 20 within 1.0 mi
Show comp detail 6 sales within ~0.75 mi
| Address | Dist | Beds/Ba | Sqft | Sold | Price | $/sf | Match |
|---|---|---|---|---|---|---|---|
| 8487 SE Begonia Way | 0.09mi | 3/1.0 (+1) | 1,056 (+1%) | 3mo | $285,000 | $270 | 83 |
| 8510 SE Citrus Way | 0.14mi | 3/2.0 (+1) | 1,134 (+8%) | 9mo | $353,000 | $311 | 67 |
| 8477 SE Begonia Way | 0.10mi | 3/1.0 (+1) | 936 (-11%) | 8mo | $320,000 | $342 | 62 |
| 8584 SE Date St | 0.17mi | 3/1.5 (+1) | 1,108 (+6%) | 18mo | $360,000 | $325 | 60 |
| 12024 SE Juno Cres SE | 0.55mi | 3/2.0 (+1) | 1,068 (+2%) | 15mo | $545,000 | $510 | 54 |
| 9315 SE Athena St | 0.64mi | 2/1.0 | 896 (-14%) | 11mo | $495,000 | $552 | 33 |
Match score weights: distance 35% · size 25% · config 20% · recency 20%. Top-matched comps best support the ARV.
Projected returns pro-forma
-3.0% appreciation · 1.8% rent growth · sell at horizon
- IRR
- -5.2%
- Equity multiple
- 0.81×
- Total profit
- $-16,014
- Equity at exit
- $44,716
- IRR
- 3.1%
- Equity multiple
- 1.21×
- Total profit
- $17,945
- Equity at exit
- $25,930
Cash invested: $83,972 (down + closing). Projections, not guarantees.
Landlord ↔ Tenant lean methodology
- Overall (STATE)
- 87 Strongly Landlord-Friendly
- State Florida
- 87 Strongly Landlord-Friendly · R+3
- County
- — inherits STATE
- City
- — inherits STATE
ZIP-level market 33455
- Rents YoY
- 1.8%
- Active inventory
- 279
- Price-to-rent
- 8.3×
Monthly cashflow live
- Estimated rent
- $2,999 high interval (Pro) →
- Mortgage (P&I)
- −$1,573
- Tax from tax record
- −$102 /mo · $1,222/yr
- Insurance
- −$125
- HOA
- −$0
- Vacancy / Maint / Mgmt
- −$630
- Net cashflow
- $570
Break-even live
UW: 25.0% down · 7.5% · 30yr · 1.5% tax · 5.0% vac · 8.0% maint · 8.0% mgmt
Financing live
Cash to close
- Down payment
- $74,975
- Closing costs
- $8,997
- Reserves months
- —
- Total cash needed
- —
Loan-product check · same deal, 3 products live
Conventional
25% down · 7.5% · 30yr
- Down + closing
- —
- Monthly P&I
- —
- Monthly cashflow
- —
- DSCR
- —
- Eligible?
- —
Personal DTI + credit; lowest rate.
DSCR
20% down · 8.5% · 30yr
- Down + closing
- —
- Monthly P&I
- —
- Monthly cashflow
- —
- DSCR
- —
- Eligible?
- —
No personal income docs; deal must DSCR.
Hard money
10% down · 12.0% · 12mo
- Down + closing
- —
- Monthly P&I
- —
- Monthly cashflow
- —
- DSCR
- —
- Eligible?
- —
Short-term bridge; refi at stabilization.
Rent comps 5 comps
| Address | Beds | Baths | Sqft | Rent | $/sqft | DOM | Units | Dist |
|---|---|---|---|---|---|---|---|---|
| 8933 SE Ceres St Hobe Sound, FL | 2.0 | 2.0 | 1400 | $3,400 | $2.43 | 23d | 1 | 0.32mi |
| 8968 SE Pine Cone Ln Hobe Sound, FL | 3.0 | 2.0 | 1383 | $2,700 | $1.95 | 23d | 1 | 0.70mi |
| 7916 SE Sugar Pines Way Hobe Sound, FL | 2.0 | 2.0 | 1350 | $2,700 | $2.00 | 13d | 1 | 1.22mi |
| 8574 SE Seagrape Way Hobe Sound, FL | 3.0 | 2.0 | 1476 | $3,600 | $2.44 | 23d | 1 | 1.38mi |
| 8227 SE Croft Cir Hobe Sound, FL | 2.0 | 2.0 | 1177 | $2,100 | $1.78 | 13d | 1 | 1.42mi |
Listing history 19 events
-
2026-06-18days on market $299,900 Active 36 DOM
-
2026-06-17days on market $299,900 Active 35 DOM
-
2026-06-16days on market $299,900 Active 34 DOM
-
2026-06-15days on market $299,900 Active 33 DOM
-
2026-06-14days on market $299,900 Active 31 DOM
-
2026-06-13remarks 643-char remark
-
2026-06-13pricedays on market $299,900 Active 30 DOM
-
2026-06-10days on market $324,900 Active 28 DOM
-
2026-06-09days on market $324,900 Active 27 DOM
-
2026-06-08days on market $324,900 Active 26 DOM
-
2026-06-07days on market $324,900 Active 25 DOM
-
2026-06-03days on market $324,900 Active 21 DOM
-
2026-06-02days on market $324,900 Active 20 DOM
-
2026-06-01days on market $324,900 Active 19 DOM
-
2026-05-31days on market $324,900 Active 18 DOM
-
2026-05-31days on market $324,900 Active 17 DOM
-
2026-05-13$324,900 Active 370-char remark
-
2014-12-01soldstatus $45,000
-
2008-02-29soldstatus $90,000
ⓘ Source: listings_history table (triggers on properties + properties_extension) + one-shot
backfill from property_details.listing_events for pre-trigger history.
Tax reassessment forecast FL · Resets to sale price
- Current annual tax
- $1,222 · $102/mo
- Projected year-2 tax
- $2,489 · $207/mo
- Expected delta
- +$1,268/yr (+$106/mo · 103.8%)
ⓘ Screening estimate from a state-policy table — verify with the county assessor before closing.
Climate risk First Street
- Flood 1/10 Low FEMA zone X (unshaded) · 0% chance over 30 yrs
- Wildfire 3/10 Moderate
- Heat 10/10 Extreme 7 d/yr ≥106°F today · 25 d/yr by 30 yrs out
- Wind 10/10 Extreme 99% chance of damaging wind over 30 yrs
- Air quality 2/10 Low 1 unhealthy d/yr today · 2 by 30 yrs out
Nearby sold comps map
Loading sold comps map…
Walkable amenities ~0.75 mi
Loading nearby amenities…
Taxation est. · year 1
- Rental income
- $35,987
- − Mortgage interest
- −$16,799
- − Property taxes
- −$1,222
- − Insurance
- −$1,500
- − Repairs & maintenance
- −$2,879
- − Management
- −$2,879
- − Depreciation
- −$8,724
- Taxable income
- $1,985
- Est. tax owed @ 24.0%
- −$476
- After-tax cash flow
- $6,360/yr
For passive investors: Depreciation is non-cash, so a rental often shows a tax loss while cash-flowing — sheltering income. Rental losses are passive: they offset passive income freely, and up to $25,000/yr can offset ordinary (W-2) income if you actively participate and your MAGI is under $100k (phasing out to $0 by $150k); unused losses carry forward. On sale, claimed depreciation is recaptured at up to 25%, and gains may owe capital-gains tax (a 1031 exchange can defer both). Figures are a year-1 estimate at your 24.0% rate — not tax advice; consult a CPA.
Schools (NCES district)
- District
- Martin
- NCES district ID
- 1201290
- Math proficiency
- 52% ▼ -14.00%
- Reading proficiency
- 53% ▼ -4.00%
- Median HH income
- $52,482
- Composite
- 45.1/100
- National rank
- #2690
- State rank
- #24 of 73 in FL
Livability — Hobe Sound
- Score
- 69/100
- State rank
- #497
- US rank
- #8763
Category grades
Schools grade is shown separately in the Schools card above.
Census & demographics
- Census place
- Hobe Sound, FL
- County
- Martin County · 165,223 people
- City population
- 20,018
- Metro
- Port St. Lucie, FL
- Population (ZIP)
- 20,018
- Household income
- $70,389
- Rent vs Own
- Severe rent burden
- 317.0
Population outlook (Martin County) Hauer SSP2
- Today (2025)
- 172,383 people
- By 2030
- 180,192 · +4.5%
- By 2040
- 194,114 · +12.6%
- By 2050
- 204,992 · +18.9%
- By 2075
- 229,641 · +33.2%
- By 2100
- 232,146 · +34.7%
Race, ethnicity, and origin ACS 2023
- Neighborhood character
- Predominantly White (84%)
- Race & ethnicity
- White 84% Hispanic / Latino 8% Two or more races 6% Black 5% Asian 1%
- Hispanic origin (detail)
- Mexican 3% Dominican 1%
- Common ancestry
- Romanian 5% Italian 2% Slovak 2%
- Foreign-born
- 8% · Canada
- Languages at home
- 91% English-only · Spanish 6% Other Indo-European 1%
Political lean MEDSL · Martin
- 2024 margin
- Solid R (+31.1) · D 34.1% · R 65.2%
- 2008→2024 swing
- -17.5pp toward R · 2008: -13.6pp · 2024: -31.1pp
- All cycles
- 2024: R+31.1 2020: R+24.6 2016: R+26.9 2012: R+22.9 2008: R+13.6
Not yet ingested
- Civics
- —
Market trends
- HPI YoY
- ▼ -287.05%
- Current HPI
- 356.7273
- Rent YoY
- ▲ 1.80%
- Metro
- Port St. Lucie, FL
- State GDP YoY
- ▲ 3.28%
- F500 in state
- 36
Industry mix (Fortune 500 HQ in FL)
| Industry | F500 HQs | Revenue |
|---|---|---|
| Industrial Technology | 2 | $29B |
|
||
| Insurance | 2 | $17B |
|
||
| Retail | 1 | $60B |
|
||
| Technology Distribution | 1 | $58B |
|
||
| Homebuilding | 1 | $35B |
|
||
| Technology Manufacturing | 1 | $35B |
|
||
Price history
+233.2% since first listed4 events — show timeline
- 2026-06-12 Price Changed $299,900 Beaches MLS
- 2026-05-13 Listed $324,900 Beaches MLS
- 2014-12-01 Sold (Public Records) $45,000 Public Records
- 2008-02-29 Sold (Public Records) $90,000 Public Records
Property tax history
+4.2%/yrLatest (2025): $1,222 · +1.3% YoY. Source: county tax records.
Cash-flow waterfall
monthlySold comps — $/sqft
last 12 mo · ≤1 miLoading sold comps…