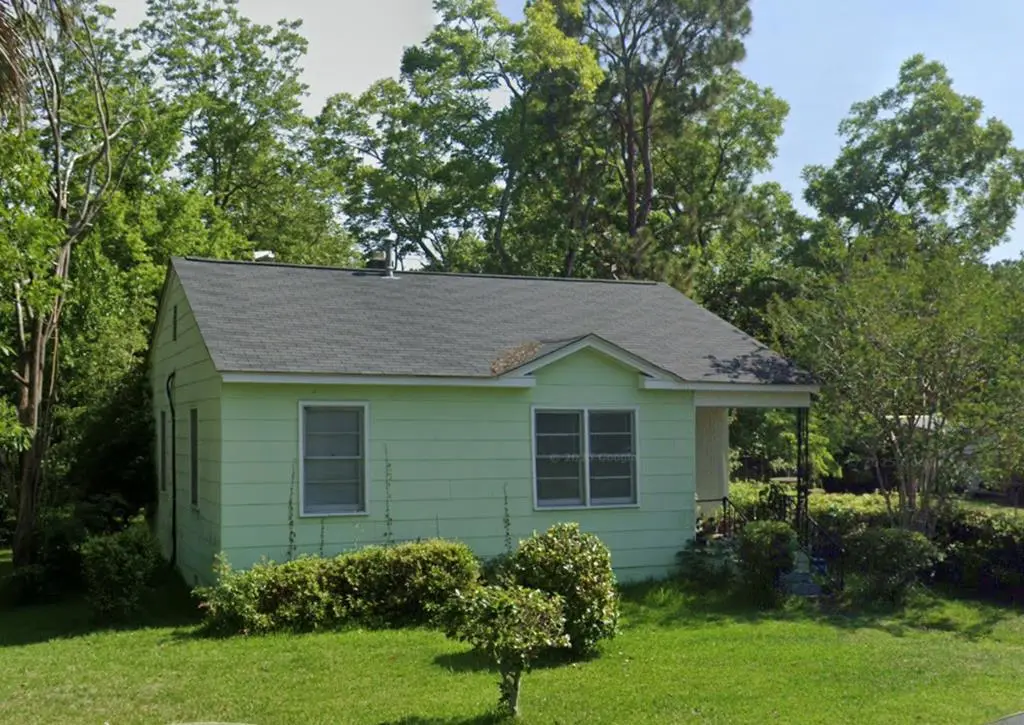
721 Cotton Ave · Albany, GA
Flood risk 1/10 · Minimal
- FEMA flood zone
- X (unshaded)
- Chance of flooding over 30 yrs
- 0.0%
- Est. flood insurance / yr
- $507 – $1,088
Fire risk 2/10 · Minimal
- Est. fire insurance / yr
- $963 – $1,789
Heat risk 8/10 · Major
- Hot days now (above 110°F)
- 7 days/yr
- Hot days in 30 yrs
- 19 days/yr
Wind risk 8/10 · Major
- Chance of severe wind over 30 yrs
- 98.0%
Air-quality risk 3/10 · Minor
- Unhealthy air days now
- 4 days/yr
- Unhealthy air days in 30 yrs
- 4 days/yr
Risk factors via First Street. Map © Google.
Why this score? — see what drove the C grade
The composite is a weighted blend of 9 inputs, each scored 0–100. Each bar is that input's sub-score; the figure is the points it added to the 100-point composite (weight × sub-score).
- Cash flow +30.0/30.0
- 1% rule +10.0/10.0
- DSCR +10.0/10.0
- Livability +3.0/5.0
- Rent growth +2.5/5.0
- Condition / age +2.5/5.0
- Schools +1.1/10.0
- ARV discount +0.0/15.0
- Appreciation +0.0/10.0
$46,900
🖨 Deal sheet (PDF) 📄 Offer letter ✓ Due diligence
Listing remarks
An excellent opportunity for both new and seasoned investors. This offering includes four fully occupied units with long-term tenants, currently generating just over $2,000 in monthly rental income. The portfolio may be purchased individually or as a package for $165,000, and includes 213 Monarch Dr. ($625/mo. ), 721 Cotton Ave. ($525/mo. ), 521 Cochran Ave. ($675/mo. ), and 511 W. Lincoln Ave. ($300/mo. ) Showings will be scheduled only after an accepted offer. Please contact your Realtor for additional details regarding this investment opportunity.
Key facts
- 4,792 sq ft lot
- Built 1956
- Listed 90 days
Property features AI
Finance
- Financial info: Annual tax amount reported
Exterior
- Utilities: Public water; Public sewer
- Home design: Detached single-family residence; Residential property; 1 story
- Construction: Located in the City of Albany subdivision
- Exterior features: Lot roughly 0.11 acres
Interior
- Bathrooms: 1 full bathroom
- Interior features: One-story interior
Neighborhood map
What this means for you Summary
Snapshot
- This is a 3-bed/1.0-bath single-family listed at $47k.
Deal economics
- At list price, monthly cash flow is $360 ($4k/yr) — positive.
- The deal already cash-flows at list — no discount required.
- Meets the 1% rule at list price ($840 rent vs $47k).
- Recommended offer: $44k (6.0% below list) — sets the bar for market timing.
- Cap rate 15.5% vs local median 4.7% in Albany — top-decile yield for the area; either an underpriced asset or a hidden risk that comps aren't pricing in. Stress-test before assuming the spread holds.
Location & tenants
- Location reads 60/100 on livability (#371 in GA) — a middle-class / working-renter tenant base. Strengths: cost of living A+, housing A-, health & safety B+; Watch: crime F, amenities F, commute F.
- Dougherty County (urban): math 12% / reading 16% proficiency, ranked #163 of 174 in GA (top 94%) — low school quality limits family demand, transient renter base, plan for 1-2y turnover; 79% free/reduced lunch — lower-income household profile, screen leases tightly.
- Zoned schools: Alice Coachman Elementary School (math 2% / reading 2%, grade F, #1,204 of 1,228 statewide, top 100%, 419 students, 100% FRL); Monroe High School (math 2% / reading 2%, grade F, #421 of 424 statewide, top 100%, 1,078 students, 100% FRL) — zoned schools average 100% FRL vs 79% district-wide (21 pts higher); higher-poverty schools than district average — tighter screening recommended.
- Market conditions: 177 active listings in the ZIP; 7 comparable units currently listed for rent nearby; rentals at typical pace (median 23d on market — plan ~3-4 weeks tenant-placement turnaround); lower-income renter base — watch delinquency; 45 units permitted in Dougherty County in 2024 (20 in 5+ unit buildings).
Forward outlook
- Local home prices are declining (-3.0%/yr); year-one equity from $324 of loan paydown is wiped out by about $1k of value loss. Plan a longer hold.
- Dougherty County population projected at -24% by 2050 — secular population decline; favor cash flow + early exit over multi-decade hold.
- At projected returns (-3.0% appreciation + 3.0% rent growth), your $13k cash investment doubles in ~4 years — after that, you're playing with house money.
Negotiation context
- It's been on market 90 days — a 6% lower offer ($44k) is reasonable based on typical stale-listing flexibility.
Risks & watch-outs
- Watch-outs: built in 1956 — expect roof / HVAC / electrical / plumbing capex.
- Climate carrying-cost: severe wind risk, 98% chance of damaging wind over 30y; extreme-heat days projected 7→19/yr by 2055 (HVAC capex compounding) — expect insurance premiums to compound above CPI over the hold.
Questions for the listing agent
- It's been on market 90 days. Have you received any prior offers? Is the seller open to a 6% concession, seller financing, or rate buy-down credit?
- Built in 1956 — when were the roof, HVAC, electrical panel, plumbing, and water heater last replaced?
- Why hasn't it sold? Are there any deal-killer items the seller is aware of (foundation, flood, title, zoning, code violations)?
- Is there a deadline driving the sale (1031 exchange, divorce, estate, relocation)? That informs how much negotiation room exists.
- Schools are F-rated, which usually means shorter tenancies and higher turnover. Who's the typical renter profile here, and what's been the actual vacancy rate?
- Crime grade is F in this area — have there been break-ins, vandalism, or insurance claims at this property in the last 3 years? What carrier currently insures it and at what premium?
- What's the average days-on-market for RENTAL listings here right now (not sales)? A rising rental-DOM trend means longer vacancies and softer asking-rent achievability than the comps imply.
- What's the recent tenant-quality profile in this submarket — average credit score on applications, eviction rate, late-payment / NSF rate, and stable-employment percentage? A property-management company in the area should have these aggregated.
- How much new for-sale + rental construction is in the pipeline within 1–3 miles? Heavy new supply typically softens prices + rents 12–24 months out; constrained supply supports both.
Investment metrics
- 1% rule
- 1.79% ✓
- Cap rate
- 15.51%
- Cash-on-cash
- 32.90%
- DSCR
- 2.46
- GRM
- 4.7
CMA / ARV
- ARV (on-the-fly)
- $33,661
- Comps found
- 1
Show comp detail 1 sale within ~0.75 mi
| Address | Dist | Beds/Ba | Sqft | Sold | Price | $/sf | Match |
|---|---|---|---|---|---|---|---|
| 835 Dorsett Ave | 0.37mi | 2/1.0 (-1) | 864 (+5%) | 20mo | $35,000 | $41 | 52 |
Match score weights: distance 35% · size 25% · config 20% · recency 20%. Top-matched comps best support the ARV.
Projected returns pro-forma
-3.0% appreciation · 3.0% rent growth · sell at horizon
- IRR
- 28.1%
- Equity multiple
- 2.17×
- Total profit
- $15,334
- Equity at exit
- $6,993
- IRR
- 35.5%
- Equity multiple
- 4.27×
- Total profit
- $42,883
- Equity at exit
- $4,055
Cash invested: $13,132 (down + closing). Projections, not guarantees.
Landlord ↔ Tenant lean methodology
- Overall (STATE)
- 90 Strongly Landlord-Friendly
- State Georgia
- 90 Strongly Landlord-Friendly · R+3
- County
- — inherits STATE
- City
- — inherits STATE
ZIP-level market 31701
- Home prices YoY
- -27.3%
- Active inventory
- 177
- Price-to-rent
- 4.7×
Monthly cashflow live
- Estimated rent
- $840 high interval (Pro) →
- Mortgage (P&I)
- −$246
- Tax from tax record
- −$38 /mo · $452/yr
- Insurance
- −$20
- HOA
- −$0
- Vacancy / Maint / Mgmt
- −$176
- Net cashflow
- $360
Break-even live
Sensitivity live
| Price | -10% $387 | -5% $373 | +0% $360 | +5% $347 | +10% $334 |
|---|---|---|---|---|---|
| Rent | -10% $294 | -5% $327 | +0% $360 | +5% $393 | +10% $426 |
| Rate | -1.0pp $384 | -0.5pp $372 | base $360 | +0.5pp $348 | +1.0pp $336 |
UW: 25.0% down · 7.5% · 30yr · 1.5% tax · 5.0% vac · 8.0% maint · 8.0% mgmt
Financing live
Cash to close
- Down payment
- $11,725
- Closing costs
- $1,407
- Reserves months
- —
- Total cash needed
- —
Loan-product check · same deal, 3 products live
Conventional
25% down · 7.5% · 30yr
- Down + closing
- —
- Monthly P&I
- —
- Monthly cashflow
- —
- DSCR
- —
- Eligible?
- —
Personal DTI + credit; lowest rate.
DSCR
20% down · 8.5% · 30yr
- Down + closing
- —
- Monthly P&I
- —
- Monthly cashflow
- —
- DSCR
- —
- Eligible?
- —
No personal income docs; deal must DSCR.
Hard money
10% down · 12.0% · 12mo
- Down + closing
- —
- Monthly P&I
- —
- Monthly cashflow
- —
- DSCR
- —
- Eligible?
- —
Short-term bridge; refi at stabilization.
Rent comps 7 comps
| Address | Beds | Baths | Sqft | Rent | $/sqft | DOM | Units | Dist |
|---|---|---|---|---|---|---|---|---|
| 727 Lippitt Dr Albany, GA | 2.0 | 1.0 | 525 | $750 | $1.43 | 22d | 1 | 0.54mi |
| 309 S Cleveland St Unit 309 Cleveland-A Albany, GA | 2.0 | 1.0 | 804 | $650 | $0.81 | 22d | 1 | 0.57mi |
| 1210 Gillespie Ave Unit A Albany, GA | 2.0 | 1.0 | 650 | $550 | $0.85 | 22d | 1 | 0.85mi |
| 1214 Gillespie Ave Unit 1 Albany, GA | 2.0 | 1.0 | 800 | $800 | $1.00 | 22d | 1 | 0.86mi |
| 1502 Gillespie Ave Albany, GA | 3.0 | 1.0 | 1104 | $875 | $0.79 | 22d | 1 | 1.20mi |
| 701 W Society Ave Albany, GA | 1.0–3.0 | 1.0 | 723 | $649 | $0.90 | 22d | 1 | 1.33mi |
| 1204 Julia Ave Apt B Albany, GA | 2.0 | 1.0 | 796 | $900 | $1.13 | 22d | 1 | 1.45mi |
Listing history 19 events
-
2026-06-22days on market $46,900 Active 90 DOM
-
2026-06-19days on market $46,900 Active 88 DOM
-
2026-06-18days on market $46,900 Active 87 DOM
-
2026-06-17days on market $46,900 Active 86 DOM
-
2026-06-16days on market $46,900 Active 85 DOM
-
2026-06-15days on market $46,900 Active 84 DOM
-
2026-06-14days on market $46,900 Active 82 DOM
-
2026-06-13days on market $46,900 Active 81 DOM
-
2026-06-10days on market $46,900 Active 79 DOM
-
2026-06-09days on market $46,900 Active 78 DOM
-
2026-06-08days on market $46,900 Active 77 DOM
-
2026-06-07days on market $46,900 Active 76 DOM
-
2026-06-05days on market $46,900 Active 73 DOM
-
2026-06-02days on market $46,900 Active 71 DOM
-
2026-06-01days on market $46,900 Active 70 DOM
-
2026-05-31days on market $46,900 Active 69 DOM
-
2026-05-30days on market $46,900 Active 68 DOM
-
2026-05-05price $46,900
-
2026-03-23$50,000 Active
ⓘ Source: listings_history table (triggers on properties + properties_extension) + one-shot
backfill from property_details.listing_events for pre-trigger history.
Tax reassessment forecast GA · Resets to sale price
- Current annual tax
- $452 · $38/mo
- Projected year-2 tax
- $452 · $38/mo
- Expected delta
- $0/yr ($0/mo · 0.0%)
ⓘ Screening estimate from a state-policy table — verify with the county assessor before closing.
Climate risk First Street
- Flood 1/10 Low FEMA zone X (unshaded) · 0% chance over 30 yrs
- Wildfire 2/10 Low
- Heat 8/10 Severe 7 d/yr ≥110°F today · 19 d/yr by 30 yrs out
- Wind 8/10 Severe 98% chance of damaging wind over 30 yrs
- Air quality 3/10 Moderate 4 unhealthy d/yr today · 4 by 30 yrs out
Nearby sold comps map
Loading sold comps map…
Walkable amenities ~0.75 mi
Loading nearby amenities…
Taxation est. · year 1
- Rental income
- $10,074
- − Mortgage interest
- −$2,627
- − Property taxes
- −$452
- − Insurance
- −$234
- − Repairs & maintenance
- −$806
- − Management
- −$806
- − Depreciation
- −$1,364
- Taxable income
- $3,785
- Est. tax owed @ 24.0%
- −$908
- After-tax cash flow
- $3,413/yr
For passive investors: Depreciation is non-cash, so a rental often shows a tax loss while cash-flowing — sheltering income. Rental losses are passive: they offset passive income freely, and up to $25,000/yr can offset ordinary (W-2) income if you actively participate and your MAGI is under $100k (phasing out to $0 by $150k); unused losses carry forward. On sale, claimed depreciation is recaptured at up to 25%, and gains may owe capital-gains tax (a 1031 exchange can defer both). Figures are a year-1 estimate at your 24.0% rate — not tax advice; consult a CPA.
Schools (NCES district)
- District
- Dougherty County
- NCES district ID
- 1301830
- Math proficiency
- 12% ▼ -15.00%
- Reading proficiency
- 16% ▼ -9.00%
- Median HH income
- $33,105
- Composite
- 11.31/100
- National rank
- #9716
- State rank
- #163 of 174 in GA
Livability — Albany
- Score
- 60/100
- State rank
- #371
- US rank
- #18903
Category grades
Schools grade is shown separately in the Schools card above.
Census & demographics
- Census place
- Albany, GA
- County
- Dougherty County · 89,040 people
- City population
- 89,040
- Metro
- Albany, GA
- Population (ZIP)
- 16,135
- Household income
- $35,025
- Rent vs Own
- Severe rent burden
- 1383.0
Population outlook (Dougherty County) Hauer SSP2
- Today (2025)
- 84,551 people
- By 2030
- 80,637 · -4.6%
- By 2040
- 72,090 · -14.7%
- By 2050
- 64,056 · -24.2%
- By 2075
- 46,332 · -45.2%
- By 2100
- 33,127 · -60.8%
Race, ethnicity, and origin ACS 2023
- Neighborhood character
- Predominantly Black (74%)
- Race & ethnicity
- Black 74% White 21% Two or more races 2% Hispanic / Latino 2%
- Common ancestry
- Serbian 1%
- Foreign-born
- 2% · Canada
- Languages at home
- 97% English-only · Spanish 2% Arabic 1%
Political lean MEDSL · Dougherty
- 2024 margin
- Solid D (+41.1) · D 70.4% · R 29.3%
- 2008→2024 swing
- +6.2pp toward D · 2008: 35.0pp · 2024: 41.1pp
- All cycles
- 2024: D+41.1 2020: D+40.0 2016: D+38.3 2012: D+39.0 2008: D+35.0
Not yet ingested
- Civics
- —
Market trends
- HPI YoY
- ▼ -54.55%
- Current HPI
- 145.4604
- Rent YoY
- —
- Metro
- Albany, GA
- State GDP YoY
- ▲ 2.66%
- F500 in state
- 28
Industry mix (Fortune 500 HQ in GA)
| Industry | F500 HQs | Revenue |
|---|---|---|
| Paper / Packaging | 2 | $29B |
|
||
| Retail | 1 | $160B |
|
||
| Transportation / Logistics | 1 | $91B |
|
||
| Airlines | 1 | $62B |
|
||
| Consumer Goods | 1 | $47B |
|
||
| Utilities | 1 | $25B |
|
||
Price history
-6.2% since first listed2 events — show timeline
- 2026-05-05 Price Changed $46,900 SWGABOR
- 2026-03-23 Listed $50,000 SWGABOR
Property tax history
+2.2%/yrLatest (2025): $452 · +6.1% YoY. Source: county tax records.
Cash-flow waterfall
monthlySold comps — $/sqft
last 12 mo · ≤1 miLoading sold comps…