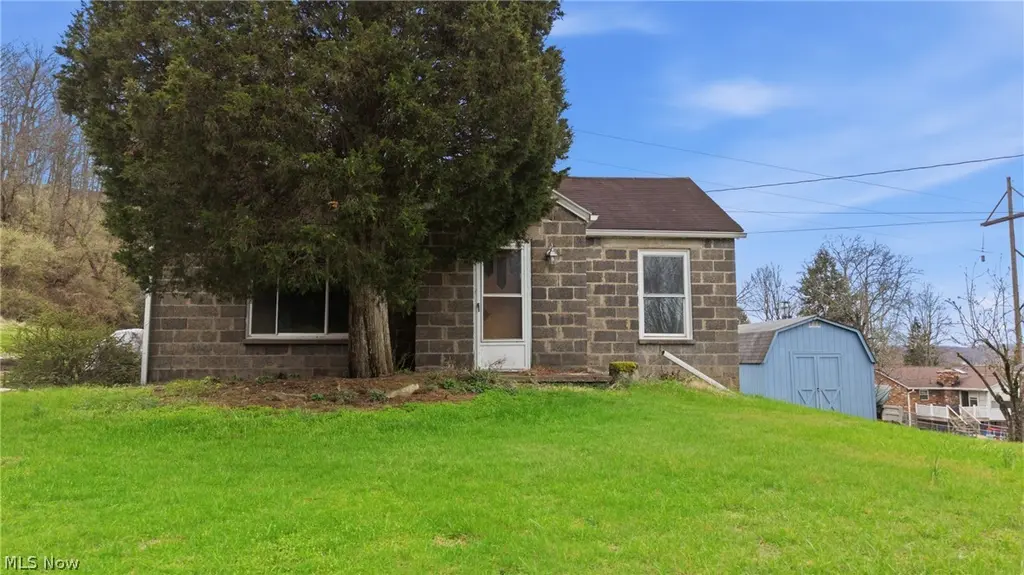
1506 21st St · Vienna, WV
Flood risk 1/10 · Minimal
- FEMA flood zone
- X (unshaded)
- Chance of flooding over 30 yrs
- 0.0%
- Est. flood insurance / yr
- $473 – $860
Fire risk 3/10 · Minor
- Est. fire insurance / yr
- $787 – $1,461
Heat risk 4/10 · Minor
- Hot days now (above 101°F)
- 7 days/yr
- Hot days in 30 yrs
- 18 days/yr
Wind risk 2/10 · Minimal
- Chance of severe wind over 30 yrs
- 1.0%
Air-quality risk 1/10 · Minimal
- Unhealthy air days now
- 0 days/yr
- Unhealthy air days in 30 yrs
- 0 days/yr
Risk factors via First Street. Map © Google.
Why this score? — see what drove the B- grade
The composite is a weighted blend of 9 inputs, each scored 0–100. Each bar is that input's sub-score; the figure is the points it added to the 100-point composite (weight × sub-score).
- Cash flow +30.0/30.0
- DSCR +10.0/10.0
- 1% rule +8.6/10.0
- ARV discount +7.5/15.0
- Livability +3.8/5.0
- Schools +3.6/10.0
- Rent growth +2.5/5.0
- Condition / age +2.5/5.0
- Appreciation +0.0/10.0
$99,000
🖨 Deal sheet 📄 Offer letter ✓ Due diligence
Listing remarks
3 bedrooms on the main floor, 2 additional potential bedrooms upstairs. This lot alone is just over 3 acres at the end of a dead-end street in Vienna, WV. This would make a great investment for a rental portfolio or a renovation loan candidate.
Key facts
- Dead-end street
- 3 acres
- 3.67 acre lot
Tags
Neighborhood map
What this means for you Summary
Snapshot
- This is a 4-bed/2.0-bath single-family listed at $99k.
Deal economics
- At list price, monthly cash flow is $420 ($5k/yr) — positive.
- The deal already cash-flows at list — no discount required.
- Meets the 1% rule at list price ($1k rent vs $99k).
- Cap rate 11.4% vs local median 3.4% in Vienna — top-decile yield for the area; either an underpriced asset or a hidden risk that comps aren't pricing in. Stress-test before assuming the spread holds.
Location & tenants
- Location reads 75/100 on livability (#30 in WV, #4,078 nationally) — a middle-class / working-renter tenant base. Strengths: cost of living A+, housing A+, health & safety A+; Watch: schools D+, employment D+, amenities F.
- Wood County Schools (urban): math 38% / reading 48% proficiency, ranked #3 of 55 in WV (top 6%) — families likely to look elsewhere, expect single-tenant / working-renter base with shorter leases.
- Market conditions: 47 active listings in the ZIP; 124 units permitted in Wood County in 2024 (33 in 5+ unit buildings).
Forward outlook
- Local home prices are declining (-3.0%/yr); year-one equity from $684 of loan paydown is wiped out by about $3k of value loss. Plan a longer hold.
- Wood County population projected at -13% by 2050 — secular population decline; favor cash flow + early exit over multi-decade hold.
- At projected returns (-3.0% appreciation + 3.0% rent growth), your $28k cash investment doubles in ~7 years — after that, you're playing with house money.
Negotiation context
- Only 12 days on market — expect competitive offers; lowballing is unlikely to land.
- 2 sale attempts since 15y ago with the ask held roughly flat each time — persistent listings suggest the price (not the market) is what's stuck; bring a comps-based counter.
Risks & watch-outs
- Watch-outs: built in 1937 — expect roof / HVAC / electrical / plumbing capex.
Questions for the listing agent
- Built in 1937 — when were the roof, HVAC, electrical panel, plumbing, and water heater last replaced?
- Is there a deadline driving the sale (1031 exchange, divorce, estate, relocation)? That informs how much negotiation room exists.
- Schools are D-rated, which usually means shorter tenancies and higher turnover. Who's the typical renter profile here, and what's been the actual vacancy rate?
- What's the average days-on-market for RENTAL listings here right now (not sales)? A rising rental-DOM trend means longer vacancies and softer asking-rent achievability than the comps imply.
- What's the recent tenant-quality profile in this submarket — average credit score on applications, eviction rate, late-payment / NSF rate, and stable-employment percentage? A property-management company in the area should have these aggregated.
- How much new for-sale + rental construction is in the pipeline within 1–3 miles? Heavy new supply typically softens prices + rents 12–24 months out; constrained supply supports both.
Investment metrics
- 1% rule
- 1.36% ✓
- Cap rate
- 11.39%
- Cash-on-cash
- 18.19%
- DSCR
- 1.81
- GRM
- 6.1
CMA / ARV
- ARV (on-the-fly)
- $231,574
- Comps found
- 12
Show comp detail 12 sales within ~0.75 mi
| Address | Dist | Beds/Ba | Sqft | Sold | Price | $/sf | Match |
|---|---|---|---|---|---|---|---|
| 1317 19 St | 0.17mi | 4/3.5 | 1,800 (+8%) | 2mo | $307,000 | $171 | 72 |
| 1105 13th Ave | 0.61mi | 3/2.0 (-1) | 1,692 (+2%) | 4mo | $300,000 | $177 | 61 |
| 1802 28th St | 0.32mi | 3/2.0 (-1) | 1,800 (+8%) | 10mo | $360,000 | $200 | 58 |
| 1102 14th Ave | 0.58mi | 4/1.0 | 1,632 (-2%) | 9mo | $182,000 | $112 | 58 |
| 6 Ashwood Dr | 0.34mi | 4/2.5 | 1,500 (-10%) | 9mo | $254,000 | $169 | 58 |
| 1100 14th St | 0.61mi | 3/2.0 (-1) | 1,775 (+6%) | 2mo | $192,000 | $108 | 54 |
| 1005 28th St | 0.61mi | 3/2.0 (-1) | 1,720 (+3%) | 8mo | $230,000 | $134 | 54 |
| 1201 23rd St | 0.36mi | 3/2.5 (-1) | 1,890 (+13%) | 5mo | $200,000 | $106 | 49 |
| 1010 18th St | 0.43mi | 3/1.0 (-1) | 1,480 (-11%) | 4mo | $147,500 | $100 | 49 |
| 1203 13th Ave | 0.55mi | 3/2.0 (-1) | 1,430 (-14%) | 11mo | $199,000 | $139 | 36 |
| 56 Wyndemere Way | 0.74mi | 3/2.0 (-1) | 1,898 (+14%) | 1mo | $425,000 | $224 | 36 |
| 702 17th St | 0.73mi | 3/2.0 (-1) | 1,456 (-13%) | 10mo | $67,769 | $47 | 32 |
Match score weights: distance 35% · size 25% · config 20% · recency 20%. Top-matched comps best support the ARV.
Projected returns pro-forma
-3.0% appreciation · 3.0% rent growth · sell at horizon
- IRR
- 9.8%
- Equity multiple
- 1.39×
- Total profit
- $10,710
- Equity at exit
- $14,761
- IRR
- 18.9%
- Equity multiple
- 2.58×
- Total profit
- $43,763
- Equity at exit
- $8,560
Cash invested: $27,720 (down + closing). Projections, not guarantees.
Landlord ↔ Tenant lean methodology
- Overall (STATE)
- 83 Strongly Landlord-Friendly
- State West Virginia
- 83 Strongly Landlord-Friendly · R+22
- County
- — inherits STATE
- City
- — inherits STATE
ZIP-level market 26105
- Home prices YoY
- -17.5%
- Active inventory
- 47
- Price-to-rent
- 6.1×
Monthly cashflow live
- Estimated rent
- $1,348 medium interval (Pro) →
- Mortgage (P&I)
- −$519
- Tax from tax record
- −$84 /mo · $1,008/yr
- Insurance
- −$41
- HOA
- −$0
- Vacancy / Maint / Mgmt
- −$283
- Net cashflow
- $420
Break-even live
UW: 25.0% down · 7.5% · 30yr · 1.5% tax · 5.0% vac · 8.0% maint · 8.0% mgmt
Financing live
Cash to close
- Down payment
- $24,750
- Closing costs
- $2,970
- Reserves months
- —
- Total cash needed
- —
Loan-product check · same deal, 3 products live
Conventional
25% down · 7.5% · 30yr
- Down + closing
- —
- Monthly P&I
- —
- Monthly cashflow
- —
- DSCR
- —
- Eligible?
- —
Personal DTI + credit; lowest rate.
DSCR
20% down · 8.5% · 30yr
- Down + closing
- —
- Monthly P&I
- —
- Monthly cashflow
- —
- DSCR
- —
- Eligible?
- —
No personal income docs; deal must DSCR.
Hard money
10% down · 12.0% · 12mo
- Down + closing
- —
- Monthly P&I
- —
- Monthly cashflow
- —
- DSCR
- —
- Eligible?
- —
Short-term bridge; refi at stabilization.
Listing history 7 events
-
2026-04-04status Pending
-
2026-03-22$99,000 Active
-
2021-05-10soldstatus $90,000
-
2011-10-31historical
-
2011-03-28$100,000
-
2003-06-30soldstatus $66,500
-
2001-05-08soldstatus $135,000
ⓘ Source: listings_history table (triggers on properties + properties_extension) + one-shot
backfill from property_details.listing_events for pre-trigger history.
Tax reassessment forecast WV · Resets to sale price
- Current annual tax
- $1,008 · $84/mo
- Projected year-2 tax
- $1,008 · $84/mo
- Expected delta
- $0/yr ($0/mo · 0.0%)
ⓘ Screening estimate from a state-policy table — verify with the county assessor before closing.
Climate risk First Street
- Flood 1/10 Low FEMA zone X (unshaded) · 0% chance over 30 yrs
- Wildfire 3/10 Moderate
- Heat 4/10 Moderate 7 d/yr ≥101°F today · 18 d/yr by 30 yrs out
- Wind 2/10 Low 100% chance of damaging wind over 30 yrs
- Air quality 1/10 Low 0 unhealthy d/yr today · 0 by 30 yrs out
Nearby sold comps map
Loading sold comps map…
Walkable amenities ~0.75 mi
Loading nearby amenities…
Taxation est. · year 1
- Rental income
- $16,170
- − Mortgage interest
- −$5,546
- − Property taxes
- −$1,008
- − Insurance
- −$495
- − Repairs & maintenance
- −$1,294
- − Management
- −$1,294
- − Depreciation
- −$2,880
- Taxable income
- $3,654
- Est. tax owed @ 24.0%
- −$877
- After-tax cash flow
- $4,164/yr
For passive investors: Depreciation is non-cash, so a rental often shows a tax loss while cash-flowing — sheltering income. Rental losses are passive: they offset passive income freely, and up to $25,000/yr can offset ordinary (W-2) income if you actively participate and your MAGI is under $100k (phasing out to $0 by $150k); unused losses carry forward. On sale, claimed depreciation is recaptured at up to 25%, and gains may owe capital-gains tax (a 1031 exchange can defer both). Figures are a year-1 estimate at your 24.0% rate — not tax advice; consult a CPA.
Schools (NCES district)
- District
- Wood County Schools
- NCES district ID
- 5401620
- Math proficiency
- 38% ▼ -10.00%
- Reading proficiency
- 48% ▼ -4.00%
- Median HH income
- $42,363
- Composite
- 36.22/100
- National rank
- #4728
- State rank
- #3 of 55 in WV
Livability — Vienna
- Score
- 75/100
- State rank
- #30
- US rank
- #4078
Category grades
Schools grade is shown separately in the Schools card above.
Census & demographics
- Census place
- Vienna, WV
- Population (ZIP)
- 12,297
Population outlook (Wood County) Hauer SSP2
- Today (2025)
- 84,304 people
- By 2030
- 82,420 · -2.2%
- By 2040
- 78,133 · -7.3%
- By 2050
- 73,639 · -12.7%
- By 2075
- 63,093 · -25.2%
- By 2100
- 50,461 · -40.1%
Race, ethnicity, and origin ACS 2023
- Neighborhood character
- Predominantly White (90%)
- Race & ethnicity
- White 90% Two or more races 5% Black 2% Hispanic / Latino 2% Asian 1%
- Common ancestry
- Romanian 2% Slovak 2% Serbian 2%
- Foreign-born
- 2% · Canada
- Languages at home
- 97% English-only · Spanish 1% Other Asian/Pacific 1%
Political lean MEDSL · Wood
- 2024 margin
- Solid R (+43.0) · D 27.6% · R 70.7% · Other 1.6%
- 2008→2024 swing
- -14.4pp toward R · 2008: -28.7pp · 2024: -43.0pp
- All cycles
- 2024: R+43.0 2020: R+42.0 2016: R+47.8 2012: R+32.5 2008: R+28.7
Not yet ingested
- Civics
- —
Market trends
- HPI YoY
- ▼ -47.43%
- Current HPI
- 223.0958
- Rent YoY
- —
- Metro
- —
- State GDP YoY
- —
- F500 in state
- 0
Price history
-26.7% since first listed7 events — show timeline
- 2026-04-04 Pending — MLSNOW
- 2026-03-22 Listed $99,000 MLSNOW
- 2021-05-10 Sold (Public Records) $90,000 Public Records
- 2011-10-31 Listing Removed — MLSNOW
- 2011-03-28 Listed $100,000 MLSNOW
- 2003-06-30 Sold (Public Records) $66,500 Public Records
- 2001-05-08 Sold (Public Records) $135,000 Public Records
Property tax history
+3.4%/yrLatest (2025): $1,008 · +5.5% YoY. Source: county tax records.
Cash-flow waterfall
monthlySold comps — $/sqft
last 12 mo · ≤1 miLoading sold comps…