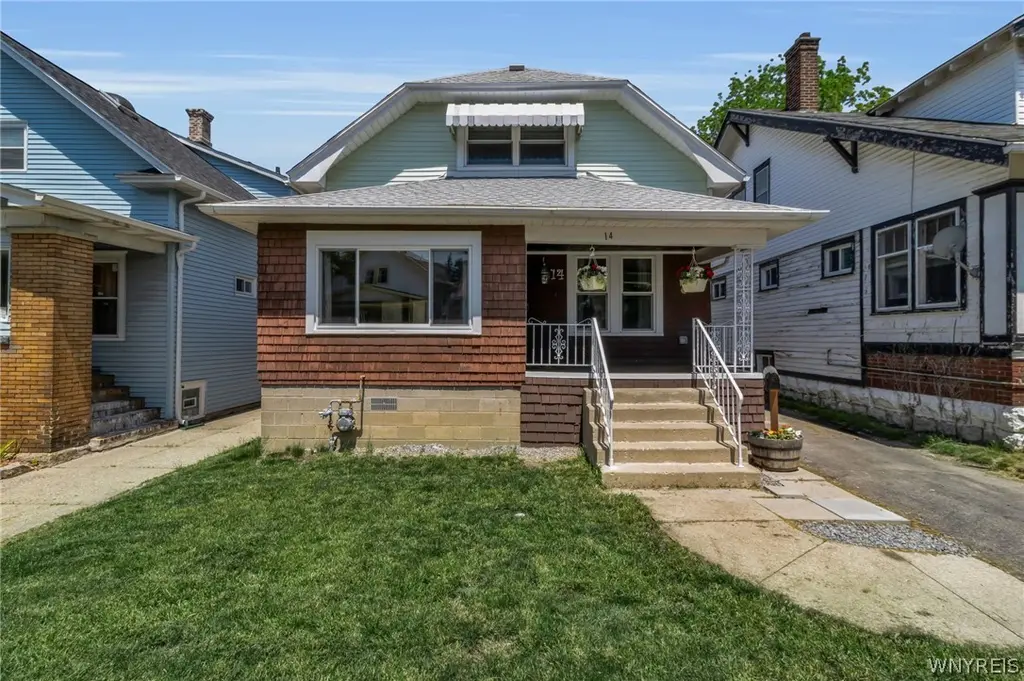
14 Donaldson Rd · Buffalo, NY
Flood risk 1/10 · Minimal
- FEMA flood zone
- X (unshaded)
- Chance of flooding over 30 yrs
- 0.0%
- Est. flood insurance / yr
- $473 – $860
Fire risk 1/10 · Minimal
- Est. fire insurance / yr
- $691 – $1,283
Heat risk 3/10 · Minor
- Hot days now (above 91°F)
- 7 days/yr
- Hot days in 30 yrs
- 15 days/yr
Wind risk 1/10 · Minimal
- Chance of severe wind over 30 yrs
- —
Air-quality risk 4/10 · Minor
- Unhealthy air days now
- 4 days/yr
- Unhealthy air days in 30 yrs
- 9 days/yr
Risk factors via First Street. Map © Google.
Why this score? — see what drove the B grade
The composite is a weighted blend of 9 inputs, each scored 0–100. Each bar is that input's sub-score; the figure is the points it added to the 100-point composite (weight × sub-score).
- Cash flow +28.6/30.0
- ARV discount +15.0/15.0
- DSCR +10.0/10.0
- 1% rule +6.7/10.0
- Livability +3.9/5.0
- Schools +3.3/10.0
- Rent growth +2.5/5.0
- Condition / age +2.5/5.0
- Appreciation +0.0/10.0
$179,900
🖨 Deal sheet 📄 Offer letter ✓ Due diligence
Listing remarks MLS
A fully remodeled jewel centered in the well sought after Hamlin Park area. Featuring a completely new kitchen with granite counters and a granite roll away center island, a remodeled full bath on first floor and remodeled bath on second floor. Beautiful tile floors in kitchen with tiled walls and back splashes and glass block windows in basement. Come one come all do not miss this quality renovated home it can be yours. (Historical Preservation) (Property assessments square footage is being challenged by the owner, measurements independent from city assessers showes over 2000 sqft. )
Key facts
- Remodeled kitchen
- Natural light
- Open layout concept
Tags
Property features AI
Exterior
- Parking: Detached garage with 2 spaces; Garage door opener; Additional storage
- Utilities: Electricity connected (circuit breakers); Public water connected; Sewer connected; Cable available; High-speed internet available
- Home design: Single-story home; Resale property; Main thoroughfare frontage; Rectangular lot (approx. 35 x 105)
- Construction: Cedar and vinyl siding; Architectural shingle roof; Block foundation; Copper plumbing; Existing (previously built) structure
- Exterior features: Blacktop driveway; Balcony; Covered porch; Fence (partial)
Interior
- Kitchen: Gas oven and gas range; Dishwasher; Microwave; Refrigerator; Kitchen island; Granite counters; Appliances negotiable
- Bedrooms: One main-level bedroom
- Flooring: Hardwood; Laminate; Tile; Varies
- Bathrooms: Two full bathrooms; One main-level bathroom
- Heating & cooling: Ductless cooling; Ductless heating; Gas heating; Radiator heating
- Interior features: Breakfast bar; Ceiling fan(s); Separate/formal dining room; Eat-in kitchen; Separate/formal living room; Granite counters; Kitchen island; Living/dining room; Natural woodwork; Main level primary; Programmable thermostat; Has full basement
- Laundry & utility: Washer and dryer; Laundry located in basement; Gas water heater
Neighborhood map
What this means for you Summary
Snapshot
- This is a 3-bed/2.0-bath single-family listed at $180k.
Deal economics
- At list price, monthly cash flow is $593 ($7k/yr) — positive.
- The deal already cash-flows at list — no discount required.
- Meets the 1% rule at list price ($2k rent vs $180k).
- Cap rate 10.2% vs local median 8.0% in Buffalo — meaningfully above typical; check what's discounted (condition, days-on-market, listing class) to confirm the premium yield is real.
Location & tenants
- Location reads 77/100 on livability (#195 in NY, #3,011 nationally) — a middle-class / working-renter tenant base. Strengths: commute A+, housing A+, health & safety A+; Watch: crime F, employment D-.
- Buffalo City School District (urban): math 41% / reading 40% proficiency, ranked #535 of 590 in NY (top 91%) — families likely to look elsewhere, expect single-tenant / working-renter base with shorter leases; 75% free/reduced lunch — lower-income household profile, screen leases tightly.
- Market conditions: 54 active listings in the ZIP; 14 comparable units currently listed for rent nearby; rentals at typical pace (median 24d on market — plan ~3-4 weeks tenant-placement turnaround); 43% of comp listings sitting > 30 days — soft ceiling on asking rent; 1,244 units permitted in Erie County in 2024 (563 in 5+ unit buildings).
- At $2,103/mo this rent would consume 52% of the median local household income ($48k/yr) (locally 723% of renters already pay >50% of income on rent) — very limited rent-growth headroom before tenants either downsize or default.
Forward outlook
- Local home prices are declining (-3.0%/yr); year-one equity from $1k of loan paydown is wiped out by about $5k of value loss. Plan a longer hold.
- At projected returns (-3.0% appreciation + 3.0% rent growth), your $50k cash investment doubles in ~9 years — after that, you're playing with house money.
Negotiation context
- Only 12 days on market — expect competitive offers; lowballing is unlikely to land.
- 2 sale attempts since 8y ago with the ask held roughly flat each time — persistent listings suggest the price (not the market) is what's stuck; bring a comps-based counter.
- Current owner paid $145k; 24% above their basis — modest negotiation headroom, anchor on the comps not their cost.
Risks & watch-outs
- Watch-outs: built in 1920 — expect roof / HVAC / electrical / plumbing capex.
Questions for the listing agent
- Built in 1920 — when were the roof, HVAC, electrical panel, plumbing, and water heater last replaced?
- Is there a deadline driving the sale (1031 exchange, divorce, estate, relocation)? That informs how much negotiation room exists.
- Crime grade is F in this area — have there been break-ins, vandalism, or insurance claims at this property in the last 3 years? What carrier currently insures it and at what premium?
- What's the average days-on-market for RENTAL listings here right now (not sales)? A rising rental-DOM trend means longer vacancies and softer asking-rent achievability than the comps imply.
- What's the recent tenant-quality profile in this submarket — average credit score on applications, eviction rate, late-payment / NSF rate, and stable-employment percentage? A property-management company in the area should have these aggregated.
- How much new for-sale + rental construction is in the pipeline within 1–3 miles? Heavy new supply typically softens prices + rents 12–24 months out; constrained supply supports both.
Investment metrics
- 1% rule
- 1.17% ✓
- Cap rate
- 10.25%
- Cash-on-cash
- 14.12%
- DSCR
- 1.63
- GRM
- 7.1
CMA / ARV
- ARV (on-the-fly)
- $241,262
- Comps found
- 11
Show comp detail 11 sales within ~0.75 mi
| Address | Dist | Beds/Ba | Sqft | Sold | Price | $/sf | Match |
|---|---|---|---|---|---|---|---|
| 88 Donaldson Rd | 0.14mi | 3/1.5 | 1,699 (-6%) | 13mo | $217,000 | $128 | 70 |
| 41 Brunswick Blvd Blvd | 0.13mi | 3/2.0 | 2,054 (+13%) | 13mo | $260,000 | $127 | 61 |
| 84 Hedley Pl | 0.31mi | 4/2.0 (+1) | 1,836 (+1%) | 22mo | $250,000 | $136 | 61 |
| 466 Northland Ave | 0.47mi | 3/1.0 | 1,814 (0%) | 19mo | $200,000 | $110 | 58 |
| 196 Hughes Ave | 0.47mi | 4/2.0 (+1) | 1,808 (-0%) | 17mo | $240,000 | $133 | 58 |
| 109 Hughes Ave | 0.40mi | 4/1.5 (+1) | 1,687 (-7%) | 10mo | $175,000 | $104 | 54 |
| 164 Harvard Pl | 0.60mi | 3/2.5 | 1,700 (-6%) | 8mo | $344,000 | $202 | 53 |
| 188 Waverly St | 0.32mi | 3/1.5 | 1,541 (-15%) | 15mo | $264,000 | $171 | 46 |
| 15 Blaine Ave | 0.35mi | 4/1.0 (+1) | 1,615 (-11%) | 19mo | $290,000 | $180 | 40 |
| 392 Humboldt Pkwy | 0.53mi | 4/1.0 (+1) | 1,602 (-12%) | 10mo | $195,000 | $122 | 38 |
| 81 Harvard Pl | 0.53mi | 3/2.5 | 2,073 (+14%) | 19mo | $295,000 | $142 | 33 |
Match score weights: distance 35% · size 25% · config 20% · recency 20%. Top-matched comps best support the ARV.
Projected returns pro-forma
-3.0% appreciation · 3.0% rent growth · sell at horizon
- IRR
- 4.4%
- Equity multiple
- 1.17×
- Total profit
- $8,532
- Equity at exit
- $26,824
- IRR
- 13.8%
- Equity multiple
- 2.11×
- Total profit
- $55,743
- Equity at exit
- $15,554
Cash invested: $50,372 (down + closing). Projections, not guarantees.
Landlord ↔ Tenant lean methodology
- Overall (STATE)
- 15 Strongly Tenant-Friendly
- State New York
- 15 Strongly Tenant-Friendly · D+10
- County
- — inherits STATE
- City
- — inherits STATE
ZIP-level market 14208
- Home prices YoY
- -3.4%
- Active inventory
- 54
- Price-to-rent
- 7.1×
Monthly cashflow live
- Estimated rent
- $2,103 high interval (Pro) →
- Mortgage (P&I)
- −$943
- Tax from tax record
- −$50 /mo · $601/yr
- Insurance
- −$75
- HOA
- −$0
- Vacancy / Maint / Mgmt
- −$442
- Net cashflow
- $593
Break-even live
UW: 25.0% down · 7.5% · 30yr · 1.5% tax · 5.0% vac · 8.0% maint · 8.0% mgmt
Financing live
Cash to close
- Down payment
- $44,975
- Closing costs
- $5,397
- Reserves months
- —
- Total cash needed
- —
Loan-product check · same deal, 3 products live
Conventional
25% down · 7.5% · 30yr
- Down + closing
- —
- Monthly P&I
- —
- Monthly cashflow
- —
- DSCR
- —
- Eligible?
- —
Personal DTI + credit; lowest rate.
DSCR
20% down · 8.5% · 30yr
- Down + closing
- —
- Monthly P&I
- —
- Monthly cashflow
- —
- DSCR
- —
- Eligible?
- —
No personal income docs; deal must DSCR.
Hard money
10% down · 12.0% · 12mo
- Down + closing
- —
- Monthly P&I
- —
- Monthly cashflow
- —
- DSCR
- —
- Eligible?
- —
Short-term bridge; refi at stabilization.
Rent comps 14 comps
| Address | Beds | Baths | Sqft | Rent | $/sqft | DOM | Units | Dist |
|---|---|---|---|---|---|---|---|---|
| 102 Florida St Buffalo, NY | 3.0 | 1.0 | 1296 | $1,650 | $1.27 | 44d | 1 | 0.20mi |
| 184 Butler Ave Unit 1545840P Buffalo, NY | 4.0 | 1.0 | 1496 | $3,226 | $2.16 | 14d | 1 | 0.39mi |
| 1786 Main St Unit 104 Buffalo, NY | 2.0 | 2.0 | 1256 | $1,875 | $1.49 | 44d | 1 | 0.39mi |
| 563 Humboldt Pkwy Buffalo, NY | 3.0 | 1.0 | 2004 | $1,200 | $0.60 | 24d | 1 | 0.41mi |
| 73 Inter Park Ave Buffalo, NY | 3.0 | 1.0 | 2080 | $1,300 | $0.62 | 14d | 1 | 0.64mi |
| 121 Humboldt Pkwy Unit B Buffalo, NY | 2.0 | 1.0 | 1265 | $1,750 | $1.38 | 44d | 1 | 0.66mi |
| 888 Delaware Ave Buffalo, NY | 2.0 | 1.0–2.0 | 899 | $2,440 | $2.71 | 24d | 1 | 1.27mi |
| 740 Elmwood Ave Buffalo, NY | 3.0 | 1.0 | 2000 | $1,995 | $1.00 | 14d | 1 | 1.29mi |
| 569 Elmwood Ave Buffalo, NY | 2.0 | 1.0 | 1500 | $1,750 | $1.17 | 12d | 1 | 1.33mi |
| 202 Summit Ave Unit 1 Buffalo, NY | 3.0 | 1.0 | 2000 | $2,400 | $1.20 | 24d | 1 | 1.39mi |
| 552 Potomac Ave Buffalo, NY | 2.0 | 1.0 | 2500 | $2,200 | $0.88 | 44d | 1 | 1.42mi |
| 451 Elmwood Ave Buffalo, NY | 2.0 | 1.0 | 1633 | $3,305 | $2.02 | 44d | 1 | 1.42mi |
| 79 Walden Ave Buffalo, NY | 3.0 | 1.0 | 2528 | $1,250 | $0.49 | 44d | 1 | 1.44mi |
| 19 North St Buffalo, NY | 2.0 | 1.0–2.0 | 1306 | $2,910 | $2.23 | 10d | 7 | 1.46mi |
Listing history 11 events
-
2026-06-18days on market $179,900 Active 12 DOM
-
2026-06-17days on market $179,900 Active 11 DOM
-
2026-06-16days on market $179,900 Active 10 DOM
-
2026-06-15days on market $179,900 Active 9 DOM
-
2026-06-13days on market $179,900 Active 7 DOM
-
2026-06-13days on market $179,900 Active 6 DOM
-
2026-06-10days on market $179,900 Active 4 DOM
-
2026-06-09days on market $179,900 Active 3 DOM
-
2026-06-08days on market $179,900 Active 2 DOM
-
2026-06-07remarks 685-char remark
-
2026-06-07$179,900 Active 1 DOM
ⓘ Source: listings_history table (triggers on properties + properties_extension) + one-shot
backfill from property_details.listing_events for pre-trigger history.
Tax reassessment forecast NY · Partial reset (capped growth)
- Current annual tax
- $601 · $50/mo
- Projected year-2 tax
- $1,821 · $152/mo
- Expected delta
- +$1,220/yr (+$102/mo · 202.9%)
ⓘ Screening estimate from a state-policy table — verify with the county assessor before closing.
Climate risk First Street
- Flood 1/10 Low FEMA zone X (unshaded) · 0% chance over 30 yrs
- Wildfire 1/10 Low
- Heat 3/10 Moderate 7 d/yr ≥91°F today · 15 d/yr by 30 yrs out
- Wind 1/10 Low
- Air quality 4/10 Moderate 4 unhealthy d/yr today · 9 by 30 yrs out
Nearby sold comps map
Loading sold comps map…
Walkable amenities ~0.75 mi
Loading nearby amenities…
Taxation est. · year 1
- Rental income
- $25,235
- − Mortgage interest
- −$10,077
- − Property taxes
- −$601
- − Insurance
- −$900
- − Repairs & maintenance
- −$2,019
- − Management
- −$2,019
- − Depreciation
- −$5,233
- Taxable income
- $4,386
- Est. tax owed @ 24.0%
- −$1,053
- After-tax cash flow
- $6,062/yr
For passive investors: Depreciation is non-cash, so a rental often shows a tax loss while cash-flowing — sheltering income. Rental losses are passive: they offset passive income freely, and up to $25,000/yr can offset ordinary (W-2) income if you actively participate and your MAGI is under $100k (phasing out to $0 by $150k); unused losses carry forward. On sale, claimed depreciation is recaptured at up to 25%, and gains may owe capital-gains tax (a 1031 exchange can defer both). Figures are a year-1 estimate at your 24.0% rate — not tax advice; consult a CPA.
Schools (NCES district)
- District
- Buffalo City School District
- NCES district ID
- 3605850
- Math proficiency
- 41% ▲ 11.00%
- Reading proficiency
- 40% ▲ 7.00%
- Median HH income
- $31,665
- Composite
- 33.17/100
- National rank
- #5544
- State rank
- #535 of 590 in NY
Livability — Buffalo
- Score
- 77/100
- State rank
- #195
- US rank
- #3011
Category grades
Schools grade is shown separately in the Schools card above.
Census & demographics
- Census place
- Buffalo, NY
- County
- Erie County · 714,559 people
- City population
- 440,021
- Metro
- Buffalo-Cheektowaga, NY
- Population (ZIP)
- 12,572
- Household income
- $48,476
- Rent vs Own
- Severe rent burden
- 723.0
Population outlook (Erie County) Hauer SSP2
- Today (2025)
- 933,037 people
- By 2030
- 935,181 · +0.2%
- By 2040
- 928,531 · -0.5%
- By 2050
- 905,725 · -2.9%
- By 2075
- 834,037 · -10.6%
- By 2100
- 708,033 · -24.1%
Race, ethnicity, and origin ACS 2023
- Neighborhood character
- Predominantly Black (72%)
- Race & ethnicity
- Black 72% White 15% Asian 6% Two or more races 4% Hispanic / Latino 3%
- Common ancestry
- Romanian 2% Italian 1% Hispanic 0%
- Foreign-born
- 7% · Canada, South Korea, Philippines
- Languages at home
- 89% English-only · Other Indo-European 3% Spanish 2% French/Haitian/Cajun 1%
Political lean MEDSL · Erie
- 2024 margin
- Lean D (+9.7) · D 54.8% · R 45.2%
- 2008→2024 swing
- -7.9pp toward R · 2008: 17.5pp · 2024: 9.7pp
- All cycles
- 2024: D+9.7 2020: D+14.7 2016: D+4.8 2012: D+15.6 2008: D+17.5
Not yet ingested
- Civics
- —
Market trends
- HPI YoY
- ▼ -16.37%
- Current HPI
- 459.2084
- Rent YoY
- —
- Metro
- Buffalo-Cheektowaga, NY
- State GDP YoY
- ▲ 2.60%
- F500 in state
- 92
Industry mix (Fortune 500 HQ in NY)
| Industry | F500 HQs | Revenue |
|---|---|---|
| Financial Services | 10 | $950B |
|
||
| Consumer Goods | 9 | $162B |
|
||
| Insurance | 4 | $225B |
|
||
| Telecommunications | 2 | $144B |
|
||
| Pharmaceuticals | 2 | $112B |
|
||
| Media / Entertainment | 2 | $69B |
|
||
Price history
+299.8% since first listed8 events — show timeline
- 2026-06-06 Listed $179,900 WNYREIS
- 2018-07-02 Sold (Public Records) $145,000 Public Records
- 2018-07-02 Sold (Public Records) $145,000 Public Records
- 2018-07-02 Sold (MLS) $145,000 WNYREIS
- 2018-05-26 Pending — WNYREIS
- 2018-05-19 Pending — WNYREIS
- 2018-02-09 Listed $160,000 WNYREIS
- 2017-08-30 Sold (Public Records) $45,000 Public Records
Property tax history
+7.6%/yrLatest (2025): $601 · +44.9% YoY. Source: county tax records.
Cash-flow waterfall
monthlySold comps — $/sqft
last 12 mo · ≤1 miLoading sold comps…